Reports

- Global Locations -

Headquarters

Future Market Insights, Inc.

Christiana Corporate, 200
Continental Drive, Suite 401,
Newark, Delaware - 19713,
United States

T: +1-845-579-5705

Americas

Future Market Insights, Inc.

616 Corporate Way, Suite 2-9018,
Valley Cottage, NY 10989, United States

T: +1-347-918-3531

MEA

Future Market Insights

1602-6 Jumeirah Bay X2 Tower, Plot No: JLT-PH2-X2A,
Jumeirah Lakes Towers, Dubai,
United Arab Emirates

Europe

Future Market Insights

3rd Floor, 207 Regent Street,
W1B 3HH London
United Kingdom

T: + 44 (0) 20 8123 9659
D: +44 (0) 20 3287 4268

Asia Pacific

Future Market Insights

IndiaLand Global Tech Park, Unit UG-1, Behind Grand HighStreet, Phase 1, Hinjawadi, MH, Pune – 411057, India

Plant Based Meat Packaging Market Outlook

The plant based meat packaging market size is projected to be worth US$ 424.6 million in 2023. The market is likely to surpass US$ 987.0 million by 2033 at a CAGR of 8.8% during the forecast period. The rise in the trend of plant-based food diet and the increasing demand of plant based meat is driving the demand of plant based meat packaging; which resulted in the rising demand of the plant based meat packaging. The rise in the consumption of the plant based meat will eventually increase the growth of the plant based meat packaging market. The shelf life of the plant based meat can be increased by the packaging.

Other Drivers Propelling the Demand for Plant Based Meat Packaging include:

  • The rise in the trend of the high protein plant based diet is driving the growth of the plant based meat packaging market.
  • The eco-friendly packaging, which is not harmful for the environment and which can be recycled, is helping to grow the plant based meat packaging market.
  • The rise in the consumption of packaged food, due to the growing concern towards hygiene is the factor which is helping the market grow.

Challenges for Companies /Manufacturers in the Plant Based Meat Packaging Market:

  • The manufacturer face challenges due to the government regulation which are imposed on plastic packaging.
  • High initial cost is also one of the factor, which can hinder the market growth.
  • The plant based meat can degrade if exposed to atmosphere which is the main challenges faced by the manufacturer of plant based meat packaging.
  • The manufacturers are trying to reduce manufacturing cost. Due to the high production cost, the manufacturers are facing challenges in selling their products with less margin.

Opportunities in the plant based meat packaging Industry:

  • With the rise in concern towards health, people are shifting their preferences towards plant based diets which can be an increase in the adoption of plant based meat packaging.
  • With the increase in the consumption of packaged or ready to eat products the growth of the plant based meat packaging market can be seen.
  • The production of the plant based meat packaging which can be 100% recycled can be considered as the major opportunity which can drive the growth of the market.

Latest Trends in the Plant Based Meat Packaging Market:

  • Most of the manufacturers are using packages made of synthetic materials which can help in keeping the food fresh for a longer period of time.
  • The manufacturers are focusing on producing products which can sustain for longer period of time, and which can be renewed for the further use.
  • The manufacturers, to improve the shelf life of the plant based meat packaging, use the use of the techniques, which can reduce the oxygen concentration.
Attribute Details
Plant Based Meat Packaging Market Size (2023) US$ 424.6 million
Plant Based Meat Packaging Market Projected Size (2033) US$ 987.0 million
Value CAGR (2023 to 2033) 8.8%

Don't pay for what you don't need

Customize your report by selecting specific countries or regions and save 30%!

2018 to 2022 Plant Based Meat Packaging Demand Outlook Compared to 2023 to 2033 Forecast

From 2018 to 2022, the global plant based meat packaging market experienced a CAGR of 3.7%, reaching a market size of US$ 390.3 million in 2022.

From 2018 to 2022, with the rise in the demand for packaged food, the growth of the market is observed. Also with the rise in concern towards healthy and hygienic foods, the growth of the plant based meat packaging can be seen. Additionally, the implementation of regulations by the government propelled the market growth during this period.

Future Forecast for Plant Based Meat Packaging Industry

Looking ahead, the global plant based meat packaging industry is expected to rise at a CAGR of 8.8% from 2023 to 2033. During the forecast period, the market size is expected to reach US$ 987.0 million.

The plant based meat packaging industry is expected to continue its growth trajectory from 2023 to 2033, driven by increasing concerns over rising health issues with the consumption of animal based meat.

The North-America holds the largest market share, and also dominates the growth of the market. However, the growth of the market can be hindered by the high manufacturing cost of the plant based meat packaging manufacturing.

Ismail Sutaria
Ismail Sutaria

Principal Consultant

Talk to Analyst

Find your sweet spots for generating winning opportunities in this market.

Comparative View of the Plant Based Meat Packaging Market

Plant Based Meat Packaging Market:

Attributes Plant Based Meat Packaging Market
CAGR (2023 to 2033) 8.8%
Market Value (2033) US$ 987.0 million
Opportunity With the increase in the consumption of packaged or ready to eat products the growth of the plant based meat packaging market can be seen.
Key Trends Most of the manufacturers are using packages made of synthetic materials, which can help in keeping the food fresh for a longer period of time.

Meat Packaging Market:

Attributes Meat Packaging Market
CAGR (2023 to 2033) 5.2%
Market Value (2033) US$ 12.3 billion
Opportunity Increased consumption of packaged food, growing concern towards hygiene, and high demand for packaging that helps to extend shelf life without altering the properties of meat products are expected to boost meat packaging sales
Key Trends There has been a dramatic rise in the production and consumption of meat and poultry products worldwide due to their high nutritional content, and this trend is expected to further escalate during the projection period.

Dairy Product Packaging Market:

Attributes Dairy Product Packaging Market
CAGR (2023 to 2033) 4.5%
Market Value (2033) US$ 62.91 billion
Opportunity Due to the large inventory of milk in powdered form keeping overall profitability margins low, producers are reluctant to make fresh investments.
Key Trends Trends in global dairy market show that producers are trying to achieve product differentiation through packaging. Eye catching, and aseptic features are common in present-day dairy products packaging formats.

Country-Wise Insights

Plant Based Meat Packaging Market to Surge in the United States Amid the Rising Consumers.

Country United States
Market Size (US$ million) by End of Forecast Period (2033) US$ 144.2 million
CAGR % 2023 to End of Forecast (2033) 4.6%

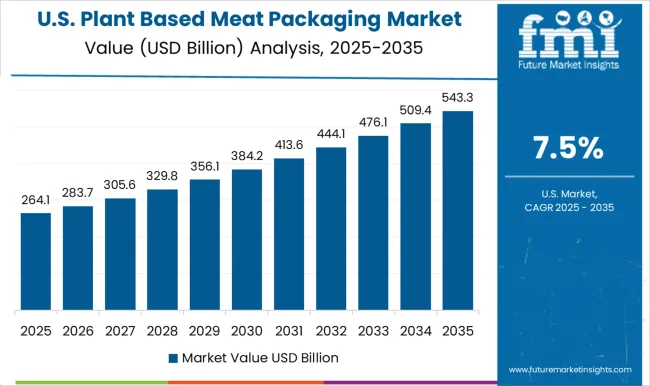
The plant based meat packaging industry in the United States is expected to reach a market share of US$ 144.2 million by 2033, expanding at a CAGR of 4.6%. The plant based meat packaging industry in the United States is expected to dominate the growth of the market, with the highest number of consumers. Additionally, the presence of large number of manufacturers is also the reason for United States to hold the largest market share.

The Rising Popularity for the Flexitarian Diet to Propel the United Kingdom Market Growth

Country United Kingdom
Market Size (US$ million) by End of Forecast Period (2033) US$ 13.8 million
CAGR % 2023 to End of Forecast (2033) 1.8%

The plant based meat packaging industry in the United Kingdom is expected to reach a market share of US$ 13.8 million, expanding at a CAGR of 1.8% during the forecast period. The United Kingdom market is projected to experience growth owing to the rising popularity for the flexitarian diet. The rise in the plant based meat will eventually rise the packaging market. Most of the consumers think that plant based diet are healthier, which is boosting the growth of the market in the country.
Notable Growth Expected in China's Plant Based Meat Packaging Market as Government Focuses on Manufacturing Products Which can be Recycled.

Country China
Market Size (US$ million) by End of Forecast Period (2033) US$ 131.3 million
CAGR % 2023 to End of Forecast (2033) 6.0%

The plant based meat packaging industry in China is anticipated to reach a market share of US$ 131.3 million, moving at a CAGR of 6.0% during the forecast period. The rise of the market in the country is seen due to the companies investing in research and development, to manufacture products which can be 100% recycled.

Get the data you need at a Fraction of the cost

Personalize your report by choosing insights you need
and save 40%!

Category-Wise Insights

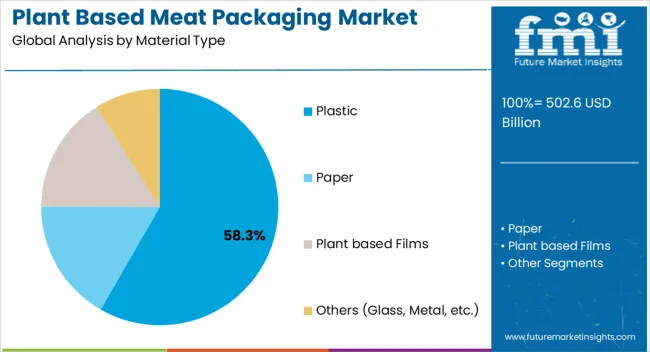
Plastic Segment to Dominate Plant Based Meat Packaging Industry with 5.4% CAGR through 2033

The plastic segment is expected to dominate the plant based meat packaging industry with a CAGR of 5.4% from 2022 to 2033. This segment captures a significant market share in 2023 due to its cost-effectiveness, high efficiency, and low maintenance requirements. The plastic segment comes under various types of products, which can be chosen according to the need of the manufacturer. With the good barrier property, the plastic segment dominates the growth of the market.

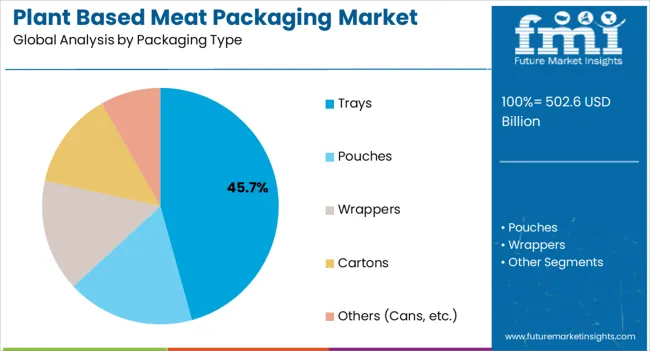
Which Packaging Type is Driving the Plant Based Meat Packaging Market?

The pouch segment is expected to dominate the plant based meat packaging industry with a CAGR of 5.1% from 2022 to 2033. This segment captures a significant market share in 2023 due to the high demand for foods like meat, poultry, etc. Pouches helps to prevent the food from spoiling and combat food waste.

How Key Players Stay Competitive in the Plant Based Meat Packaging Industry?

The plant based meat packaging industry is highly competitive, with numerous players vying for market share. In such a scenario, key players must adopt effective strategies to stay ahead of the competition.

Key Strategies Adopted by the Players

  • Strategic Partnerships and Collaborations

Key players in the market collaborate and form partnership in order to gain market share; which can help companies to gain access to new technologies and markets.

  • Product Innovation

Companies are currently investing in research and development, which can help in enhancing efficiency and reduce cost of the product. It can help in competing with their competitors in the market.

  • Expansion into Emerging Markets

India and China are the emerging markets, which are growing at a significant rate. Top players are trying to contribute in the market, which can eventually help in company’s growth.

Key Players in the Plant Based Meat Packaging Industry

  • Amcor Plc
  • Sealed Air Corporation
  • Berry Global
  • Oji Holdings

Segmentation Analysis of the Plant Based Meat Packaging Market

By Material Type:

  • Plastic
  • Paper
  • Plant based Films
  • Others (Glass, Metal, etc.)

By Packaging Type:

  • Trays
  • Pouches
  • Wrappers
  • Cartons
  • Others (Cans, etc.)

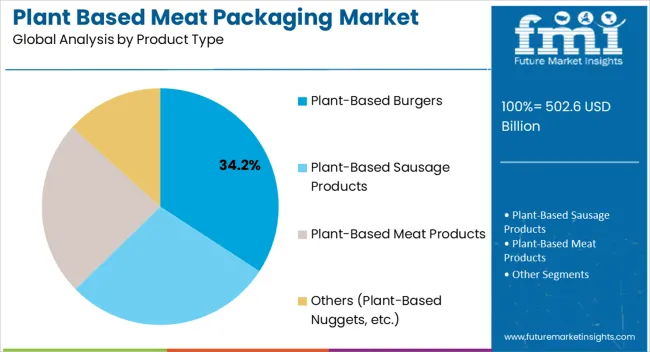
By Product Type:

  • Plant-based Burgers
  • Plant-based Sausage Products
  • Plant-based Meat Products
  • Others (Plant-based Nuggets, etc.)

By Region:

  • North America
  • Latin America
  • Europe
  • East Asia
  • South Asia
  • Oceania
  • The Middle East & Africa

Frequently Asked Questions

What is the market size in 2023?

The market size is expected to be valued at US$ 424.6 million in 2023.

What Limits the Market Growth?

High initial cost limits the market growth.

What is the Historical Performance of the market?

From 2018 to 2022, the global market exhibited a 3.7% CAGR.

Which Packaging Type is driving the market?

The pouch segment is expected to dominate the industry.

How Big will be the Market by 2033?

The market is estimated to reach US$ 987 million by 2033.

Table of Content

1. Executive Summary

    1.1. Global Market Outlook

    1.2. Market Analysis

    1.3. Analysis and Recommendations

2. Market Overview

    2.1. Market Coverage / Taxonomy

    2.2. Market Definition / Scope / Limitations

3. Key Market Trends

    3.1. Key Trends Impacting the Market

    3.2. Sustainable Trends

    3.3. Technological Trends

    3.4. Product Innovation / Development Trends

4. Key Success Factors

    4.1. Product Adoption / Usage Analysis

    4.2. Product USPs / Features

    4.3. Strategic Promotional Strategies

    4.4. Go-to-market Strategies

5. Global Market Demand Analysis 2018 to 2022 and Forecast, 2023 to 2033

    5.1. Historical Market Volume (Units) Analysis, 2018 to 2022

    5.2. Current and Future Market Volume (Units) Projections, 2023 to 2033

    5.3. Y-o-Y Growth Trend Analysis

6. Global Market - Pricing Analysis

    6.1. Regional Pricing Analysis

    6.2. Global Average Pricing Analysis Benchmark

7. Global Market Demand (in Value or Size in US$ Million) Analysis 2018 to 2022 and Forecast, 2023 to 2033

    7.1. Historical Market Value (US$ Million) Analysis, 2018 to 2022

    7.2. Current and Future Market Value (US$ Million) Projections, 2023 to 2033

        7.2.1. Y-o-Y Growth Trend Analysis

        7.2.2. Absolute $ Opportunity Analysis

8. Market Background

    8.1. Global Packaging Machinery Market Overview

    8.2. Forecast Factors - Relevance & Impact

    8.3. Value Chain Analysis & Profitability Margin

        8.3.1. Exhaustive List of Component Suppliers

        8.3.2. Exhaustive List of Distribution Machines/ Converters/Distributors

        8.3.3. Exhaustive List of Brand Owners/ Customer Base

    8.4. Case-based Scenario - Impact Assessment

        8.4.1. Current Statistics

        8.4.2. Short-Mid-Long Term Outlook

        8.4.3. Likely Rebound

    8.5. Market Dynamics

        8.5.1. Drivers

        8.5.2. Restraints

        8.5.3. Opportunity Analysis

    8.6. Supply Demand Analysis

        8.6.1. Import /Export Analysis

9. Global Market Analysis 2018 to 2022 and Forecast 2023 to 2033, By Material Type

    9.1. Introduction / Key Findings

    9.2. Historical Market Size (US$ Million) and Volume (Units) Analysis By Material Type, 2018 to 2022

    9.3. Current and Future Market Size (US$ Million) and Volume (Units) Analysis and Forecast By Material Type, 2023 to 2033

        9.3.1. Plastic

        9.3.2. Paper

        9.3.3. Plant based Films

        9.3.4. Others (Glass, Metal, etc.)

    9.4. Market Attractiveness Analysis By Material Type

10. Global Market Analysis 2018 to 2022 and Forecast 2023 to 2033, By Packaging Type

    10.1. Introduction/Key Findings

    10.2. Historical Market Size (US$ Million) and Volume (Units) Analysis By Machine Type, 2018-2022

    10.3. Current and Future Market Size (US$ Million) and Volume (Units) Analysis and Forecast By Machine Type, 2023-2033

        10.3.1. Trays

        10.3.2. Pouches

        10.3.3. Wrappers

        10.3.4. Cartons

        10.3.5. Others (Cans, etc.)

    10.4. Market Attractiveness Analysis By Packaging Type

11. Global Market Analysis 2018 to 2022 and Forecast 2023 to 2033, By Product Type

    11.1. Introduction / Key Findings

    11.2. Historical Market Size (US$ Million) and Volume (Units) Analysis By Packaging Type, 2018 to 2022

    11.3. Current and Future Market Size (US$ Million) and Volume (Units) Analysis and Forecast By Product Type, 2023 to 2033

        11.3.1. Plant-based Burgers

        11.3.2. Plant-based Sausage Products

        11.3.3. Plant-based Meat Products

        11.3.4. Others (Plant-based Nuggets, etc.)

    11.4. Market Attractiveness Analysis By Product Type

12. Global Market Analysis 2018 to 2022 and Forecast 2023 to 2033, By Region

    12.1. Introduction / Key Findings

    12.2. Historical Market Size (US$ Million) and Volume (Units) Analysis By Region, 2018 to 2022

    12.3. Current and Future Market Size (US$ Million) and Volume (Units) Analysis and Forecast By Region, 2023 to 2033

        12.3.1. North America

        12.3.2. Latin America

        12.3.3. East Asia

        12.3.4. South Asia & Pacific

        12.3.5. Western Europe

        12.3.6. Eastern Europe

        12.3.7. Central Asia

        12.3.8. Russia & Belarus

        12.3.9. Balkan & Baltic Countries

        12.3.10. Middle East and Africa (MEA)

    12.4. Market Attractiveness Analysis By Region

13. North America Market Analysis 2018 to 2022 and Forecast 2023 to 2033

    13.1. Introduction / Key Findings

    13.2. Historical Market Size (US$ Million) and Volume (Units) Analysis by Market Taxonomy, 2018 to 2022

    13.3. Current Market Size (US$ Million) and Volume (Units) Analysis and Forecast by Market Taxonomy, 2023 to 2033

        13.3.1. By Region

            13.3.1.1. USA

            13.3.1.2. Canada

        13.3.2. By Material Type

        13.3.3. By Packaging Type

        13.3.4. By Product Type

    13.4. Market Attractiveness Analysis

        13.4.1. By Region

        13.4.2. By Material Type

        13.4.3. By Packaging Type

        13.4.4. By Product Type

14. Latin America Market Analysis 2018 to 2022 and Forecast 2023 to 2033

    14.1. Introduction / Key Findings

    14.2. Historical Market Size (US$ Million) and Volume (Units) Analysis by Market Taxonomy, 2018 to 2022

    14.3. Current Market Size (US$ Million) and Volume (Units) Analysis and Forecast by Market Taxonomy, 2023 to 2033

        14.3.1. By Region

            14.3.1.1. Brazil

            14.3.1.2. Mexico

            14.3.1.3. Argentina

            14.3.1.4. Rest of Latin America

        14.3.2. By Material Type

        14.3.3. By Packaging Type

        14.3.4. By Product Type

    14.4. Market Attractiveness Analysis

        14.4.1. By Region

        14.4.2. By Material Type

        14.4.3. By Packaging Type

        14.4.4. By Product Type

15. East Asia Market Analysis 2018 to 2022 and Forecast 2023 to 2033

    15.1. Introduction / Key Findings

    15.2. Historical Market Size (US$ Million) and Volume (Units) Analysis by Market Taxonomy, 2018 to 2022

    15.3. Current Market Size (US$ Million) and Volume (Units) Analysis and Forecast by Market Taxonomy, 2023 to 2033

        15.3.1. By Region

            15.3.1.1. China

            15.3.1.2. Japan

            15.3.1.3. South Korea

        15.3.2. By Material Type

        15.3.3. By Packaging Type

        15.3.4. By Product Type

    15.4. Market Attractiveness Analysis

        15.4.1. By Region

        15.4.2. By Material Type

        15.4.3. By Packaging Type

        15.4.4. By Product Type

16. South Asia & Pacific Market Analysis 2018 to 2022 and Forecast 2023 to 2033

    16.1. Introduction / Key Findings

    16.2. Historical Market Size (US$ Million) and Volume (Units) Analysis by Market Taxonomy, 2018 to 2022

    16.3. Current Market Size (US$ Million) and Volume (Units) Analysis and Forecast by Market Taxonomy, 2023 to 2033

        16.3.1. By Region

            16.3.1.1. India

            16.3.1.2. ASEAN

            16.3.1.3. Australia & New Zealand

        16.3.2. By Material Type

        16.3.3. By Packaging Type

        16.3.4. By Product Type

    16.4. Market Attractiveness Analysis

        16.4.1. By Region

        16.4.2. By Material Type

        16.4.3. By Packaging Type

        16.4.4. By Product Type

17. Western Europe Market Analysis 2018 to 2022 and Forecast 2023 to 2033

    17.1. Introduction / Key Findings

    17.2. Historical Market Size (US$ million) and Volume (Units) Analysis by Market Taxonomy, 2018 to 2022

    17.3. Current Market Size (US$ million) and Volume (Units) Analysis and Forecast by Market Taxonomy, 2023 to 2033

        17.3.1. By Region

            17.3.1.1. Germany

            17.3.1.2. France

            17.3.1.3. Spain

            17.3.1.4. Italy

            17.3.1.5. United Kingdom

            17.3.1.6. BENELUX

            17.3.1.7. Nordics

            17.3.1.8. Rest of Western Europe

        17.3.2. By Material Type

        17.3.3. By Packaging Type

        17.3.4. By Product Type

    17.4. Market Attractiveness Analysis

        17.4.1. By Region

        17.4.2. By Material Type

        17.4.3. By Packaging Type

        17.4.4. By Product Type

18. Eastern Europe Market Analysis 2018 to 2022 and Forecast 2023 to 2033

    18.1. Introduction / Key Findings

    18.2. Historical Market Size (US$ million) and Volume (Units) Analysis by Market Taxonomy, 2018 to 2022

    18.3. Current Market Size (US$ million) and Volume (Units) Analysis and Forecast by Market Taxonomy, 2023 to 2033

        18.3.1. By Region

            18.3.1.1. Poland

            18.3.1.2. Hungary

            18.3.1.3. Austria

            18.3.1.4. Czech Republic

            18.3.1.5. Rest of Eastern Europe

        18.3.2. By Material Type

        18.3.3. By Packaging Type

        18.3.4. By Product Type

    18.4. Market Attractiveness Analysis

        18.4.1. By Region

        18.4.2. By Material Type

        18.4.3. By Packaging Type

        18.4.4. By Product Type

19. Central Asia Market Analysis 2018 to 2022 and Forecast 2023 to 2033

    19.1. Introduction / Key Findings

    19.2. Historical Market Size (US$ million) and Volume (Units) Analysis by Market Taxonomy, 2018 to 2022

    19.3. Current Market Size (US$ million) and Volume (Units) Analysis and Forecast by Market Taxonomy, 2023 to 2033

        19.3.1. By Region

            19.3.1.1. Kazakhstan

            19.3.1.2. Kyrgyzstan

            19.3.1.3. Tajikistan

            19.3.1.4. Turkmenistan

            19.3.1.5. Uzbekistan

        19.3.2. By Material Type

        19.3.3. By Packaging Type

        19.3.4. By Product Type

    19.4. Market Attractiveness Analysis

        19.4.1. By Region

        19.4.2. By Material Type

        19.4.3. By Packaging Type

        19.4.4. By Product Type

20. Russia & Belarus Market Analysis 2018 to 2022 and Forecast 2023 to 2033

    20.1. Introduction / Key Findings

    20.2. Historical Market Size (US$ million) and Volume (Units) Analysis by Market Taxonomy, 2018 to 2022

    20.3. Current Market Size (US$ million) and Volume (Units) Analysis and Forecast by Market Taxonomy, 2023 to 2033

        20.3.1. By Region

            20.3.1.1. Russia

            20.3.1.2. Belarus

        20.3.2. By Material Type

        20.3.3. By Packaging Type

        20.3.4. By Product Type

    20.4. Market Attractiveness Analysis

        20.4.1. By Region

        20.4.2. By Material Type

        20.4.3. By Packaging Type

        20.4.4. By Product Type

21. Balkan Countries Market Analysis 2018 to 2022 and Forecast 2023 to 2033

    21.1. Introduction / Key Findings

    21.2. Historical Market Size (US$ million) and Volume (Units) Analysis by Market Taxonomy, 2018 to 2022

    21.3. Current Market Size (US$ million) and Volume (Units) Analysis and Forecast by Market Taxonomy, 2023 to 2033

        21.3.1. By Region

            21.3.1.1. Romania

            21.3.1.2. Greece

            21.3.1.3. Bulgaria

        21.3.2. By Material Type

        21.3.3. By Packaging Type

        21.3.4. By Product Type

    21.4. Market Attractiveness Analysis

        21.4.1. By Region

        21.4.2. By Material Type

        21.4.3. By Packaging Type

        21.4.4. By Product Type

22. Baltic Countries Market Analysis 2018 to 2022 and Forecast 2023 to 2033

    22.1. Introduction / Key Findings

    22.2. Historical Market Size (US$ million) and Volume (Units) Analysis by Market Taxonomy, 2018 to 2022

    22.3. Current Market Size (US$ million) and Volume (Units) Analysis and Forecast by Market Taxonomy, 2023 to 2033

        22.3.1. By Region

            22.3.1.1. Lithuania

            22.3.1.2. Estonia

            22.3.1.3. Latvia

        22.3.2. By Material Type

        22.3.3. By Packaging Type

        22.3.4. By Product Type

    22.4. Market Attractiveness Analysis

        22.4.1. By Region

        22.4.2. By Material Type

        22.4.3. By Packaging Type

        22.4.4. By Product Type

23. Middle East & Africa Market Analysis 2018 to 2022 and Forecast 2023 to 2033

    23.1. Introduction / Key Findings

    23.2. Historical Market Size (US$ million) and Volume (Units) Analysis by Market Taxonomy, 2018 to 2022

    23.3. Current Market Size (US$ million) and Volume (Units) Analysis and Forecast by Market Taxonomy, 2023 to 2033

        23.3.1. By Region

            23.3.1.1. GCC Countries

            23.3.1.2. Turkey

            23.3.1.3. Northern Africa

            23.3.1.4. South Africa

            23.3.1.5. Israel

        23.3.2. By Material Type

        23.3.3. By Packaging Type

        23.3.4. By Product Type

    23.4. Market Attractiveness Analysis

        23.4.1. By Region

        23.4.2. By Material Type

        23.4.3. By Packaging Type

        23.4.4. By Product Type

24. Region wise Market Analysis 2023 & 2033

    24.1. USA Market Analysis

        24.1.1. By Material Type

        24.1.2. By Packaging Type

        24.1.3. By Product Type

    24.2. Canada Market Analysis

        24.2.1. By Material Type

        24.2.2. By Packaging Type

        24.2.3. By Product Type

    24.3. Brazil Market Analysis

        24.3.1. By Material Type

        24.3.2. By Packaging Type

        24.3.3. By Product Type

    24.4. Mexico Market Analysis

        24.4.1. By Material Type

        24.4.2. By Packaging Type

        24.4.3. By Product Type

    24.5. Germany Market Analysis

        24.5.1. By Material Type

        24.5.2. By Packaging Type

        24.5.3. By Product Type

    24.6. UK Market Analysis

        24.6.1. By Material Type

        24.6.2. By Packaging Type

        24.6.3. By Product Type

    24.7. Spain Market Analysis

        24.7.1. By Material Type

        24.7.2. By Packaging Type

        24.7.3. By Product Type

    24.8. France Market Analysis

        24.8.1. By Material Type

        24.8.2. By Packaging Type

        24.8.3. By Product Type

    24.9. Italy Market Analysis

        24.9.1. By Material Type

        24.9.2. By Packaging Type

        24.9.3. By Product Type

    24.10. Russia Market Analysis

        24.10.1. By Material Type

        24.10.2. By Packaging Type

        24.10.3. By Product Type

    24.11. China Market Analysis

        24.11.1. By Material Type

        24.11.2. By Packaging Type

        24.11.3. By Product Type

    24.12. Japan Market Analysis

        24.12.1. By Material Type

        24.12.2. By Packaging Type

        24.12.3. By Product Type

    24.13. India Market Analysis

        24.13.1. By Material Type

        24.13.2. By Packaging Type

        24.13.3. By Product Type

    24.14. GCC Countries Market Analysis

        24.14.1. By Material Type

        24.14.2. By Packaging Type

        24.14.3. By Product Type

    24.15. Australia Market Analysis

        24.15.1. By Material Type

        24.15.2. By Packaging Type

        24.15.3. By Product Type

25. Market Structure Analysis

    25.1. Market Analysis by Tier of Companies

    25.2. Market Share Analysis of Top Players

    25.3. Market Presence Analysis

26. Competition Analysis

    26.1. Competition Dashboard

    26.2. Competition Benchmarking

    26.3. Competition Deep Dive

        26.3.1. Amcor Plc

            26.3.1.1. Overview

            26.3.1.2. Product Portfolio

            26.3.1.3. Profitability by Market Segments (Automation/Product/Region)

            26.3.1.4. Sales Footprint

            26.3.1.5. Strategy Overview

        26.3.2. Sealed Air Corporation

            26.3.2.1. Overview

            26.3.2.2. Product Portfolio

            26.3.2.3. Profitability by Market Segments (Automation/Product/Region)

            26.3.2.4. Sales Footprint

            26.3.2.5. Strategy Overview

        26.3.3. Berry Global Inc.

            26.3.3.1. Overview

            26.3.3.2. Product Portfolio

            26.3.3.3. Profitability by Market Segments (Automation/Product/Region)

            26.3.3.4. Sales Footprint

            26.3.3.5. Strategy Overview

        26.3.4. Oji Holdings

            26.3.4.1. Overview

            26.3.4.2. Product Portfolio

            26.3.4.3. Profitability by Market Segments (Automation/Product/Region)

            26.3.4.4. Sales Footprint

            26.3.4.5. Strategy Overview

27. Assumptions and Acronyms Used

28. Research Methodology

List of Tables

Table 01: Global Market Value (US$ Million) Analysis, By Material Type, 2018H to 2033F

Table 02: Global Market Volume (Tonnes) Analysis, By Material Type, 2018H to 2033F

Table 03: Global Market Value (US$ Million) Analysis, by Packaging Type, 2018H to 2033F

Table 04: Global Market Volume (Tonnes) Analysis, by Packaging Type, 2018H to 2033F

Table 05: Global Market Value (US$ Million) Analysis, by Product Type, 2018H to 2033F

Table 06: Global Market Volume (Tonnes) Analysis, by Product Type, 2018H to 2033F

Table 07: Global Market Value (US$ Million) Analysis, by Region, 2018H to 2033F

Table 08: Global Market Volume (Tonnes) Analysis, by Region, 2018H to 2033F

Table 09: North America Market Value (US$ Million) Analysis, By Material Type, 2018H to 2033F

Table 10: North America Market Volume (Tonnes) Analysis, By Material Type, 2018H to 2033F

Table 11: North America Market Value (US$ Million) Analysis, by Packaging Type, 2018H to 2033F

Table 12: North America Market Volume (Tonnes) Analysis, by Packaging Type, 2018H to 2033F

Table 13: North America Market Value (US$ Million) Analysis, by Product Type, 2018H to 2033F

Table 14: North America Market Volume (Tonnes) Analysis, by Product Type, 2018H to 2033F

Table 15: North America Market Value (US$ Million) Analysis, by Country, 2018H to 2033F

Table 16: North America Market Volume (Tonnes) Analysis, by Country, 2018H to 2033F

Table 17: Latin America Market Value (US$ Million) Analysis, By Material Type, 2018H to 2033F

Table 18: Latin America Market Volume (Tonnes) Analysis, By Material Type, 2018H to 2033F

Table 19: Latin America Market Value (US$ Million) Analysis, by Packaging Type, 2018H to 2033F

Table 20: Latin America Market Volume (Tonnes) Analysis, by Packaging Type, 2018H to 2033F

Table 21: Latin America Market Value (US$ Million) Analysis, by Product Type, 2018H to 2033F

Table 22: Latin America Market Volume (Tonnes) Analysis, by Product Type, 2018H to 2033F

Table 23: Latin America Market Value (US$ Million) Analysis, by Country, 2018H to 2033F

Table 24: Latin America Market Volume (Tonnes) Analysis, by Country, 2018H to 2033F

Table 25: East Asia Market Value (US$ Million) Analysis, By Material Type, 2018H to 2033F

Table 26: East Asia Market Volume (Tonnes) Analysis, By Material Type, 2018H to 2033F

Table 27: East Asia Market Value (US$ Million) Analysis, by Packaging Type, 2018H to 2033F

Table 28: East Asia Market Volume (Tonnes) Analysis, by Packaging Type, 2018H to 2033F

Table 29: East Asia Market Value (US$ Million) Analysis, by Product Type, 2018H to 2033F

Table 30: East Asia Market Volume (Tonnes) Analysis, by Product Type, 2018H to 2033F

Table 31: East Asia Market Value (US$ Million) Analysis, by Country, 2018H to 2033F

Table 32: East Asia Market Volume (Tonnes) Analysis, by Country, 2018H to 2033F

Table 33: South Asia & Pacific Market Value (US$ Million) Analysis, By Material Type, 2018H to 2033F

Table 34: South Asia & Pacific Market Volume (Tonnes) Analysis, By Material Type, 2018H to 2033F

Table 35: South Asia & Pacific Market Value (US$ Million) Analysis, by Packaging Type, 2018H to 2033F

Table 36: South Asia & Pacific Market Volume (Tonnes) Analysis, by Packaging Type, 2018H to 2033F

Table 37: South Asia & Pacific Market Value (US$ Million) Analysis, by Product Type, 2018H to 2033F

Table 38: South Asia & Pacific Market Volume (Tonnes) Analysis, by Product Type, 2018H to 2033F

Table 39: South Asia & Pacific Market Value (US$ Million) Analysis, by Country, 2018H to 2033F

Table 40: South Asia & Pacific Market Volume (Tonnes) Analysis, by Country, 2018H to 2033F

Table 41: Western Europe Market Value (US$ Million) Analysis, By Material Type, 2018H to 2033F

Table 42: Western Europe Market Volume (Tonnes) Analysis, By Material Type, 2018H to 2033F

Table 43: Western Europe Market Value (US$ Million) Analysis, by Packaging Type, 2018H to 2033F

Table 44: Western Europe Market Volume (Tonnes) Analysis, by Packaging Type, 2018H to 2033F

Table 45: Western Europe Market Value (US$ Million) Analysis, by Product Type, 2018H to 2033F

Table 46: Western Europe Market Volume (Tonnes) Analysis, by Product Type, 2018H to 2033F

Table 47: Western Europe Market Value (US$ Million) Analysis, by Country, 2018H to 2033F

Table 48: Western Europe Market Volume (Tonnes) Analysis, by Country, 2018H to 2033F

Table 49: Eastern Europe Market Value (US$ Million) Analysis, By Material Type, 2018H to 2033F

Table 50: Eastern Europe Market Volume (Tonnes) Analysis, By Material Type, 2018H to 2033F

Table 51: Eastern Europe Market Value (US$ Million) Analysis, by Packaging Type, 2018H to 2033F

Table 52: Eastern Europe Market Volume (Tonnes) Analysis, by Packaging Type, 2018H to 2033F

Table 53: Eastern Europe Market Value (US$ Million) Analysis, by Product Type, 2018H to 2033F

Table 54: Eastern Europe Market Volume (Tonnes) Analysis, by Product Type, 2018H to 2033F

Table 55: Eastern Europe Market Value (US$ Million) Analysis, by Country, 2018H to 2033F

Table 56: Eastern Europe Market Volume (Tonnes) Analysis, by Country, 2018H to 2033F

Table 57: Central Asia Market Value (US$ Million) Analysis, By Material Type, 2018H to 2033F

Table 58: Central Asia Market Volume (Tonnes) Analysis, By Material Type, 2018H to 2033F

Table 59: Central Asia Market Value (US$ Million) Analysis, by Packaging Type, 2018H to 2033F

Table 60: Central Asia Market Volume (Tonnes) Analysis, by Packaging Type, 2018H to 2033F

Table 61: Central Asia Market Value (US$ Million) Analysis, by Product Type, 2018H to 2033F

Table 62: Central Asia Market Volume (Tonnes) Analysis, by Product Type, 2018H to 2033F

Table 63: Central Asia Market Value (US$ Million) Analysis, by Country, 2018H to 2033F

Table 64: Central Asia Market Volume (Tonnes) Analysis, by Country, 2018H to 2033F

Table 65: Russia & Belarus Market Value (US$ Million) Analysis, By Material Type, 2018H to 2033F

Table 66: Russia & Belarus Market Volume (Tonnes) Analysis, By Material Type, 2018H to 2033F

Table 67: Russia & Belarus Market Value (US$ Million) Analysis, by Packaging Type, 2018H to 2033F

Table 68: Russia & Belarus Market Volume (Tonnes) Analysis, by Packaging Type, 2018H to 2033F

Table 69: Russia & Belarus Market Value (US$ Million) Analysis, by Product Type, 2018H to 2033F

Table 70: Russia & Belarus Market Volume (Tonnes) Analysis, by Product Type, 2018H to 2033F

Table 71: Russia & Belarus Market Value (US$ Million) Analysis, by Country, 2018H to 2033F

Table 72: Russia & Belarus Market Volume (Tonnes) Analysis, by Country, 2018H to 2033F

Table 73: Balkan Countries Market Value (US$ Million) Analysis, By Material Type, 2018H to 2033F

Table 74: Balkan Countries Market Volume (Tonnes) Analysis, By Material Type, 2018H to 2033F

Table 75: Balkan Countries Market Value (US$ Million) Analysis, by Packaging Type, 2018H to 2033F

Table 76: Balkan Countries Market Volume (Tonnes) Analysis, by Packaging Type, 2018H to 2033F

Table 77: Balkan Countries Market Value (US$ Million) Analysis, by Product Type, 2018H to 2033F

Table 78: Balkan Countries Market Volume (Tonnes) Analysis, by Product Type, 2018H to 2033F

Table 79: Balkan Countries Market Value (US$ Million) Analysis, by Country, 2018H to 2033F

Table 80: Balkan Countries Market Volume (Tonnes) Analysis, by Country, 2018H to 2033F

Table 81: Baltic Countries Market Value (US$ Million) Analysis, By Material Type, 2018H to 2033F

Table 82: Baltic Countries Market Volume (Tonnes) Analysis, By Material Type, 2018H to 2033F

Table 83: Baltic Countries Market Value (US$ Million) Analysis, by Packaging Type, 2018H to 2033F

Table 84: Baltic Countries Market Volume (Tonnes) Analysis, by Packaging Type, 2018H to 2033F

Table 85: Baltic Countries Market Value (US$ Million) Analysis, by Product Type, 2018H to 2033F

Table 86: Baltic Countries Market Volume (Tonnes) Analysis, by Product Type, 2018H to 2033F

Table 87: Baltic Countries Market Value (US$ Million) Analysis, by Country, 2018H to 2033F

Table 88: Baltic Countries Market Volume (Tonnes) Analysis, by Country, 2018H to 2033F

Table 89: MEA Market Value (US$ Million) Analysis, By Material Type, 2018H to 2033F

Table 90: MEA Market Volume (Tonnes) Analysis, By Material Type, 2018H to 2033F

Table 91: MEA Market Value (US$ Million) Analysis, by Packaging Type, 2018H to 2033F

Table 92: MEA Market Volume (Tonnes) Analysis, by Packaging Type, 2018H to 2033F

Table 93: MEA Market Value (US$ Million) Analysis, by Product Type, 2018H to 2033F

Table 94: MEA Market Volume (Tonnes) Analysis, by Product Type, 2018H to 2033F

Table 95: MEA Market Value (US$ Million) Analysis, by Country, 2018H to 2033F

Table 96: MEA Market Volume (Tonnes) Analysis, by Country, 2018H to 2033F

List of Charts

Figure 01: Global Market Share Analysis By Material Type, 2023E & 2033F

Figure 02: Global Market Y-o-Y Analysis By Material Type, 2018H to 2033F

Figure 03: Global Market Attractiveness Analysis By Material Type, 2023E to 2033F

Figure 04: Global Market Share Analysis by Packaging Type, 2023E & 2033F

Figure 05: Global Market Y-o-Y Analysis by Packaging Type, 2018H to 2033F

Figure 06: Global Market Attractiveness Analysis by Packaging Type, 2023E to 2033F

Figure 07: Global Market Share Analysis by Product Type, 2023E & 2033F

Figure 08: Global Market Y-o-Y Analysis by Product Type, 2018H to 2033F

Figure 09: Global Market Attractiveness Analysis by Product Type, 2023E to 2033F

Figure 10: Global Market Share Analysis by Region 2023E & 2033F

Figure 11: Global Market Y-o-Y Analysis by Region, 2018H to 2033F

Figure 12: Global Market Attractiveness Analysis by Region, 2023E to 2033F

Figure 13: North America Market Attractiveness Analysis by Packaging Type, 2023E to 2033F

Figure 14: North America Market Y-o-Y Analysis By Material Type, 2018H to 2033F

Figure 15: North America Market Value Share Analysis by Product Type 2023(E)

Figure 16: North America Market Share Analysis by Country, 2023E & 2033F

Figure 17: Latin America Market Attractiveness Analysis by Packaging Type, 2023E to 2033F

Figure 18: Latin America Market Y-o-Y Analysis By Material Type, 2018H to 2033F

Figure 19: Latin America Market Value Share Analysis by Product Type 2023(E)

Figure 20: Latin America Market Share Analysis by Country, 2023E & 2033F

Figure 21: East Asia Market Attractiveness Analysis by Packaging Type, 2023E to 2033F

Figure 22: East Asia Market Y-o-Y Analysis By Material Type, 2018H to 2033F

Figure 23: East Asia Market Value Share Analysis by Product Type 2023(E)

Figure 24: East Asia Market Share Analysis by Country, 2023E & 2033F

Figure 25: South Asia & Pacific Market Attractiveness Analysis by Packaging Type, 2023E to 2033F

Figure 26: South Asia & Pacific Market Y-o-Y Analysis By Material Type, 2018H to 2033F

Figure 27: South Asia & Pacific Market Value Share Analysis by Product Type 2023(E)

Figure 28: South Asia & Pacific Market Share Analysis by Country, 2023E & 2033F

Figure 29: Western Europe Market Attractiveness Analysis by Packaging Type, 2023E to 2033F

Figure 30: Western Europe Market Y-o-Y Analysis By Material Type, 2018H to 2033F

Figure 31: Western Europe Market Value Share Analysis by Product Type 2023(E)

Figure 32: Western Europe Market Share Analysis by Country, 2023E & 2033F

Figure 33: Eastern Europe Market Attractiveness Analysis by Packaging Type, 2023E to 2033F

Figure 34: Eastern Europe Market Y-o-Y Analysis By Material Type, 2018H to 2033F

Figure 35: Eastern Europe Market Value Share Analysis by Product Type 2023(E)

Figure 36: Eastern Europe Market Share Analysis by Country, 2023E & 2033F

Figure 37: Central Asia Market Attractiveness Analysis by Packaging Type, 2023E to 2033F

Figure 38: Central Asia Market Y-o-Y Analysis By Material Type, 2018H to 2033F

Figure 39: Central Asia Market Value Share Analysis by Product Type 2023(E)

Figure 40: Central Asia Market Share Analysis by Country, 2023E & 2033F

Figure 41: Russia & Belarus Market Attractiveness Analysis by Packaging Type, 2023E to 2033F

Figure 42: Russia & Belarus Market Y-o-Y Analysis By Material Type, 2018H to 2033F

Figure 43: Russia & Belarus Market Value Share Analysis by Product Type 2023(E)

Figure 44: Russia & Belarus Market Share Analysis by Country, 2023E & 2033F

Figure 45: Balkan Countries Market Attractiveness Analysis by Packaging Type, 2023E to 2033F

Figure 46: Balkan Countries Market Y-o-Y Analysis By Material Type, 2018H to 2033F

Figure 47: Balkan Countries Market Value Share Analysis by Product Type 2023(E)

Figure 48: Balkan Countries Market Share Analysis by Country, 2023E & 2033F

Figure 49: Baltic Countries Market Attractiveness Analysis by Packaging Type, 2023E to 2033F

Figure 50: Baltic Countries Market Y-o-Y Analysis By Material Type, 2018H to 2033F

Figure 51: Baltic Countries Market Value Share Analysis by Product Type 2023(E)

Figure 52: Baltic Countries Market Share Analysis by Country, 2023E & 2033F

Figure 53: MEA Market Attractiveness Analysis by Packaging Type, 2023E to 2033F

Figure 54: MEA Market Y-o-Y Analysis By Material Type, 2018H to 2033F

Figure 55: MEA Market Value Share Analysis by Product Type 2023(E)

Figure 56: MEA Market Share Analysis by Country, 2023E & 2033F

Figure 57: USA Market Value Share Analysis, by Packaging Type, 2023E & 2033F

Figure 58: USA Market Value Share Analysis, By Material Type, 2023E & 2033F

Figure 59: USA Market Value Share Analysis, by Product Type, 2023E & 2033F

Figure 60: Canada Market Value Share Analysis, by Packaging Type, 2023E & 2033F

Figure 61: Canada Market Value Share Analysis, By Material Type, 2023E & 2033F

Figure 62: Canada Market Value Share Analysis, by Product Type, 2023E & 2033F

Figure 63: Brazil Market Value Share Analysis, by Packaging Type, 2023E & 2033F

Figure 64: Brazil Market Value Share Analysis, By Material Type, 2023E & 2033F

Figure 65: Brazil Market Value Share Analysis, by Product Type, 2023E & 2033F

Figure 66: Mexico Market Value Share Analysis, by Packaging Type, 2023E & 2033F

Figure 67: Mexico Market Value Share Analysis, By Material Type, 2023E & 2033F

Figure 68: Mexico Market Value Share Analysis, by Product Type, 2023E & 2033F

Figure 69: Germany Market Value Share Analysis, by Packaging Type, 2023E & 2033F

Figure 70: Germany Market Value Share Analysis, By Material Type, 2023E & 2033F

Figure 71: Germany Market Value Share Analysis, by Product Type, 2023E & 2033F

Figure 72: Italy Market Value Share Analysis, by Packaging Type, 2023E & 2033F

Figure 73: Italy Market Value Share Analysis, By Material Type, 2023E & 2033F

Figure 74: Italy Market Value Share Analysis, by Product Type, 2023E & 2033F

Figure 75: France Market Value Share Analysis, by Packaging Type, 2023E & 2033F

Figure 76: France Market Value Share Analysis, By Material Type, 2023E & 2033F

Figure 77: France Market Value Share Analysis, by Product Type, 2023E & 2033F

Figure 78: United Kingdom Market Value Share Analysis, by Packaging Type, 2023E & 2033F

Figure 79: United Kingdom Market Value Share Analysis, By Material Type, 2023E & 2033F

Figure 80: United Kingdom Market Value Share Analysis, by Product Type, 2023E & 2033F

Figure 81: Spain Market Value Share Analysis, by Packaging Type, 2023E & 2033F

Figure 82: Spain Market Value Share Analysis, By Material Type, 2023E & 2033F

Figure 83: Spain Market Value Share Analysis, by Product Type, 2023E & 2033F

Figure 84: Russia Market Value Share Analysis, by Packaging Type, 2023E & 2033F

Figure 85: Russia Market Value Share Analysis, By Material Type, 2023E & 2033F

Figure 86: Russia Market Value Share Analysis, by Product Type, 2023E & 2033F

Figure 87: GCC Market Value Share Analysis, by Packaging Type, 2023E & 2033F

Figure 88: GCC Market Value Share Analysis, By Material Type, 2023E & 2033F

Figure 89: GCC Market Value Share Analysis, by Product Type, 2023E & 2033F

Figure 90: South Africa Market Value Share Analysis, by Packaging Type, 2023E & 2033F

Figure 91: South Africa Market Value Share Analysis, By Material Type, 2023E & 2033F

Figure 92: South Africa Market Value Share Analysis, by Product Type, 2023E & 2033F

Figure 93: Japan Market Value Share Analysis, by Packaging Type, 2023E & 2033F

Figure 94: Japan Market Value Share Analysis, By Material Type, 2023E & 2033F

Figure 95: Japan Market Value Share Analysis, by Product Type, 2023E & 2033F

Figure 96: India Market Value Share Analysis, by Packaging Type, 2023E & 2033F

Figure 97: India Market Value Share Analysis, By Material Type, 2023E & 2033F

Figure 98: India Market Value Share Analysis, by Product Type, 2023E & 2033F

Figure 98: China Market Value Share Analysis, by Packaging Type, 2023E & 2033F

Figure 99: China Market Value Share Analysis, By Material Type, 2023E & 2033F

Figure 100: China Market Value Share Analysis, by Product Type, 2023E & 2033F

Figure 101: Australia Market Value Share Analysis, by Packaging Type, 2023E & 2033F

Figure 102: Australia Market Value Share Analysis, By Material Type, 2023E & 2033F

Figure 103: Australia Market Value Share Analysis, by Product Type, 2023E & 2033F

Explore Packaging Insights

View Reports

Plant Based Meat Packaging Market