Plant Stem Cell Encapsulation Market Size and Share Forecast Outlook 2025 to 2035

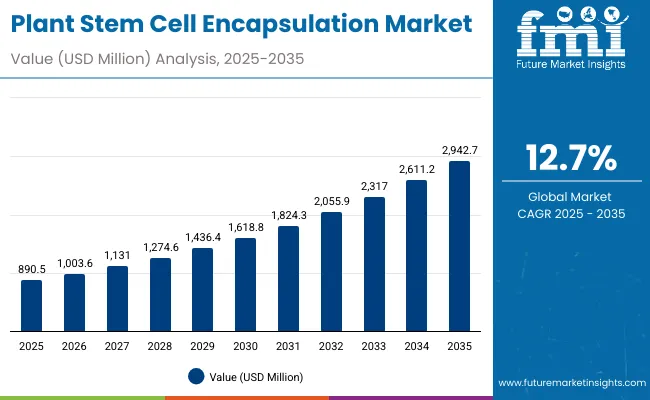
The Plant Stem Cell Encapsulation Market is expected to record a valuation of USD 890.5 million in 2025 and USD 2,942.7 million in 2035, with an increase of USD 2,052.2 million, which equals a growth of nearly 230% over the decade. The overall expansion represents a CAGR of 12.7% and more than a 3X increase in total market value.

During the first five-year period from 2025 to 2030, the market increases from USD 890.5 million to USD 1,618.8 million, adding USD 728.3 million, which accounts for 35.5% of the total decade growth. This phase records steady adoption in anti-aging and regeneration skincare, driven by demand for high-efficacy formulations based on bioactive encapsulated stem cells. Serums dominate this phase as they cater to over 50% of all applications due to their higher delivery efficiency, lightweight texture, and compatibility with microsphere and liposome technologies.

The second half from 2030 to 2035 contributes USD 1,323.9 million, equal to 64.5% of total growth, as the market jumps from USD 1,618.8 million to USD 2,942.7 million. This acceleration is powered by the widespread commercialization of nanocapsules and hydrogel-based delivery systems, combined with the rise of AI-powered formulation design and microbiome-targeted encapsulation. The proliferation of hybrid cosmetic-biotech collaborations and the expansion of luxury skincare lines in China, Japan, and India are expected to drive exponential value creation. The software-equivalent revenue stream within this industry comes from licensing proprietary encapsulation technologies and patent royalties, which together will account for a rising portion of total value by 2035.
Quick Stats for Plant Stem Cell Encapsulation Market

  • Plant Stem Cell Encapsulation Market Value (2025): USD 890.5 million
  • Plant Stem Cell Encapsulation Market Forecast Value (2035): USD 2,942.7 million
  • Plant Stem Cell Encapsulation Market Forecast CAGR: 12.7%
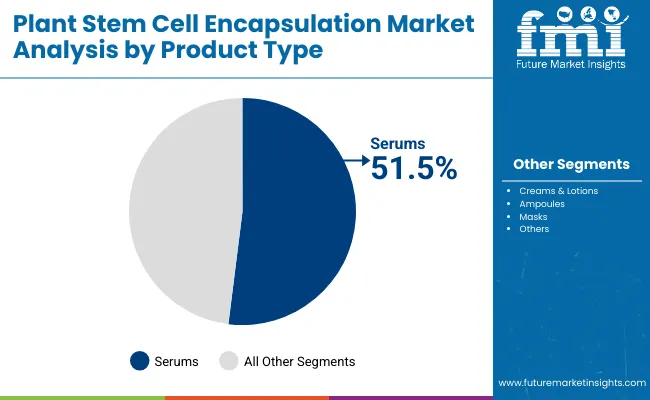
  • Plant Stem Cell Encapsulation Market Leading Segment in 2025: Serums (51.5%)
  • Plant Stem Cell Encapsulation Market Key Growth Regions: China, India, Japan, United States, Europe
  • Top Key Players: Mibelle Biochemistry, PhytoCellTec, Lancome (L’Oréal), Estée Lauder, Amorepacific, Shiseido, Clarins, Givaudan Active Beauty, KORRES, Dr. Irena Eris

Plant Stem Cell Encapsulation Market

Plant Stem Cell Encapsulation Market Key Takeaways

Metric Value
Estimated Market Value (2025E) USD 890.5 million
Forecast Market Value (2035F) USD 2,942.7 million
Forecast CAGR (2025 to 2035) 12.70%

From 2020 to 2024, the Plant Stem Cell Encapsulation Market grew from an estimated USD 620 million to USD 890.5 million, driven by strong R&D investments in encapsulation biotechnology and the commercialization of botanical actives sourced from alpine and marine plants. During this period, the competitive landscape was dominated by biotech developers and premium skincare manufacturers controlling nearly 75% of total revenue. Leaders such as Mibelle Biochemistry and Givaudan Active Beauty advanced encapsulated delivery systems that improved ingredient stability, efficacy, and sustained release. Competitive differentiation relied heavily on the ability to maintain bioactivity during storage and skin penetration, while the packaging and sensorial performance served as key differentiators in luxury and dermocosmetic segments.

Technology transfer and formulation licensing began gaining traction toward 2024, signaling a structural shift from product-based to technology-driven value creation within the market.

Demand for encapsulated plant stem cell formulations is expected to expand to USD 890.5 million in 2025, as encapsulation becomes an industry benchmark for high-performance skincare innovation. The revenue mix is rapidly evolving, with serums and ampoules leading product adoption and E-commerce channels surpassing 55% share through digital-native beauty brands.

Traditional cosmetic houses face growing competition from bio-labs and independent D2C innovators offering liposome-based delivery for anti-aging and brightening applications. Leading firms are shifting toward AI-optimized encapsulation processes and hybrid models combining plant stem cells with peptides and ceramides for amplified regenerative efficacy. The competitive advantage is increasingly shaped by proprietary biotechnology, sustainability in sourcing, and partnerships between cosmetic formulators and biotech R&D companies, rather than packaging or branding alone.

Why the Plant Stem Cell Encapsulation Market is Growing?

The Plant Stem Cell Encapsulation Market is growing due to technological convergence between biotechnology and cosmetics, which has improved the bioavailability and stability of active ingredients. Advances in microsphere and liposome encapsulation have enabled time-controlled delivery of plant-derived actives such as edelweiss, alpine rose, and apple stem cells. These encapsulated systems prevent oxidation and degradation, resulting in higher efficacy and improved consumer-perceived results in anti-aging, regeneration, and brightening functions.

In addition, nanocapsule and hydrogel technologies have elevated delivery precision by ensuring deeper skin penetration and compatibility with sensitive-skin formulations. The rise of AI-assisted encapsulation design, biodegradable carrier materials, and peptide-binding encapsulation techniques has further diversified application areas across serums, creams, and ampoules. Industries across the skincare and cosmeceutical spectrum are driving demand for encapsulated solutions that balance efficacy with clean-label and sustainable sourcing.

The expansion of personalized skincare and biotech collaboration models has further accelerated growth. E-commerce remains the most influential distribution channel, supported by digital consultations, AR-driven diagnostics, and subscription-based skincare ecosystems. Segment growth is expected to be led by anti-aging and wrinkle reduction functions, serum-based formulations, and microsphere encapsulation technologies due to their superior delivery performance and alignment with consumer trends in high-performance skincare.

Segmental Analysis

The market is segmented by Function, Product Type, Technology, Channel, and Region.

Functions include Anti-aging & wrinkle reduction, Repair & regeneration, Brightening, and Hydration, reflecting the diversity of biological benefits derived from encapsulated plant stem cells. Product types cover Serums, Creams & lotions, Ampoules, and Masks, forming the core product categories that define application and delivery format.
  • Technologies span Microsphere encapsulation, Liposome delivery, Nanocapsules, and Hydrogel carriers, which represent the evolving toolkit of biotechnology-driven formulation systems.
  • Sales channels encompass E-commerce, Pharmacies, Specialty beauty stores, and Mass retail, addressing diverse consumer access points from luxury skincare to affordable mass-market ranges.
  • Regionally, the market spans North America, Europe, East Asia, South Asia & Pacific, Latin America, and the Middle East & Africa, with China and India emerging as the fastest-growing markets globally.

Insights into the Product Type Segment with Serums Leading in Market Share

Plant Stem Cell Encapsulation Market By Product

Product Type Value Share % 2025
Serums 51.5%
Others 48.5%

The Serum segment is projected to contribute 51.5% of the Plant Stem Cell Encapsulation Market revenue in 2025, maintaining its leadership as the dominant product type. This dominance is attributed to the growing consumer preference for lightweight, fast-absorbing, and high-efficacy formulations that leverage encapsulation for improved actives delivery. Serums provide enhanced penetration and higher concentration of encapsulated actives, making them the preferred choice for anti-aging, brightening, and repair applications.

This segment’s momentum is supported by rapid innovation in dual-phase encapsulation, airless packaging, and AI-assisted ingredient calibration. Major brands are also developing multi-dose ampoule kits and smart refills, which have amplified the adoption of encapsulated serums across online retail and premium skincare platforms. As the technology matures, serums are expected to remain the cornerstone of encapsulated skincare portfolios worldwide.
Insights into the Channel Segment with E-commerce Dominating the Demand

Plant Stem Cell Encapsulation Market By Channel

Channel Value Share % 2025
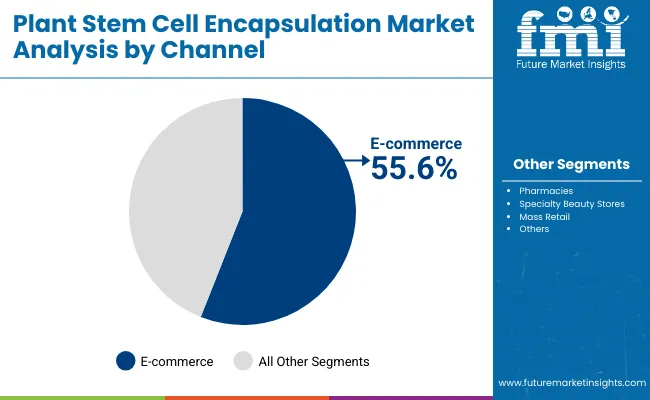
E-commerce 55.6%
Others 44.4%

The E-commerce segment is forecasted to hold 55.6% of the market share in 2025, led by strong consumer engagement through online beauty platforms and brand-owned digital stores. Online-exclusive launches, subscription skincare models, and influencer-driven marketing campaigns have elevated the digital channel to the top revenue contributor globally.

E-commerce platforms have enabled better consumer education regarding encapsulated technologies and sustainability claims, while offering dynamic personalization through quizzes and AR-based diagnostic tools. Furthermore, increasing digitalization in China, South Korea, and the USA has boosted online conversions for biotech skincare. As D2C and hybrid digital-physical retail evolve, the E-commerce channel is set to maintain its dominance throughout the decade.
Insights into the Technology Segment with Microsphere Encapsulation Leading Innovation

Plant Stem Cell Encapsulation Market By Technology

Technology Value Share % 2025
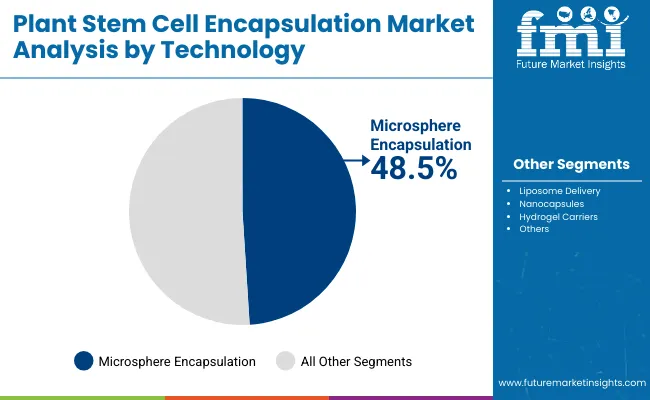
Microsphere encapsulation 48.5%
Others 51.5%

The Microsphere encapsulation technology segment is projected to account for the largest share of Plant Stem Cell Encapsulation Market revenue in 2025, establishing it as the leading encapsulation method. This technology offers controlled release, enhanced ingredient stability, and sustained bioavailability, making it ideal for high-performance skincare formulations.

Microspheres, often derived from biodegradable polymers and natural gums, protect sensitive plant actives from oxidation and UV degradation while ensuring prolonged skin contact time. Advances in biopolymer coatings, microfluidic encapsulation, and crosslinked hydrogel spheres have expanded its application across serums and creams. Given its balance between cost, efficacy, and scalability, microsphere encapsulation is expected to remain the preferred method through 2035, while liposomes and nanocapsules will continue gaining relevance in advanced anti-aging and regenerative treatments.

What are the Drivers, Restraints, and Key Trends of the Plant Stem Cell Encapsulation Market?

Drivers

Technological Synergy Between Bioencapsulation and Cosmetic Actives

One of the most powerful growth drivers in the Plant Stem Cell Encapsulation Market is the technological convergence of biotechnology and cosmetic formulation science, particularly in controlled delivery systems. The market has evolved from using basic encapsulation for stability to deploying multi-layer microsphere and nanocapsule matrices that deliver precise time-release of plant stem cell actives such as edelweiss, sea fennel, and Swiss apple extracts.

These technologies enhance efficacy by ensuring that active cells remain viable until absorption, minimizing oxidation and degradation during storage. Companies like Mibelle Biochemistry and Givaudan Active Beauty are developing next-generation encapsulation protocols that combine liposome bilayers with peptide linkers, allowing controlled diffusion through skin layers. This has significantly increased ingredient potency, driving adoption by luxury skincare brands. Furthermore, encapsulation technology has become a key differentiator in patent portfolios, fueling licensing-based revenue and long-term R&D collaboration between biotech labs and cosmetic houses globally.

Rising Demand for Sustainable and Biodegradable Encapsulation Carriers

The second major driver is the shift toward sustainable encapsulation materials in response to tightening environmental regulations and consumer scrutiny. Brands are increasingly replacing synthetic polymers and silicone shells with biodegradable polysaccharide hydrogels, alginate spheres, and plant-derived nanofibers that align with clean beauty standards.

This movement is particularly strong in Europe and Japan, where regulatory bodies such as the EU Cosmetics Regulation (EC No. 1223/2009) and Japan’s quasi-drug framework are influencing encapsulation material compliance. By 2030, over 40% of encapsulated formulations are projected to use biodegradable systems, reducing microplastic concerns while maintaining performance. Companies like Clarins and Amorepacific have pioneered plant-based encapsulation matrices, leading to both sustainability branding advantages and improved ingredient compatibility. The integration of green chemistry principles into encapsulation manufacturing is now a central value driver that is attracting both institutional investors and biotech partnerships.

Restraints

High Cost of Encapsulation Technology Scale-up and Validation

Despite its growth, the Plant Stem Cell Encapsulation Market faces a structural restraint in the high production and validation costs associated with encapsulation at scale. Developing microsphere or liposome systems involves complex emulsion processes, particle size control, and compatibility testing under ISO and cosmetic GMP conditions.

For smaller brands and contract manufacturers, the cost per kilogram of encapsulated actives can exceed conventional formulations by 200-300%. Moreover, maintaining consistency across batches requires specialized equipment such as microfluidizers, ultrasonic dispersers, and precision homogenizers, which demand significant capital investment.

The regulatory validation of encapsulated actives also remains lengthy, as proving bioavailability and sustained-release efficacy often necessitates both in-vitro diffusion studies and human skin compatibility trials. These costs limit scalability, particularly in emerging markets, where local manufacturers still rely on conventional emulsions.

Complexity of Stability and Release Control in Multi-Active Formulations

Another major restraint is the challenge of stability when encapsulating multiple actives within a single carrier system. As brands move toward "all-in-one" multifunctional skincare products, ensuring that diverse actives such as antioxidants, peptides, and stem cell extracts retain stability without premature release has become technically demanding.

Encapsulation systems must maintain structural integrity under varying temperature, pH, and viscosity conditions during both production and consumer use. The risk of cross-reactivity between encapsulated molecules can compromise efficacy and shelf life. For instance, co-encapsulating hydrophilic plant extracts with lipophilic compounds often leads to uneven diffusion rates or burst release.

These issues increase formulation time and R&D cost, while also deterring mass adoption by private-label or low-cost brands. Manufacturers must invest in predictive modeling and nanostructure simulations to optimize release kinetics capabilities not yet common across all regions.

Key Trends

Emergence of AI-Driven Formulation Design and Predictive Encapsulation Modeling

A defining trend shaping the next decade of the Plant Stem Cell Encapsulation Market is the integration of artificial intelligence and computational modeling in formulation design. Leading biotech labs and skincare conglomerates are adopting AI-based platforms to simulate encapsulation dynamics, predict stability under stress conditions, and optimize active-to-carrier ratios for improved absorption efficiency.

AI tools can analyze molecular interactions between stem cell metabolites (such as polyphenols or amino acids) and encapsulation materials to forecast shelf stability and release timing before physical trials. This has drastically reduced development timelines from 18-24 months to under 10 months for certain premium brands.

Companies like Estée Lauder and Shiseido are now building digital formulation twins to model ingredient diffusion and consumer response, enhancing personalization at scale. The AI-driven encapsulation process is also enabling faster adaptation to market trends like sensitivity-friendly skincare and microbiome-safe formulations, making it one of the most transformative technological shifts in this sector.

Asia-Pacific Becoming the Global Production and Innovation Hub

Another significant trend is the geographic pivot of encapsulated plant stem cell R&D and manufacturing toward Asia-Pacific, particularly China, Japan, and South Korea. These countries are rapidly scaling domestic biotech infrastructure to support plant tissue culture and encapsulation research.

China’s CAGR of 20.3% and India’s 22.9% clearly highlight the speed of adoption. Regional players are integrating microfluidic encapsulation lines and fermentation-based stem cell cultivation, reducing dependency on imported raw materials. The combination of local botanical biodiversity and advanced encapsulation labs has made Asia a global innovation hub.

Brands like Amorepacific and KORRES are using indigenous plant cells (ginseng, lotus, centella) encapsulated in bio-based carriers to create culturally relevant, high-performance skincare. The expansion of e-commerce and social commerce in the region also ensures faster go-to-market cycles. This shift is redefining the global competitive balance, positioning Asia-Pacific not only as a consumer market but as the epicenter of encapsulated cosmetic biotechnology innovation.
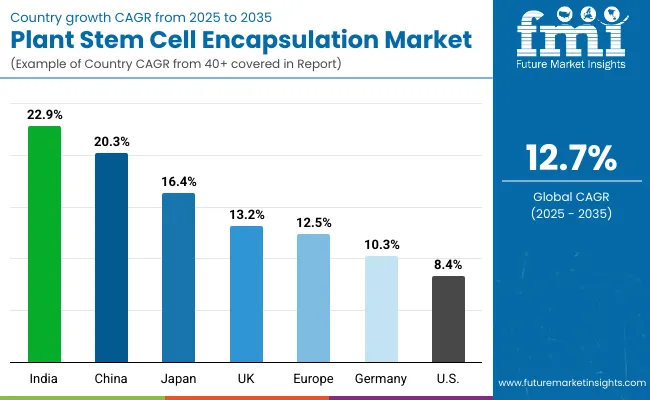
Analysis of Plant Stem Cell Encapsulation Market By Key Countries

Plant Stem Cell Encapsulation Market By Country

Countries Estimated CAGR (2025 to 2035)
China 20.3%
USA 8.4%
India 22.9%
UK 13.2%
Germany 10.3%
Japan 16.4%
Europe 12.50%

The Plant Stem Cell Encapsulation Market shows clear regional divergence in growth trajectories between mature and emerging economies. China, India, and Japan are expected to drive the majority of incremental revenue gains through 2035, recording CAGRs of 20.3%, 22.9%, and 16.4%, respectively. These Asian markets are benefitting from rapid adoption of biotech-driven skincare innovations and the growing preference for encapsulated serums and ampoules among younger consumers seeking visible, science-backed results. China’s growth is reinforced by aggressive investment in domestic cosmetic biotechnology, where local laboratories are scaling microfluidic encapsulation and fermented plant cell extraction capabilities.

India, on the other hand, is emerging as the fastest-growing market globally, supported by rising disposable income, an expanding cosmeceutical segment, and a strong trend toward vegan and herbal encapsulated formulations. Japan continues to strengthen its premium skincare ecosystem, integrating liposome delivery systems into anti-aging and hydration categories across leading domestic brands. Collectively, the Asia-Pacific region is poised to account for more than half of the global market’s new value creation over the decade, with local R&D hubs rapidly transitioning from ingredient importers to exporters of patented encapsulation technologies.

In contrast, the USA and Europe represent more mature but stable segments of the Plant Stem Cell Encapsulation Market, growing at 8.4% and 12.5%, respectively. The USA market, while slower in absolute percentage growth, remains central to premium skincare innovation due to its concentration of biotech startups, clean-beauty brands, and e-commerce-driven sales models, especially through direct-to-consumer channels. Europe, including key markets such as Germany (10.3%) and the UK (13.2%), continues to advance through regulatory leadership and strong consumer demand for biodegradable encapsulation carriers and plant-derived actives.

Germany is at the forefront of sustainable material development, while the UK is emerging as a testing ground for AI-based formulation design and adaptive encapsulation systems used in premium brands like Clarins and Estée Lauder. Together, these regions define the dual growth narrative of the market Asia’s expansion fueled by technological scaling and new consumer acquisition, and the West’s growth anchored in sustainability, regulation-driven innovation, and premiumization.
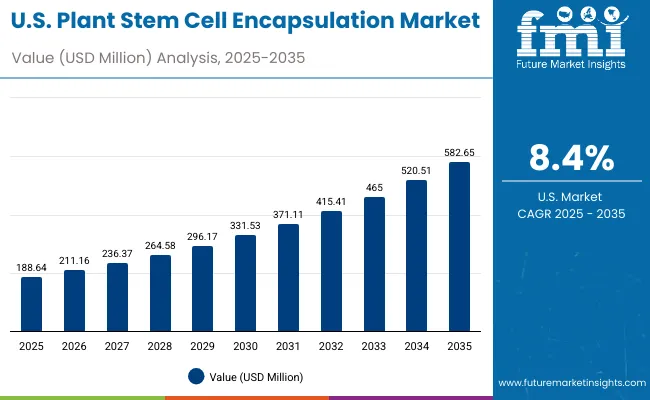
Sales Outlook for Plant Stem Cell Encapsulation in the United States

Plant Stem Cell Encapsulation Market Usa

Year USA Plant Stem Cell Encapsulation Market (USD Million)
2025 188.6
2026 211.2
2027 236.4
2028 264.6
2029 296.2
2030 331.5
2031 371.1
2032 415.4
2033 465.0
2034 520.5
2035 582.7

The Plant Stem Cell Encapsulation Market in the United States is projected to grow at a CAGR of 8.4%, driven by a strong consumer shift toward biotech-enhanced anti-aging and repair skincare products. The integration of encapsulated botanical actives in dermocosmetic formulations is expanding, particularly within premium and clinical-grade beauty ranges.

Growing awareness of cellular regeneration and sustained-release delivery systems has led to higher adoption by dermatologists and medi-spa chains. The market is also benefitting from the expansion of e-commerce and digital skincare consultations, where brands use AI-based skin analysis tools to recommend encapsulated formulations. The rise of D2C startups and clean beauty innovators is further increasing competition, leading to rapid innovation in nanocapsule-based formulations with biodegradable carriers.

  • USA dermocosmetic clinics and aesthetic spas are adopting encapsulated plant stem cell serums for post-procedure recovery and anti-aging therapy.
  • E-commerce platforms are driving visibility of encapsulated formulations through AI-based personalization.
  • Leading biotech skincare brands are introducing subscription-based delivery models integrating encapsulated actives.

Growth and Expansion Outlook for Plant Stem Cell Encapsulation Market in the United Kingdom

The Plant Stem Cell Encapsulation Market in the United Kingdom is expected to grow at a CAGR of 13.2%, supported by strong uptake across premium skincare, dermatology-led retail, and sustainable biotech segments. British consumers are increasingly gravitating toward encapsulated serums and creams formulated with ethically sourced plant actives and biodegradable encapsulation materials.

The UK has also emerged as a European R&D hub for AI-based encapsulation design and clinical validation, with academic collaboration playing a central role in innovation. Domestic brands are focusing on transparency and efficacy, launching encapsulated formulations featuring alpine rose and grape stem cell complexes to compete with continental European players. Demand is also being driven by the growth of green laboratories and incubators under public-private partnerships that emphasize sustainability and low-waste cosmetic production.

  • Premium skincare laboratories are pioneering AI-assisted encapsulation models and microfluidic scale-up.
  • Ethical beauty brands are adopting biodegradable encapsulation carriers aligned with UK sustainability standards.
  • Public-private funding is encouraging R&D for clean encapsulation materials across biotech and cosmetic startups.

Growth and Expansion Outlook for Plant Stem Cell Encapsulation Market in India

India is witnessing exceptional growth in the Plant Stem Cell Encapsulation Market, projected to expand at a CAGR of 22.9% through 2035 the highest globally. The surge is led by a growing middle-class consumer base, rising awareness of cosmeceutical-grade skincare, and increased investments in domestic cosmetic manufacturing. Local brands are incorporating plant-derived stem cells from lotus, neem, and centella asiatica within encapsulated formulations, catering to both Ayurvedic and modern skincare preferences.

Cost-effective microsphere and hydrogel technologies have enabled scalability for smaller contract manufacturers and private-label producers. Furthermore, the government’s Make-in-India initiative is encouraging biotech startups to localize encapsulation technologies that were previously imported from Europe. With higher affordability and expanding digital retail access, encapsulated serums and ampoules are becoming mainstream across tier-2 and tier-3 cities.
  • Local manufacturers are scaling hydrogel and microsphere encapsulation using indigenous plant extracts.
  • Private-label and D2C brands are entering the encapsulated skincare space through affordable online-first launches.
  • Skincare biotech clusters in Bengaluru and Pune are accelerating R&D in nanocapsule formulations and stability testing.

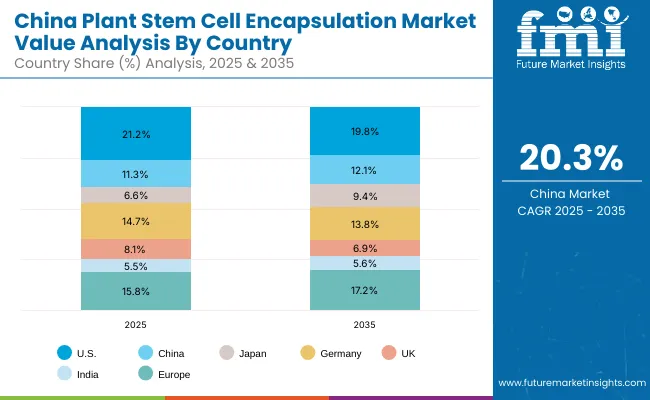
Sales Outlook for Plant Stem Cell Encapsulation in China

Plant Stem Cell Encapsulation Market China

Countries 2025 Share (%)
USA 21.2%
China 11.3%
Japan 6.6%
Germany 14.7%
UK 8.1%
India 5.5%
Europe 15.8%
Countries 2035 Share (%)
USA 19.8%
China 12.1%
Japan 9.4%
Germany 13.8%
UK 6.9%
India 5.6%
Europe 17.2%

The Plant Stem Cell Encapsulation Market in China is expected to grow at a CAGR of 20.3%, among the highest worldwide. The market’s momentum is driven by the rapid industrialization of the cosmetic biotechnology sector and an expanding ecosystem of domestic R&D laboratories. Chinese beauty and biotech companies are pioneering the use of microfluidic encapsulation, fermentation-derived plant actives, and AI-optimized liposome delivery systems for personalized skincare.

Government incentives for bio-based industries, combined with the rising popularity of sustainable and natural cosmetics, have strengthened local innovation capacity. In addition, China’s dominance in E-commerce through platforms like Tmall, Douyin, and RED has amplified brand visibility, accelerating mass consumer adoption. Affordable yet technologically sophisticated encapsulated serums are fueling growth not just in urban centers but also across lower-tier cities.
  • Local biotech firms are exporting encapsulated actives for luxury skincare production in Europe and Japan.
  • AI-based encapsulation labs are optimizing release profiles of stem cell extracts for deeper dermal efficacy.
  • Social commerce and live-streaming are boosting consumer trust and awareness of encapsulated skincare technology.

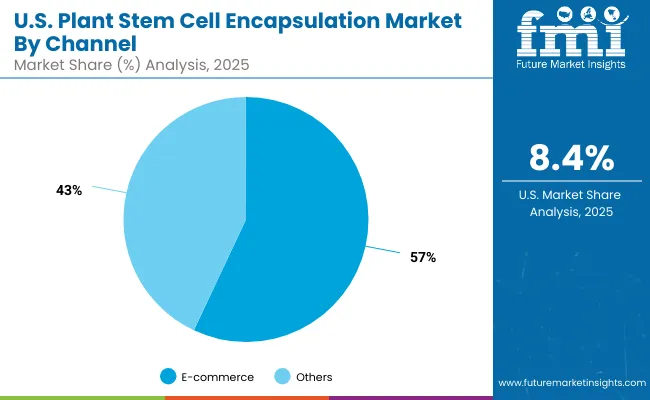
Growth Outlook for Plant Stem Cell Encapsulation Market in the United States

Plant Stem Cell Encapsulation Market Usa 2

USA Channel Value Share % 2025
E-commerce 57.3%
Others 42.7%

The Plant Stem Cell Encapsulation Market in the United States is projected at USD 188.6 million in 2025, with E-commerce accounting for 57.3% and offline channels representing 42.7%. This digital dominance reflects the country’s transition toward online personalization and subscription-led skincare ecosystems, where consumer engagement is increasingly driven by AI-powered diagnostic platforms and data-driven skincare mapping. USA consumers exhibit a strong preference for encapsulated actives that offer measurable improvements in elasticity, hydration, and cell repair, driving the success of serum-based formats integrated with nanocapsule or liposome delivery systems.

The rise of clinical skincare and medically endorsed beauty brands has been instrumental in reshaping the American market. Dermatologists and estheticians are actively integrating encapsulated stem cell serums into in-office and at-home protocols to accelerate post-procedure recovery and dermal regeneration. In addition, bio-collaboration models between skincare brands and biotech labs are expanding offering proprietary encapsulation platforms licensed for anti-aging and regeneration categories. As USA consumers continue to prioritize long-term skin health over temporary cosmetic benefits, encapsulation technologies will remain central to the country’s premium skincare evolution.
  • Market in the USA holds a 21.2% global share in 2025.
  • E-commerce leads offline sales at 57.3% vs 42.7%, driven by D2C and digital personalization.
  • Growth supported by clinical skincare integration and biotech-cosmetic collaborations.

Growth Outlook for Plant Stem Cell Encapsulation Market in China

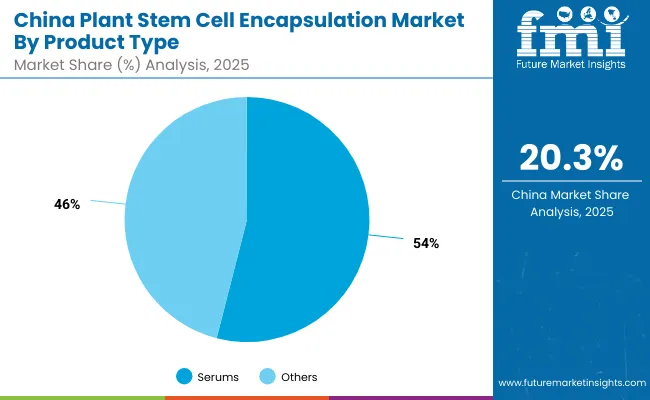
Plant Stem Cell Encapsulation Market China 2

China Product Type Value Share % 2025
Serums 53.6%
Others 46.4%

The Plant Stem Cell Encapsulation Market in China is valued at USD 100.6 million in 2025 and is expected to expand at a CAGR of 20.3%, the fastest among leading global markets. Serums dominate with 53.6% share, supported by massive consumer adoption across online beauty platforms like Tmall, JD.com, and Douyin. China’s skincare sector is rapidly transforming into a biotechnology-led ecosystem, where microfluidic encapsulation and fermentation-based plant cell extraction are enabling high-efficacy, locally developed actives. This technical capability has reduced dependency on imported materials while enhancing formulation authenticity and brand differentiation.

The market’s growth trajectory is anchored in the national focus on sustainable cosmetics, with regulatory frameworks encouraging clean encapsulation practices and biodegradable carriers. Domestic brands are launching encapsulated serums formulated with lotus, ginseng, and green tea stem cell extracts ingredients deeply tied to traditional Chinese wellness philosophy but now powered by nanotechnology. Strategic investments from tech conglomerates and biotech incubators have further strengthened domestic production capacity. By 2035, China is expected to evolve from a manufacturing hub to a global exporter of encapsulated stem cell actives, reshaping the competitive balance of the market.
  • China accounts for 11.3% global share in 2025.
  • Serums lead with 53.6% due to mass-market and luxury skincare integration.
  • Growth supported by local biotech expansion, sustainable encapsulation, and digital retail ecosystems.

Competitive Landscape of the Plant Stem Cell Encapsulation Market

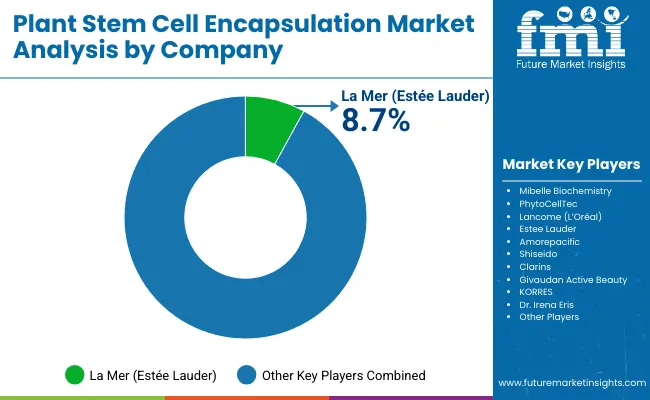
Plant Stem Cell Encapsulation Market By Company

The Plant Stem Cell Encapsulation Market is moderately fragmented, with biotechnology firms, luxury skincare conglomerates, and active ingredient suppliers competing across specialized product categories. Estée Lauder’s La Mer leads with an 8.7% value share, leveraging its pioneering use of marine and plant-based encapsulated actives in luxury skincare formulations. The brand’s success stems from integrating liposome and nanocapsule delivery systems that enhance penetration depth and bioavailability, while maintaining exclusivity through proprietary encapsulation patents.

Key ingredient manufacturers such as Mibelle Biochemistry and Givaudan Active Beauty anchor the technology-driven side of the market. Mibelle’s PhytoCellTec™ platform remains the gold standard for plant stem cell encapsulation, widely licensed by international cosmetic houses. Givaudan, meanwhile, has evolved into a full-service biotechnology provider, developing biodegradable encapsulation matrices and supporting sustainability-led product innovation. Clarins, Shiseido, and Amorepacific lead the formulation and brand innovation segments by integrating AI-driven formulation design with encapsulation for targeted anti-aging and brightening outcomes.

Mid-sized innovators such as KORRES and Dr. Irena Eris focus on localized production and cultural adaptation, using indigenous botanical actives encapsulated through hydrogel and liposomal carriers to strengthen regional consumer loyalty. These players combine clean-label marketing with clinical-grade efficacy, bridging natural and technological skincare segments. The competitive landscape is evolving from a focus on ingredient quality to a broader ecosystem competition where brand success depends on integrated partnerships among biotech suppliers, digital formulation platforms, and retail analytics ecosystems.

Competitive differentiation now centers on sustainability, skin compatibility, and long-term performance validation. Brands with capabilities in AI-based release modeling, biodegradable carrier innovation, and encapsulation patents are expected to dominate through 2035, as consumer demand increasingly favors transparent science-backed skincare solutions.

Key Developments in Plant Stem Cell Encapsulation Market

  • On August 17, 2025, Mibelle Biochemistry launched PhytoCellTec™ Exosomes, a novel active that not only delivers plant stem cell-derived exosomes into the skin but also stimulates endogenous exosome production from mesenchymal stem cells in dermal layers. The dual-mode action is marketed as enhancing skin density, elasticity, and wrinkle reduction
  • In late 2024, Mibelle also secured recognition when its PhytoCellTec™ encapsulation platform was awarded Best Breakthrough Technology at the Beauty Matters Awards for its sustainable cultivation and high yield of plant stem cell actives from rare species

Scope of the Report

Item Value
Quantitative Units USD Million
Function Anti-aging & wrinkle reduction, Repair & regeneration, Brightening, and Hydration
Product Type Serums, Creams & lotions, Ampoules, and Masks
Technology Microsphere encapsulation, Liposome delivery, Nanocapsules, and Hydrogel carriers
Channel E-commerce, Pharmacies, Specialty beauty stores, and Mass retail
Regions Covered North America, Europe, East Asia, South Asia & Pacific, Latin America, and Middle East & Africa
Country Covered United States, Canada, Germany, France, United Kingdom, China, Japan, India, Brazil, and South Africa
Key Companies Profiled Mibelle Biochemistry, PhytoCellTec, Lancome (L’Oréal), Estée Lauder, Amorepacific, Shiseido, Clarins, Givaudan Active Beauty, KORRES, and Dr. Irena Eris
Additional Attributes Dollar sales by product type and function, adoption trends in liposome and nanocapsule delivery systems, rising demand for encapsulated serums and anti-aging formulations, sector-specific growth in premium skincare and dermocosmetics, encapsulation technology advancements in controlled-release and bioavailability, software-enabled formulation modeling, integration with AI-based personalization tools, regional growth influenced by biotech collaboration and sustainable material sourcing, and innovations in microsphere and hydrogel carrier design.

Key Segments

By Function:

  • Anti-aging & wrinkle reduction
  • Repair & regeneration
  • Brightening
  • Hydration

By Product Type:

  • Serums
  • Creams & lotions
  • Ampoules
  • Masks

By Technology:

  • Microsphere encapsulation
  • Liposome delivery
  • Nanocapsules
  • Hydrogel carriers

By Channel:

  • E-commerce
  • Pharmacies
  • Specialty beauty stores
  • Mass retail

By Region:

  • North America
  • Latin America
  • Europe
  • East Asia
  • South Asia & Pacific
  • Middle East and Africa

Frequently Asked Questions

How big is the Plant Stem Cell Encapsulation Market in 2025?

The Plant Stem Cell Encapsulation Market is estimated to be valued at USD 890.5 million in 2025.

What will be the size of the Plant Stem Cell Encapsulation Market in 2035?

The market size for the Plant Stem Cell Encapsulation Market is projected to reach USD 2,942.7 million by 2035.

How much will be the Plant Stem Cell Encapsulation Market growth between 2025 and 2035?

The Plant Stem Cell Encapsulation Market is expected to grow at a 12.7% CAGR between 2025 and 2035.

What are the key product types in the Plant Stem Cell Encapsulation Market?

The key product types in the Plant Stem Cell Encapsulation Market are Serums, Creams & lotions, Ampoules, and Masks.

Which segment is expected to contribute the most significant share in the Plant Stem Cell Encapsulation Market in 2025?

In terms of product type, the Serums segment is expected to command the leading share of 51.5% in the Plant Stem Cell Encapsulation Market in 2025, driven by its superior active delivery efficiency and rising consumer demand for high-performance skincare formats.

Table of Content

  1. Executive Summary
    • Global Market Outlook
    • Demand-side Trends
    • Supply-side Trends
    • Technology Roadmap Analysis
    • Analysis and Recommendations
  2. Market Overview
    • Market Coverage / Taxonomy
    • Market Definition / Scope / Limitations
  3. Market Background
    • Market Dynamics
      • Drivers
      • Restraints
      • Opportunity
      • Trends
    • Scenario Forecast
      • Demand in Optimistic Scenario
      • Demand in Likely Scenario
      • Demand in Conservative Scenario
    • Opportunity Map Analysis
    • Product Life Cycle Analysis
    • Supply Chain Analysis
      • Supply Side Participants and their Roles
        • Producers
        • Mid-Level Participants (Traders/ Agents/ Brokers)
        • Wholesalers and Distributors
      • Value Added and Value Created at Node in the Supply Chain
      • List of Raw Material Suppliers
      • List of Existing and Potential Buyer’s
    • Investment Feasibility Matrix
    • Value Chain Analysis
      • Profit Margin Analysis
      • Wholesalers and Distributors
      • Retailers
    • PESTLE and Porter’s Analysis
    • Regulatory Landscape
      • By Key Regions
      • By Key Countries
    • Regional Parent Market Outlook
    • Production and Consumption Statistics
    • Import and Export Statistics
  4. Global Market Analysis 2020 to 2024 and Forecast, 2025 to 2035
    • Historical Market Size Value (USD Million) & Volume (Units) Analysis, 2020 to 2024
    • Current and Future Market Size Value (USD Million) & Volume (Units) Projections, 2025 to 2035
      • Y-o-Y Growth Trend Analysis
      • Absolute $ Opportunity Analysis
  5. Global Market Analysis 2020 to 2024 and Forecast 2025 to 2035, By Function
    • Introduction / Key Findings
    • Historical Market Size Value (USD Million) & Volume (Units) Analysis By Function, 2020 to 2024
    • Current and Future Market Size Value (USD Million) & Volume (Units) Analysis and Forecast By Function, 2025 to 2035
      • Anti-aging & wrinkle reduction
      • Repair & regeneration
      • Brightening
      • Hydration
    • Y-o-Y Growth Trend Analysis By Function, 2020 to 2024
    • Absolute $ Opportunity Analysis By Function, 2025 to 2035
  6. Global Market Analysis 2020 to 2024 and Forecast 2025 to 2035, By Product Type
    • Introduction / Key Findings
    • Historical Market Size Value (USD Million) & Volume (Units) Analysis By Product Type, 2020 to 2024
    • Current and Future Market Size Value (USD Million) & Volume (Units) Analysis and Forecast By Product Type, 2025 to 2035
      • Serums
      • Creams & lotions
      • Ampoules
      • Masks
    • Y-o-Y Growth Trend Analysis By Product Type, 2020 to 2024
    • Absolute $ Opportunity Analysis By Product Type, 2025 to 2035
  7. Global Market Analysis 2020 to 2024 and Forecast 2025 to 2035, By Technology
    • Introduction / Key Findings
    • Historical Market Size Value (USD Million) & Volume (Units) Analysis By Technology, 2020 to 2024
    • Current and Future Market Size Value (USD Million) & Volume (Units) Analysis and Forecast By Technology, 2025 to 2035
      • Microsphere encapsulation
      • Liposome delivery
      • Nanocapsules
      • Hydrogel carriers
    • Y-o-Y Growth Trend Analysis By Technology, 2020 to 2024
    • Absolute $ Opportunity Analysis By Technology, 2025 to 2035
  8. Global Market Analysis 2020 to 2024 and Forecast 2025 to 2035, By Channel
    • Introduction / Key Findings
    • Historical Market Size Value (USD Million) & Volume (Units) Analysis By Channel, 2020 to 2024
    • Current and Future Market Size Value (USD Million) & Volume (Units) Analysis and Forecast By Channel, 2025 to 2035
      • E-commerce
      • Pharmacies
      • Specialty beauty stores
      • Mass retail
    • Y-o-Y Growth Trend Analysis By Channel, 2020 to 2024
    • Absolute $ Opportunity Analysis By Channel, 2025 to 2035
  9. Global Market Analysis 2020 to 2024 and Forecast 2025 to 2035, By Region
    • Introduction
    • Historical Market Size Value (USD Million) & Volume (Units) Analysis By Region, 2020 to 2024
    • Current Market Size Value (USD Million) & Volume (Units) Analysis and Forecast By Region, 2025 to 2035
      • North America
      • Latin America
      • Europe
      • East Asia
      • South Asia & Pacific
      • Middle East and Africa
    • Market Attractiveness Analysis By Region
  10. North America Market Analysis 2020 to 2024 and Forecast 2025 to 2035, By Country
    • Historical Market Size Value (USD Million) & Volume (Units) Trend Analysis By Market Taxonomy, 2020 to 2024
    • Market Size Value (USD Million) & Volume (Units) Forecast By Market Taxonomy, 2025 to 2035
      • By Country
        • USA
        • Canada
      • By Function
      • By Product Type
      • By Technology
      • By Channel
    • Market Attractiveness Analysis
      • By Country
      • By Function
      • By Product Type
      • By Technology
      • By Channel
    • Key Takeaways
  11. Latin America Market Analysis 2020 to 2024 and Forecast 2025 to 2035, By Country
    • Historical Market Size Value (USD Million) & Volume (Units) Trend Analysis By Market Taxonomy, 2020 to 2024
    • Market Size Value (USD Million) & Volume (Units) Forecast By Market Taxonomy, 2025 to 2035
      • By Country
        • Brazil
        • Mexico
        • Colombia
        • Rest of Latin America
      • By Function
      • By Product Type
      • By Technology
      • By Channel
    • Market Attractiveness Analysis
      • By Country
      • By Function
      • By Product Type
      • By Technology
      • By Channel
    • Key Takeaways
  12. Europe Market Analysis 2020 to 2024 and Forecast 2025 to 2035, By Country
    • Historical Market Size Value (USD Million) & Volume (Units) Trend Analysis By Market Taxonomy, 2020 to 2024
    • Market Size Value (USD Million) & Volume (Units) Forecast By Market Taxonomy, 2025 to 2035
      • By Country
        • Germany
        • UK
        • France
        • Italy
        • Spain
        • Belgium
        • Netherlands
        • Nordic
        • Switzerland
        • Russia
        • Poland
        • Rest of Europe
      • By Function
      • By Product Type
      • By Technology
      • By Channel
    • Market Attractiveness Analysis
      • By Country
      • By Function
      • By Product Type
      • By Technology
      • By Channel
    • Key Takeaways
  13. East Asia Market Analysis 2020 to 2024 and Forecast 2025 to 2035, By Country
    • Historical Market Size Value (USD Million) & Volume (Units) Trend Analysis By Market Taxonomy, 2020 to 2024
    • Market Size Value (USD Million) & Volume (Units) Forecast By Market Taxonomy, 2025 to 2035
      • By Country
        • China
        • Japan
        • South Korea
      • By Function
      • By Product Type
      • By Technology
      • By Channel
    • Market Attractiveness Analysis
      • By Country
      • By Function
      • By Product Type
      • By Technology
      • By Channel
    • Key Takeaways
  14. South Asia & Pacific Market Analysis 2020 to 2024 and Forecast 2025 to 2035, By Country
    • Historical Market Size Value (USD Million) & Volume (Units) Trend Analysis By Market Taxonomy, 2020 to 2024
    • Market Size Value (USD Million) & Volume (Units) Forecast By Market Taxonomy, 2025 to 2035
      • By Country
        • India
        • Thailand
        • Malaysia
        • Indonesia
        • Singapore
        • Vietnam
        • Australia
        • New Zealand
        • Rest of South Asia
      • By Function
      • By Product Type
      • By Technology
      • By Channel
    • Market Attractiveness Analysis
      • By Country
      • By Function
      • By Product Type
      • By Technology
      • By Channel
    • Key Takeaways
  15. Middle East and Africa Market Analysis 2020 to 2024 and Forecast 2025 to 2035, By Country
    • Historical Market Size Value (USD Million) & Volume (Units) Trend Analysis By Market Taxonomy, 2020 to 2024
    • Market Size Value (USD Million) & Volume (Units) Forecast By Market Taxonomy, 2025 to 2035
      • By Country
        • Turkey
        • UAE
        • Saudi Arabia
        • Israel
        • Other GCC Countries
        • North Africa
        • South Africa
      • By Function
      • By Product Type
      • By Technology
      • By Channel
    • Market Attractiveness Analysis
      • By Country
      • By Function
      • By Product Type
      • By Technology
      • By Channel
    • Key Takeaways
  16. Key Countries Market Analysis
    • USA
      • Pricing Analysis
      • Market Share Analysis, 2024
        • By Function
        • By Product Type
        • By Technology
        • By Channel
    • Canada
      • Pricing Analysis
      • Market Share Analysis, 2024
        • By Function
        • By Product Type
        • By Technology
        • By Channel
    • Brazil
      • Pricing Analysis
      • Market Share Analysis, 2024
        • By Function
        • By Product Type
        • By Technology
        • By Channel
    • Mexico
      • Pricing Analysis
      • Market Share Analysis, 2024
        • By Function
        • By Product Type
        • By Technology
        • By Channel
    • Colombia
      • Pricing Analysis
      • Market Share Analysis, 2024
        • By Function
        • By Product Type
        • By Technology
        • By Channel
    • Germany
      • Pricing Analysis
      • Market Share Analysis, 2024
        • By Function
        • By Product Type
        • By Technology
        • By Channel
    • UK
      • Pricing Analysis
      • Market Share Analysis, 2024
        • By Function
        • By Product Type
        • By Technology
        • By Channel
    • France
      • Pricing Analysis
      • Market Share Analysis, 2024
        • By Function
        • By Product Type
        • By Technology
        • By Channel
    • Italy
      • Pricing Analysis
      • Market Share Analysis, 2024
        • By Function
        • By Product Type
        • By Technology
        • By Channel
    • Spain
      • Pricing Analysis
      • Market Share Analysis, 2024
        • By Function
        • By Product Type
        • By Technology
        • By Channel
    • Belgium
      • Pricing Analysis
      • Market Share Analysis, 2024
        • By Function
        • By Product Type
        • By Technology
        • By Channel
    • Netherlands
      • Pricing Analysis
      • Market Share Analysis, 2024
        • By Function
        • By Product Type
        • By Technology
        • By Channel
    • Nordic
      • Pricing Analysis
      • Market Share Analysis, 2024
        • By Function
        • By Product Type
        • By Technology
        • By Channel
    • Switzerland
      • Pricing Analysis
      • Market Share Analysis, 2024
        • By Function
        • By Product Type
        • By Technology
        • By Channel
    • Russia
      • Pricing Analysis
      • Market Share Analysis, 2024
        • By Function
        • By Product Type
        • By Technology
        • By Channel
    • Poland
      • Pricing Analysis
      • Market Share Analysis, 2024
        • By Function
        • By Product Type
        • By Technology
        • By Channel
    • China
      • Pricing Analysis
      • Market Share Analysis, 2024
        • By Function
        • By Product Type
        • By Technology
        • By Channel
    • Japan
      • Pricing Analysis
      • Market Share Analysis, 2024
        • By Function
        • By Product Type
        • By Technology
        • By Channel
    • South Korea
      • Pricing Analysis
      • Market Share Analysis, 2024
        • By Function
        • By Product Type
        • By Technology
        • By Channel
    • India
      • Pricing Analysis
      • Market Share Analysis, 2024
        • By Function
        • By Product Type
        • By Technology
        • By Channel
    • Thailand
      • Pricing Analysis
      • Market Share Analysis, 2024
        • By Function
        • By Product Type
        • By Technology
        • By Channel
    • Indonesia
      • Pricing Analysis
      • Market Share Analysis, 2024
        • By Function
        • By Product Type
        • By Technology
        • By Channel
    • Australia
      • Pricing Analysis
      • Market Share Analysis, 2024
        • By Function
        • By Product Type
        • By Technology
        • By Channel
    • New Zealand
      • Pricing Analysis
      • Market Share Analysis, 2024
        • By Function
        • By Product Type
        • By Technology
        • By Channel
    • Turkey
      • Pricing Analysis
      • Market Share Analysis, 2024
        • By Function
        • By Product Type
        • By Technology
        • By Channel
    • UAE
      • Pricing Analysis
      • Market Share Analysis, 2024
        • By Function
        • By Product Type
        • By Technology
        • By Channel
    • Saudi Arabia
      • Pricing Analysis
      • Market Share Analysis, 2024
        • By Function
        • By Product Type
        • By Technology
        • By Channel
    • Israel
      • Pricing Analysis
      • Market Share Analysis, 2024
        • By Function
        • By Product Type
        • By Technology
        • By Channel
    • North Africa
      • Pricing Analysis
      • Market Share Analysis, 2024
        • By Function
        • By Product Type
        • By Technology
        • By Channel
    • South Africa
      • Pricing Analysis
      • Market Share Analysis, 2024
        • By Function
        • By Product Type
        • By Technology
        • By Channel
  17. Market Structure Analysis
    • Competition Dashboard
    • Competition Benchmarking
    • Market Share Analysis of Top Players
      • By Regional
      • By Function
      • By Product Type
      • By Technology
      • By Channel
  18. Competition Analysis
    • Competition Deep Dive
      • Mibelle Biochemistry
        • Overview
        • Product Portfolio
        • Profitability by Market Segments (Product/Age /Sales Channel/Region)
        • Sales Footprint
        • Strategy Overview
          • Marketing Strategy
          • Product Strategy
          • Channel Strategy
      • PhytoCellTec
        • Overview
        • Product Portfolio
        • Profitability by Market Segments (Product/Age /Sales Channel/Region)
        • Sales Footprint
        • Strategy Overview
          • Marketing Strategy
          • Product Strategy
          • Channel Strategy
      • Lancome (L’Oréal)
        • Overview
        • Product Portfolio
        • Profitability by Market Segments (Product/Age /Sales Channel/Region)
        • Sales Footprint
        • Strategy Overview
          • Marketing Strategy
          • Product Strategy
          • Channel Strategy
      • Estee Lauder
        • Overview
        • Product Portfolio
        • Profitability by Market Segments (Product/Age /Sales Channel/Region)
        • Sales Footprint
        • Strategy Overview
          • Marketing Strategy
          • Product Strategy
          • Channel Strategy
      • Amorepacific
        • Overview
        • Product Portfolio
        • Profitability by Market Segments (Product/Age /Sales Channel/Region)
        • Sales Footprint
        • Strategy Overview
          • Marketing Strategy
          • Product Strategy
          • Channel Strategy
      • Shiseido
        • Overview
        • Product Portfolio
        • Profitability by Market Segments (Product/Age /Sales Channel/Region)
        • Sales Footprint
        • Strategy Overview
          • Marketing Strategy
          • Product Strategy
          • Channel Strategy
      • Clarins
        • Overview
        • Product Portfolio
        • Profitability by Market Segments (Product/Age /Sales Channel/Region)
        • Sales Footprint
        • Strategy Overview
          • Marketing Strategy
          • Product Strategy
          • Channel Strategy
      • Givaudan Active Beauty
        • Overview
        • Product Portfolio
        • Profitability by Market Segments (Product/Age /Sales Channel/Region)
        • Sales Footprint
        • Strategy Overview
          • Marketing Strategy
          • Product Strategy
          • Channel Strategy
      • KORRES
        • Overview
        • Product Portfolio
        • Profitability by Market Segments (Product/Age /Sales Channel/Region)
        • Sales Footprint
        • Strategy Overview
          • Marketing Strategy
          • Product Strategy
          • Channel Strategy
      • Dr. Irena Eris
        • Overview
        • Product Portfolio
        • Profitability by Market Segments (Product/Age /Sales Channel/Region)
        • Sales Footprint
        • Strategy Overview
          • Marketing Strategy
          • Product Strategy
          • Channel Strategy
  19. Assumptions & Acronyms Used
  20. Research Methodology

List of Tables

  • Table 1: Global Market Value (USD Million) Forecast by Region, 2020-2035
  • Table 2: Global Market Volume (Units) Forecast by Region, 2020-2035
  • Table 3: Global Market Value (USD Million) Forecast by Function, 2020-2035
  • Table 4: Global Market Volume (Units) Forecast by Function, 2020-2035
  • Table 5: Global Market Value (USD Million) Forecast by Product Type, 2020-2035
  • Table 6: Global Market Volume (Units) Forecast by Product Type, 2020-2035
  • Table 7: Global Market Value (USD Million) Forecast by Technology, 2020-2035
  • Table 8: Global Market Volume (Units) Forecast by Technology, 2020-2035
  • Table 9: Global Market Value (USD Million) Forecast by Channel, 2020-2035
  • Table 10: Global Market Volume (Units) Forecast by Channel, 2020-2035
  • Table 11: North America Market Value (USD Million) Forecast by Country, 2020-2035
  • Table 12: North America Market Volume (Units) Forecast by Country, 2020-2035
  • Table 13: North America Market Value (USD Million) Forecast by Function, 2020-2035
  • Table 14: North America Market Volume (Units) Forecast by Function, 2020-2035
  • Table 15: North America Market Value (USD Million) Forecast by Product Type, 2020-2035
  • Table 16: North America Market Volume (Units) Forecast by Product Type, 2020-2035
  • Table 17: North America Market Value (USD Million) Forecast by Technology, 2020-2035
  • Table 18: North America Market Volume (Units) Forecast by Technology, 2020-2035
  • Table 19: North America Market Value (USD Million) Forecast by Channel, 2020-2035
  • Table 20: North America Market Volume (Units) Forecast by Channel, 2020-2035
  • Table 21: Latin America Market Value (USD Million) Forecast by Country, 2020-2035
  • Table 22: Latin America Market Volume (Units) Forecast by Country, 2020-2035
  • Table 23: Latin America Market Value (USD Million) Forecast by Function, 2020-2035
  • Table 24: Latin America Market Volume (Units) Forecast by Function, 2020-2035
  • Table 25: Latin America Market Value (USD Million) Forecast by Product Type, 2020-2035
  • Table 26: Latin America Market Volume (Units) Forecast by Product Type, 2020-2035
  • Table 27: Latin America Market Value (USD Million) Forecast by Technology, 2020-2035
  • Table 28: Latin America Market Volume (Units) Forecast by Technology, 2020-2035
  • Table 29: Latin America Market Value (USD Million) Forecast by Channel, 2020-2035
  • Table 30: Latin America Market Volume (Units) Forecast by Channel, 2020-2035
  • Table 31: Europe Market Value (USD Million) Forecast by Country, 2020-2035
  • Table 32: Europe Market Volume (Units) Forecast by Country, 2020-2035
  • Table 33: Europe Market Value (USD Million) Forecast by Function, 2020-2035
  • Table 34: Europe Market Volume (Units) Forecast by Function, 2020-2035
  • Table 35: Europe Market Value (USD Million) Forecast by Product Type, 2020-2035
  • Table 36: Europe Market Volume (Units) Forecast by Product Type, 2020-2035
  • Table 37: Europe Market Value (USD Million) Forecast by Technology, 2020-2035
  • Table 38: Europe Market Volume (Units) Forecast by Technology, 2020-2035
  • Table 39: Europe Market Value (USD Million) Forecast by Channel, 2020-2035
  • Table 40: Europe Market Volume (Units) Forecast by Channel, 2020-2035
  • Table 41: East Asia Market Value (USD Million) Forecast by Country, 2020-2035
  • Table 42: East Asia Market Volume (Units) Forecast by Country, 2020-2035
  • Table 43: East Asia Market Value (USD Million) Forecast by Function, 2020-2035
  • Table 44: East Asia Market Volume (Units) Forecast by Function, 2020-2035
  • Table 45: East Asia Market Value (USD Million) Forecast by Product Type, 2020-2035
  • Table 46: East Asia Market Volume (Units) Forecast by Product Type, 2020-2035
  • Table 47: East Asia Market Value (USD Million) Forecast by Technology, 2020-2035
  • Table 48: East Asia Market Volume (Units) Forecast by Technology, 2020-2035
  • Table 49: East Asia Market Value (USD Million) Forecast by Channel, 2020-2035
  • Table 50: East Asia Market Volume (Units) Forecast by Channel, 2020-2035
  • Table 51: South Asia & Pacific Market Value (USD Million) Forecast by Country, 2020-2035
  • Table 52: South Asia & Pacific Market Volume (Units) Forecast by Country, 2020-2035
  • Table 53: South Asia & Pacific Market Value (USD Million) Forecast by Function, 2020-2035
  • Table 54: South Asia & Pacific Market Volume (Units) Forecast by Function, 2020-2035
  • Table 55: South Asia & Pacific Market Value (USD Million) Forecast by Product Type, 2020-2035
  • Table 56: South Asia & Pacific Market Volume (Units) Forecast by Product Type, 2020-2035
  • Table 57: South Asia & Pacific Market Value (USD Million) Forecast by Technology, 2020-2035
  • Table 58: South Asia & Pacific Market Volume (Units) Forecast by Technology, 2020-2035
  • Table 59: South Asia & Pacific Market Value (USD Million) Forecast by Channel, 2020-2035
  • Table 60: South Asia & Pacific Market Volume (Units) Forecast by Channel, 2020-2035
  • Table 61: Middle East and Africa Market Value (USD Million) Forecast by Country, 2020-2035
  • Table 62: Middle East and Africa Market Volume (Units) Forecast by Country, 2020-2035
  • Table 63: Middle East and Africa Market Value (USD Million) Forecast by Function, 2020-2035
  • Table 64: Middle East and Africa Market Volume (Units) Forecast by Function, 2020-2035
  • Table 65: Middle East and Africa Market Value (USD Million) Forecast by Product Type, 2020-2035
  • Table 66: Middle East and Africa Market Volume (Units) Forecast by Product Type, 2020-2035
  • Table 67: Middle East and Africa Market Value (USD Million) Forecast by Technology, 2020-2035
  • Table 68: Middle East and Africa Market Volume (Units) Forecast by Technology, 2020-2035
  • Table 69: Middle East and Africa Market Value (USD Million) Forecast by Channel, 2020-2035
  • Table 70: Middle East and Africa Market Volume (Units) Forecast by Channel, 2020-2035

List of Figures

  • Figure 1: Global Market Value (USD Million) by Function, 2025-2035
  • Figure 2: Global Market Value (USD Million) by Product Type, 2025-2035
  • Figure 3: Global Market Value (USD Million) by Technology, 2025-2035
  • Figure 4: Global Market Value (USD Million) by Channel, 2025-2035
  • Figure 5: Global Market Value (USD Million) by Region, 2025-2035
  • Figure 6: Global Market Value (USD Million) Analysis by Region, 2020-2035
  • Figure 7: Global Market Volume (Units) Analysis by Region, 2020-2035
  • Figure 8: Global Market Value Share (%) and BPS Analysis by Region, 2025-2035
  • Figure 9: Global Market Y-o-Y Growth (%) Projections by Region, 2025-2035
  • Figure 10: Global Market Value (USD Million) Analysis by Function, 2020-2035
  • Figure 11: Global Market Volume (Units) Analysis by Function, 2020-2035
  • Figure 12: Global Market Value Share (%) and BPS Analysis by Function, 2025-2035
  • Figure 13: Global Market Y-o-Y Growth (%) Projections by Function, 2025-2035
  • Figure 14: Global Market Value (USD Million) Analysis by Product Type, 2020-2035
  • Figure 15: Global Market Volume (Units) Analysis by Product Type, 2020-2035
  • Figure 16: Global Market Value Share (%) and BPS Analysis by Product Type, 2025-2035
  • Figure 17: Global Market Y-o-Y Growth (%) Projections by Product Type, 2025-2035
  • Figure 18: Global Market Value (USD Million) Analysis by Technology, 2020-2035
  • Figure 19: Global Market Volume (Units) Analysis by Technology, 2020-2035
  • Figure 20: Global Market Value Share (%) and BPS Analysis by Technology, 2025-2035
  • Figure 21: Global Market Y-o-Y Growth (%) Projections by Technology, 2025-2035
  • Figure 22: Global Market Value (USD Million) Analysis by Channel, 2020-2035
  • Figure 23: Global Market Volume (Units) Analysis by Channel, 2020-2035
  • Figure 24: Global Market Value Share (%) and BPS Analysis by Channel, 2025-2035
  • Figure 25: Global Market Y-o-Y Growth (%) Projections by Channel, 2025-2035
  • Figure 26: Global Market Attractiveness by Function, 2025-2035
  • Figure 27: Global Market Attractiveness by Product Type, 2025-2035
  • Figure 28: Global Market Attractiveness by Technology, 2025-2035
  • Figure 29: Global Market Attractiveness by Channel, 2025-2035
  • Figure 30: Global Market Attractiveness by Region, 2025-2035
  • Figure 31: North America Market Value (USD Million) by Function, 2025-2035
  • Figure 32: North America Market Value (USD Million) by Product Type, 2025-2035
  • Figure 33: North America Market Value (USD Million) by Technology, 2025-2035
  • Figure 34: North America Market Value (USD Million) by Channel, 2025-2035
  • Figure 35: North America Market Value (USD Million) by Country, 2025-2035
  • Figure 36: North America Market Value (USD Million) Analysis by Country, 2020-2035
  • Figure 37: North America Market Volume (Units) Analysis by Country, 2020-2035
  • Figure 38: North America Market Value Share (%) and BPS Analysis by Country, 2025-2035
  • Figure 39: North America Market Y-o-Y Growth (%) Projections by Country, 2025-2035
  • Figure 40: North America Market Value (USD Million) Analysis by Function, 2020-2035
  • Figure 41: North America Market Volume (Units) Analysis by Function, 2020-2035
  • Figure 42: North America Market Value Share (%) and BPS Analysis by Function, 2025-2035
  • Figure 43: North America Market Y-o-Y Growth (%) Projections by Function, 2025-2035
  • Figure 44: North America Market Value (USD Million) Analysis by Product Type, 2020-2035
  • Figure 45: North America Market Volume (Units) Analysis by Product Type, 2020-2035
  • Figure 46: North America Market Value Share (%) and BPS Analysis by Product Type, 2025-2035
  • Figure 47: North America Market Y-o-Y Growth (%) Projections by Product Type, 2025-2035
  • Figure 48: North America Market Value (USD Million) Analysis by Technology, 2020-2035
  • Figure 49: North America Market Volume (Units) Analysis by Technology, 2020-2035
  • Figure 50: North America Market Value Share (%) and BPS Analysis by Technology, 2025-2035
  • Figure 51: North America Market Y-o-Y Growth (%) Projections by Technology, 2025-2035
  • Figure 52: North America Market Value (USD Million) Analysis by Channel, 2020-2035
  • Figure 53: North America Market Volume (Units) Analysis by Channel, 2020-2035
  • Figure 54: North America Market Value Share (%) and BPS Analysis by Channel, 2025-2035
  • Figure 55: North America Market Y-o-Y Growth (%) Projections by Channel, 2025-2035
  • Figure 56: North America Market Attractiveness by Function, 2025-2035
  • Figure 57: North America Market Attractiveness by Product Type, 2025-2035
  • Figure 58: North America Market Attractiveness by Technology, 2025-2035
  • Figure 59: North America Market Attractiveness by Channel, 2025-2035
  • Figure 60: North America Market Attractiveness by Country, 2025-2035
  • Figure 61: Latin America Market Value (USD Million) by Function, 2025-2035
  • Figure 62: Latin America Market Value (USD Million) by Product Type, 2025-2035
  • Figure 63: Latin America Market Value (USD Million) by Technology, 2025-2035
  • Figure 64: Latin America Market Value (USD Million) by Channel, 2025-2035
  • Figure 65: Latin America Market Value (USD Million) by Country, 2025-2035
  • Figure 66: Latin America Market Value (USD Million) Analysis by Country, 2020-2035
  • Figure 67: Latin America Market Volume (Units) Analysis by Country, 2020-2035
  • Figure 68: Latin America Market Value Share (%) and BPS Analysis by Country, 2025-2035
  • Figure 69: Latin America Market Y-o-Y Growth (%) Projections by Country, 2025-2035
  • Figure 70: Latin America Market Value (USD Million) Analysis by Function, 2020-2035
  • Figure 71: Latin America Market Volume (Units) Analysis by Function, 2020-2035
  • Figure 72: Latin America Market Value Share (%) and BPS Analysis by Function, 2025-2035
  • Figure 73: Latin America Market Y-o-Y Growth (%) Projections by Function, 2025-2035
  • Figure 74: Latin America Market Value (USD Million) Analysis by Product Type, 2020-2035
  • Figure 75: Latin America Market Volume (Units) Analysis by Product Type, 2020-2035
  • Figure 76: Latin America Market Value Share (%) and BPS Analysis by Product Type, 2025-2035
  • Figure 77: Latin America Market Y-o-Y Growth (%) Projections by Product Type, 2025-2035
  • Figure 78: Latin America Market Value (USD Million) Analysis by Technology, 2020-2035
  • Figure 79: Latin America Market Volume (Units) Analysis by Technology, 2020-2035
  • Figure 80: Latin America Market Value Share (%) and BPS Analysis by Technology, 2025-2035
  • Figure 81: Latin America Market Y-o-Y Growth (%) Projections by Technology, 2025-2035
  • Figure 82: Latin America Market Value (USD Million) Analysis by Channel, 2020-2035
  • Figure 83: Latin America Market Volume (Units) Analysis by Channel, 2020-2035
  • Figure 84: Latin America Market Value Share (%) and BPS Analysis by Channel, 2025-2035
  • Figure 85: Latin America Market Y-o-Y Growth (%) Projections by Channel, 2025-2035
  • Figure 86: Latin America Market Attractiveness by Function, 2025-2035
  • Figure 87: Latin America Market Attractiveness by Product Type, 2025-2035
  • Figure 88: Latin America Market Attractiveness by Technology, 2025-2035
  • Figure 89: Latin America Market Attractiveness by Channel, 2025-2035
  • Figure 90: Latin America Market Attractiveness by Country, 2025-2035
  • Figure 91: Europe Market Value (USD Million) by Function, 2025-2035
  • Figure 92: Europe Market Value (USD Million) by Product Type, 2025-2035
  • Figure 93: Europe Market Value (USD Million) by Technology, 2025-2035
  • Figure 94: Europe Market Value (USD Million) by Channel, 2025-2035
  • Figure 95: Europe Market Value (USD Million) by Country, 2025-2035
  • Figure 96: Europe Market Value (USD Million) Analysis by Country, 2020-2035
  • Figure 97: Europe Market Volume (Units) Analysis by Country, 2020-2035
  • Figure 98: Europe Market Value Share (%) and BPS Analysis by Country, 2025-2035
  • Figure 99: Europe Market Y-o-Y Growth (%) Projections by Country, 2025-2035
  • Figure 100: Europe Market Value (USD Million) Analysis by Function, 2020-2035
  • Figure 101: Europe Market Volume (Units) Analysis by Function, 2020-2035
  • Figure 102: Europe Market Value Share (%) and BPS Analysis by Function, 2025-2035
  • Figure 103: Europe Market Y-o-Y Growth (%) Projections by Function, 2025-2035
  • Figure 104: Europe Market Value (USD Million) Analysis by Product Type, 2020-2035
  • Figure 105: Europe Market Volume (Units) Analysis by Product Type, 2020-2035
  • Figure 106: Europe Market Value Share (%) and BPS Analysis by Product Type, 2025-2035
  • Figure 107: Europe Market Y-o-Y Growth (%) Projections by Product Type, 2025-2035
  • Figure 108: Europe Market Value (USD Million) Analysis by Technology, 2020-2035
  • Figure 109: Europe Market Volume (Units) Analysis by Technology, 2020-2035
  • Figure 110: Europe Market Value Share (%) and BPS Analysis by Technology, 2025-2035
  • Figure 111: Europe Market Y-o-Y Growth (%) Projections by Technology, 2025-2035
  • Figure 112: Europe Market Value (USD Million) Analysis by Channel, 2020-2035
  • Figure 113: Europe Market Volume (Units) Analysis by Channel, 2020-2035
  • Figure 114: Europe Market Value Share (%) and BPS Analysis by Channel, 2025-2035
  • Figure 115: Europe Market Y-o-Y Growth (%) Projections by Channel, 2025-2035
  • Figure 116: Europe Market Attractiveness by Function, 2025-2035
  • Figure 117: Europe Market Attractiveness by Product Type, 2025-2035
  • Figure 118: Europe Market Attractiveness by Technology, 2025-2035
  • Figure 119: Europe Market Attractiveness by Channel, 2025-2035
  • Figure 120: Europe Market Attractiveness by Country, 2025-2035
  • Figure 121: East Asia Market Value (USD Million) by Function, 2025-2035
  • Figure 122: East Asia Market Value (USD Million) by Product Type, 2025-2035
  • Figure 123: East Asia Market Value (USD Million) by Technology, 2025-2035
  • Figure 124: East Asia Market Value (USD Million) by Channel, 2025-2035
  • Figure 125: East Asia Market Value (USD Million) by Country, 2025-2035
  • Figure 126: East Asia Market Value (USD Million) Analysis by Country, 2020-2035
  • Figure 127: East Asia Market Volume (Units) Analysis by Country, 2020-2035
  • Figure 128: East Asia Market Value Share (%) and BPS Analysis by Country, 2025-2035
  • Figure 129: East Asia Market Y-o-Y Growth (%) Projections by Country, 2025-2035
  • Figure 130: East Asia Market Value (USD Million) Analysis by Function, 2020-2035
  • Figure 131: East Asia Market Volume (Units) Analysis by Function, 2020-2035
  • Figure 132: East Asia Market Value Share (%) and BPS Analysis by Function, 2025-2035
  • Figure 133: East Asia Market Y-o-Y Growth (%) Projections by Function, 2025-2035
  • Figure 134: East Asia Market Value (USD Million) Analysis by Product Type, 2020-2035
  • Figure 135: East Asia Market Volume (Units) Analysis by Product Type, 2020-2035
  • Figure 136: East Asia Market Value Share (%) and BPS Analysis by Product Type, 2025-2035
  • Figure 137: East Asia Market Y-o-Y Growth (%) Projections by Product Type, 2025-2035
  • Figure 138: East Asia Market Value (USD Million) Analysis by Technology, 2020-2035
  • Figure 139: East Asia Market Volume (Units) Analysis by Technology, 2020-2035
  • Figure 140: East Asia Market Value Share (%) and BPS Analysis by Technology, 2025-2035
  • Figure 141: East Asia Market Y-o-Y Growth (%) Projections by Technology, 2025-2035
  • Figure 142: East Asia Market Value (USD Million) Analysis by Channel, 2020-2035
  • Figure 143: East Asia Market Volume (Units) Analysis by Channel, 2020-2035
  • Figure 144: East Asia Market Value Share (%) and BPS Analysis by Channel, 2025-2035
  • Figure 145: East Asia Market Y-o-Y Growth (%) Projections by Channel, 2025-2035
  • Figure 146: East Asia Market Attractiveness by Function, 2025-2035
  • Figure 147: East Asia Market Attractiveness by Product Type, 2025-2035
  • Figure 148: East Asia Market Attractiveness by Technology, 2025-2035
  • Figure 149: East Asia Market Attractiveness by Channel, 2025-2035
  • Figure 150: East Asia Market Attractiveness by Country, 2025-2035
  • Figure 151: South Asia & Pacific Market Value (USD Million) by Function, 2025-2035
  • Figure 152: South Asia & Pacific Market Value (USD Million) by Product Type, 2025-2035
  • Figure 153: South Asia & Pacific Market Value (USD Million) by Technology, 2025-2035
  • Figure 154: South Asia & Pacific Market Value (USD Million) by Channel, 2025-2035
  • Figure 155: South Asia & Pacific Market Value (USD Million) by Country, 2025-2035
  • Figure 156: South Asia & Pacific Market Value (USD Million) Analysis by Country, 2020-2035
  • Figure 157: South Asia & Pacific Market Volume (Units) Analysis by Country, 2020-2035
  • Figure 158: South Asia & Pacific Market Value Share (%) and BPS Analysis by Country, 2025-2035
  • Figure 159: South Asia & Pacific Market Y-o-Y Growth (%) Projections by Country, 2025-2035
  • Figure 160: South Asia & Pacific Market Value (USD Million) Analysis by Function, 2020-2035
  • Figure 161: South Asia & Pacific Market Volume (Units) Analysis by Function, 2020-2035
  • Figure 162: South Asia & Pacific Market Value Share (%) and BPS Analysis by Function, 2025-2035
  • Figure 163: South Asia & Pacific Market Y-o-Y Growth (%) Projections by Function, 2025-2035
  • Figure 164: South Asia & Pacific Market Value (USD Million) Analysis by Product Type, 2020-2035
  • Figure 165: South Asia & Pacific Market Volume (Units) Analysis by Product Type, 2020-2035
  • Figure 166: South Asia & Pacific Market Value Share (%) and BPS Analysis by Product Type, 2025-2035
  • Figure 167: South Asia & Pacific Market Y-o-Y Growth (%) Projections by Product Type, 2025-2035
  • Figure 168: South Asia & Pacific Market Value (USD Million) Analysis by Technology, 2020-2035
  • Figure 169: South Asia & Pacific Market Volume (Units) Analysis by Technology, 2020-2035
  • Figure 170: South Asia & Pacific Market Value Share (%) and BPS Analysis by Technology, 2025-2035
  • Figure 171: South Asia & Pacific Market Y-o-Y Growth (%) Projections by Technology, 2025-2035
  • Figure 172: South Asia & Pacific Market Value (USD Million) Analysis by Channel, 2020-2035
  • Figure 173: South Asia & Pacific Market Volume (Units) Analysis by Channel, 2020-2035
  • Figure 174: South Asia & Pacific Market Value Share (%) and BPS Analysis by Channel, 2025-2035
  • Figure 175: South Asia & Pacific Market Y-o-Y Growth (%) Projections by Channel, 2025-2035
  • Figure 176: South Asia & Pacific Market Attractiveness by Function, 2025-2035
  • Figure 177: South Asia & Pacific Market Attractiveness by Product Type, 2025-2035
  • Figure 178: South Asia & Pacific Market Attractiveness by Technology, 2025-2035
  • Figure 179: South Asia & Pacific Market Attractiveness by Channel, 2025-2035
  • Figure 180: South Asia & Pacific Market Attractiveness by Country, 2025-2035
  • Figure 181: Middle East and Africa Market Value (USD Million) by Function, 2025-2035
  • Figure 182: Middle East and Africa Market Value (USD Million) by Product Type, 2025-2035
  • Figure 183: Middle East and Africa Market Value (USD Million) by Technology, 2025-2035
  • Figure 184: Middle East and Africa Market Value (USD Million) by Channel, 2025-2035
  • Figure 185: Middle East and Africa Market Value (USD Million) by Country, 2025-2035
  • Figure 186: Middle East and Africa Market Value (USD Million) Analysis by Country, 2020-2035
  • Figure 187: Middle East and Africa Market Volume (Units) Analysis by Country, 2020-2035
  • Figure 188: Middle East and Africa Market Value Share (%) and BPS Analysis by Country, 2025-2035
  • Figure 189: Middle East and Africa Market Y-o-Y Growth (%) Projections by Country, 2025-2035
  • Figure 190: Middle East and Africa Market Value (USD Million) Analysis by Function, 2020-2035
  • Figure 191: Middle East and Africa Market Volume (Units) Analysis by Function, 2020-2035
  • Figure 192: Middle East and Africa Market Value Share (%) and BPS Analysis by Function, 2025-2035
  • Figure 193: Middle East and Africa Market Y-o-Y Growth (%) Projections by Function, 2025-2035
  • Figure 194: Middle East and Africa Market Value (USD Million) Analysis by Product Type, 2020-2035
  • Figure 195: Middle East and Africa Market Volume (Units) Analysis by Product Type, 2020-2035
  • Figure 196: Middle East and Africa Market Value Share (%) and BPS Analysis by Product Type, 2025-2035
  • Figure 197: Middle East and Africa Market Y-o-Y Growth (%) Projections by Product Type, 2025-2035
  • Figure 198: Middle East and Africa Market Value (USD Million) Analysis by Technology, 2020-2035
  • Figure 199: Middle East and Africa Market Volume (Units) Analysis by Technology, 2020-2035
  • Figure 200: Middle East and Africa Market Value Share (%) and BPS Analysis by Technology, 2025-2035
  • Figure 201: Middle East and Africa Market Y-o-Y Growth (%) Projections by Technology, 2025-2035
  • Figure 202: Middle East and Africa Market Value (USD Million) Analysis by Channel, 2020-2035
  • Figure 203: Middle East and Africa Market Volume (Units) Analysis by Channel, 2020-2035
  • Figure 204: Middle East and Africa Market Value Share (%) and BPS Analysis by Channel, 2025-2035
  • Figure 205: Middle East and Africa Market Y-o-Y Growth (%) Projections by Channel, 2025-2035
  • Figure 206: Middle East and Africa Market Attractiveness by Function, 2025-2035
  • Figure 207: Middle East and Africa Market Attractiveness by Product Type, 2025-2035
  • Figure 208: Middle East and Africa Market Attractiveness by Technology, 2025-2035
  • Figure 209: Middle East and Africa Market Attractiveness by Channel, 2025-2035
  • Figure 210: Middle East and Africa Market Attractiveness by Country, 2025-2035
Dashboard
Dashboard
Dashboard
Dashboard
Dashboard
Dashboard

Full Research Suite comprises of:

Market outlook & trends analysis

Market outlook & trends analysis

Interviews & case studies

Interviews & case studies

Strategic recommendations

Strategic recommendations

Vendor profiles & capabilities analysis

Vendor profiles & capabilities analysis

5-year forecasts

5-year forecasts

8 regions and 60+ country-level data splits

8 regions and 60+ country-level data splits

Market segment data splits

Market segment data splits

12 months of continuous data updates

12 months of continuous data updates

DELIVERED AS:

PDF EXCEL ONLINE

Full Research Suite


$2000

$3500

$5000

Buy Report Now
Similar Industry Reports

Similar Industry Reports

Plant-based Cheese Market

Plant-based Cheese Market Size and Share Forecast Outlook 2025 to 2035

Plant Based Meat Packaging Market

Plant Based Meat Packaging Market Size and Share Forecast Outlook 2025 to 2035

Plant Sterol Supplements Market

Plant Sterol Supplements Market Size and Share Forecast Outlook 2025 to 2035

Plant Protein Hydrolysate Market

Plant Protein Hydrolysate Market Size and Share Forecast Outlook 2025 to 2035

Plant Asset Management Market

Plant Asset Management Market Size and Share Forecast Outlook 2025 to 2035

Plant-Derived Hyaluronic Acid Alternatives Market

Plant-Derived Hyaluronic Acid Alternatives Market Analysis - Size, Share, and Forecast Outlook 2025 to 2035

Plant Peptides Market

Plant Peptides Market Size and Share Forecast Outlook 2025 to 2035

Plant-Based Foam Market

Plant-Based Foam Market Size and Share Forecast Outlook 2025 to 2035

Planting Machinery Market

Planting Machinery Market Size and Share Forecast Outlook 2025 to 2035

Plant-based Snacks Market

Plant-based Snacks Market Analysis - Size, Share, and Forecast Outlook 2025 to 2035

Plant Based Meals Market

Plant Based Meals Market Size and Share Forecast Outlook 2025 to 2035

Plant-Derived Ceramide Alternatives Market

Plant-Derived Ceramide Alternatives Market Analysis - Size and Share Forecast Outlook 2025 to 2035

Plant-Based Squalane Market

Plant-Based Squalane Market Analysis - Size and Share Forecast Outlook 2025 to 2035

Plant Breeding Market

Plant Breeding Market Size and Share Forecast Outlook 2025 to 2035

Plant-Based Protein Processing Equipment Market

Plant-Based Protein Processing Equipment Market Size and Share Forecast Outlook 2025 to 2035

Plant-Powered Exfoliants Market

Plant-Powered Exfoliants Market Analysis - Size and Share Forecast Outlook 2025 to 2035

Plant-Based Bioplastic Shrink Packaging Market

Plant-Based Bioplastic Shrink Packaging Market Analysis - Size, Share, and Forecast Outlook 2025 to 2035

Plant-Based Methionine Market

Plant-Based Methionine Market Analysis - Size and Share Forecast Outlook 2025 to 2035

Plant-Based Shrimp Market

Plant-Based Shrimp Market Size and Share Forecast Outlook 2025 to 2035

Plant Care Services Market

Plant Care Services Market Size and Share Forecast Outlook 2025 to 2035

Future Market Insights

Plant Stem Cell Encapsulation Market

Chat With MaRIA

Chat With

MaRIA

Hi There, I am MaRIA, Your Market Research Intelligence Assistant. How may I help you?