Methodology

Plant-Based Vitamin D3 Supplements Market Forecast and Outlook 2025 to 2035

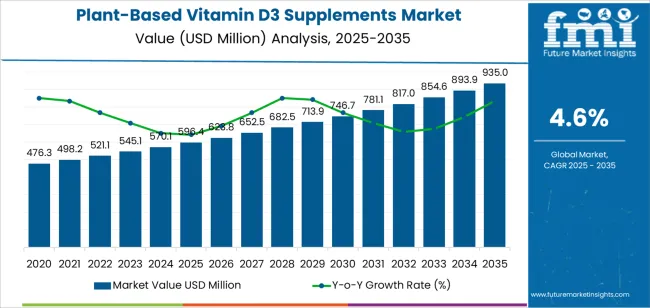
The plant-based vitamin D3 supplements market is valued at USD 596.4 million in 2025 and is forecasted to reach USD 935.0 million by 2035, growing at a CAGR of 4.6%. Market growth is supported by increasing consumer preference for vegan and vegetarian nutrition, rising awareness of vitamin D deficiency, and wider adoption of plant-derived cholecalciferol sourced from algae and lichens. These supplements provide an alternative to lanolin-derived D3 while offering equivalent bioavailability, supporting their use across general wellness, bone health, and immune support applications.

Tablets represent the leading product segment due to their stability, long shelf life, and ease of dosage control. They are widely used across retail and online distribution channels and are preferred by manufacturers for cost-effective production and formulation flexibility. Advances in plant-derived extraction methods, allergen-free formulations, and clean-label ingredient profiles are influencing product development strategies in this category.
Quick Stats for Plant-Based Vitamin D3 Supplements Market

  • Plant-Based Vitamin D3 Supplements Market Value (2025): USD 596.4 million
  • Plant-Based Vitamin D3 Supplements Market Forecast Value (2035): USD 935.0 million
  • Plant-Based Vitamin D3 Supplements Market Forecast CAGR: 4.6%
  • Leading Type in Plant-Based Vitamin D3 Supplements Market: Tablet
  • Key Growth Regions in Plant-Based Vitamin D3 Supplements Market: Asia Pacific, Europe, and North America
  • Top Players in Plant-Based Vitamin D3 Supplements Market: Vegetology, Cytoplan, Sweet Cures, Lamberts Healthcare, Healthspan, Solgar, DR.VEGAN, Biogen, Life Extension, Inlife Pharma, Land Art, Nordic

Plant Based Vitamin D3 Supplements Market Market Value Analysis

Asia Pacific leads global market expansion, driven by growing nutrition awareness and increased adoption of plant-based supplements in China, India, and Australia. Europe and North America maintain strong demand through established nutraceutical markets and sustained interest in vegan dietary products. Key companies include Vegetology, Cytoplan, Sweet Cures, Lamberts Healthcare, Healthspan, Solgar, and DR.VEGAN, focusing on formulation quality, plant-based sourcing, and evidence-supported nutrient delivery.

What is the Growth Forecast for the Plant-Based Vitamin D3 Supplements Market through 2035?

The acceleration and deceleration pattern shows an initial period of firm growth followed by a gradual shift toward steadier demand. Between 2025 and 2029, the market will move through an acceleration phase driven by increased consumer preference for vegan and allergen-free supplements. Expansion of plant-derived D3 sourced from lichen, along with wider distribution through e-commerce and specialty nutrition channels, will support early momentum. Regulatory clarity for plant-based fortification in major regions will further reinforce short-term growth.

From 2030 to 2035, the market will enter a mild deceleration phase as adoption becomes more uniform across established dietary-supplement categories. Growth will rely on replacement purchases, incremental formulation improvements, and broader inclusion of plant-based D3 in multivitamins, functional foods, and fortified beverages. While discretionary spending patterns may create minor fluctuations, consistent demand for vegan alternatives and clean-label ingredients will support stable expansion. The overall pattern reflects a market transitioning from early lifestyle-driven acceleration to a mature stage shaped by product standardization, recurring use, and continued interest in plant-sourced micronutrient supplementation.

Plant-Based Vitamin D3 Supplements Market Key Takeaways

Metric Value
Market Value (2025) USD 596.4 million
Market Forecast Value (2035) USD 935.0 million
Forecast CAGR (2025 to 2035) 4.6%

Why is the Plant Based Vitamin D3 Supplements Market Growing?

The plant based vitamin D3 supplements market is growing as consumers shift toward vegan and vegetarian diets and seek nutrient sources that do not rely on animal ingredients. Plant derived D3, typically obtained from lichen or algae, appeals to users who prioritise ethical, ecofriendly and clean label supplements. Rising awareness of vitamin D deficiency across all age groups also supports higher supplement intake for bone health, immunity and general wellness.

Improvements in extraction methods and formulation allow manufacturers to offer high potency capsules, oils, gummies and fortified foods that meet varied consumer preferences. Online retail and subscription services increase availability and encourage routine use. Growth is further supported by wider adoption of plant based nutrition in fitness, sports and lifestyle markets. Constraints include higher production costs for plant sourced D3, limited global suppliers for raw material and varying regulatory requirements across regions that influence product claims and distribution.

Which Product Type and Application Segments Lead the Plant-Based Vitamin D3 Supplements Market?

The plant-based vitamin d3 supplements market is segmented by product type and application. By product type, the market includes liquid preparations, tablet forms, and others. Based on application, it is categorized into online sales and offline sales channels. Regionally, the market is divided into Asia Pacific, Europe, North America, and other key regions.
By Product Type, the Tablet Segment Accounts for the Largest Market Share

Plant Based Vitamin D3 Supplements Market Analysis By Product Type

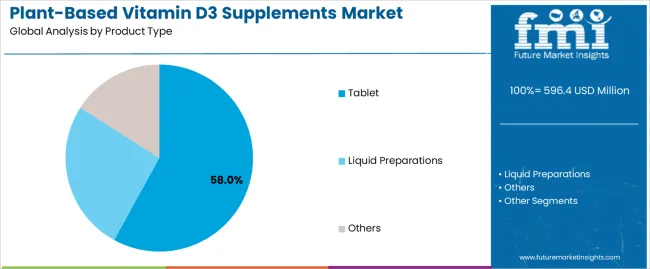
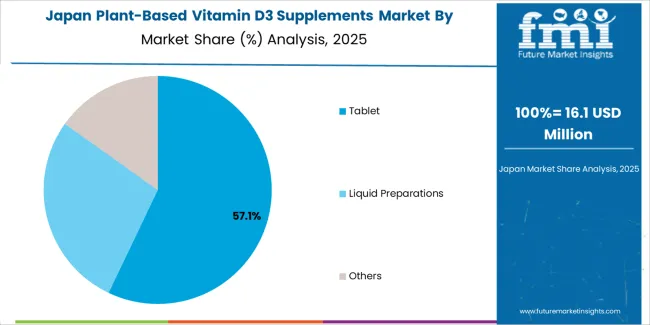
The tablet segment represents the leading category in the plant-based vitamin D3 supplements market, accounting for an estimated 58.0% of total market share in 2025. Tablets are widely adopted due to their longer shelf life, dosing consistency, and compatibility with established supplement distribution channels. They remain the dominant format for daily nutritional supplementation and are favored by consumers seeking standardized intake and cost-efficient options.

The liquid preparations segment follows with an estimated 32.0% share. Liquid formulations support flexible dosing, faster absorption, and suitability for children and elderly users who prefer non-tablet forms. The others category, including gummies, sprays, and powder sachets, accounts for about 10.0%, driven by niche demand for convenience-oriented formats.

Key factors supporting the tablet segment include:
  • High stability and longer product shelf life.
  • Ease of mass production and packaging consistency.
  • Broad consumer familiarity with tablet supplements.
  • Lower storage and transportation requirements compared to liquid forms.

By Application, the Online Sales Segment Represents the Dominant Market Category

Plant Based Vitamin D3 Supplements Market Analysis By Application

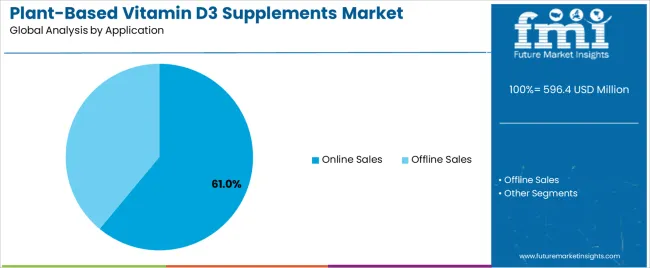
The online sales segment accounts for approximately 61.0% of the plant-based vitamin D3 supplements market in 2025. E-commerce growth, combined with increasing consumer preference for home delivery of nutritional products, has accelerated online supplement purchases. Digital platforms offer product variety, transparent ingredient information, and subscription-based replenishment services.

The offline sales segment, representing about 39.0%, includes pharmacies, health stores, supermarkets, and specialty nutrition retailers. Offline distribution remains important for consumers who prefer in-person consultation or immediate product availability.

Primary dynamics driving demand from the online sales segment include:

  • Expansion of e-commerce channels for nutritional supplements.
  • Increased consumer preference for direct-to-door delivery and auto-replenishment.
  • Availability of detailed product descriptions, reviews, and certification information.
  • Growth in digital health and wellness purchasing behavior.

What are the Drivers, Restraints, and Key Trends of the Plant-Based Vitamin D3 Supplements Market?

Growing interest in vegan nutrition, rising awareness of Vitamin D deficiency, and increased preference for sustainably sourced ingredients are driving market growth.

The Plant-Based Vitamin D3 Supplements Market is expanding as consumers shift toward vegetarian and vegan lifestyles and seek alternatives to traditional lanolin-derived Vitamin D3. Rising global awareness of Vitamin D deficiency, especially in regions with limited sunlight exposure, strengthens demand for daily supplementation. Plant-based D3 derived from lichens and algae appeals to consumers who prioritise clean-label, allergen-free, and ethically sourced ingredients. The expansion of e-commerce and direct-to-consumer health brands allows plant-based supplements to reach wider demographics, including individuals seeking immune-support formulations, bone-health blends, and holistic wellness products. Manufacturers are improving product stability, potency, and bioavailability, making plant-derived D3 formulations competitive with established animal-based variants.

Higher production cost, limited raw material supply, and variability in product potency are restraining adoption.

Plant-based Vitamin D3 generally costs more to produce than conventional D3 due to constrained raw material availability and specialised extraction processes. These cost differentials can limit adoption in price-sensitive markets or among large-scale supplement formulators. Supply chain limitations for lichen and algae sources can create inconsistency in availability, which affects production planning and pricing stability. Potency variations across plant-based inputs require stringent testing and standardisation, increasing regulatory and quality-control burdens. Some consumers also remain unaware of the functional differences between plant-based and traditional D3, limiting immediate transition across mainstream retail channels.

Expansion of fortified plant-based foods, integration of D3 into multi-nutrient complexes, and rising adoption in emerging wellness markets are shaping industry trends.

Manufacturers are incorporating plant-derived D3 into fortified beverages, dairy alternatives, cereals, and functional snacks to meet consumer demand for convenient nutrient intake. Multi-nutrient complexes combining plant-based D3 with calcium, magnesium, K2, and omega-rich oils are gaining traction across wellness and bone-health categories. Growth in Asia Pacific, Latin America, and the Middle East reflects increasing awareness of nutritional deficiencies and improved access to premium supplements through digital retail platforms. Advances in algae cultivation, extraction research, and ingredient stabilisation are expected to broaden supply availability and support long-term market expansion.

Analysis of the Plant-Based Vitamin D3 Supplements Market by Key Country

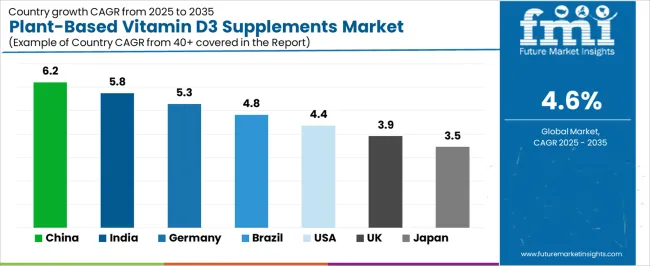
The global plant-based Vitamin D3 supplements market is expanding through 2035, supported by increased adoption of vegan nutrition, rising interest in non-animal vitamin sources, and broader demand for clean-label products. China leads with a 6.2% CAGR, followed by India at 5.8%, reflecting strong consumption of plant-derived nutrition and expanding supplement retail channels. Germany grows at 5.3%, supported by regulated product standards and rising preference for algae-derived ingredients. Brazil records 4.8%, driven by increasing awareness of plant-based micronutrients. The United States grows at 4.4%, while the United Kingdom (3.9%) and Japan (3.5%) sustain stable demand through established nutraceutical markets and consistent clean-label trends.
Plant Based Vitamin D3 Supplements Market Cagr Analysis By Country

Country CAGR (%)
China 6.2
India 5.8
Germany 5.3
Brazil 4.8
USA 4.4
UK 3.9
Japan 3.5

How is China leading the Plant-Based Vitamin D3 Supplements Market?

China’s market grows at 6.2% CAGR, supported by rising interest in plant-based nutrition, increasing vitamin-deficiency awareness, and expanding availability of algae-derived Vitamin D3 formulations. Manufacturers offer capsules, gummies, and liquid drops tailored to adult and senior consumers seeking non-animal products. Domestic supplement brands integrate plant-based D3 into multivitamin blends and immunity-support formulations. Growth in e-commerce and pharmacy channels strengthens distribution across major cities and secondary regions. Broader adoption of plant-based diets and increased preventive-health spending reinforce long-term demand for non-synthetic, non-animal vitamin sources.

Key Market Factors:

  • Rising use of algae-derived D3 in standalone and blended supplements.
  • High demand through e-commerce and nationwide pharmacy networks.
  • Increased consumer interest in non-animal, clean-label nutrients.
  • Growth in preventive-health purchasing across urban households.

How is India advancing the Plant-Based Vitamin D3 Supplements Market?

India’s market grows at 5.8% CAGR, driven by rising health-supplement use, increased vitamin-deficiency prevalence, and stronger demand for vegan formulations. Plant-based Vitamin D3 products made from lichen or algae gain traction among adults adopting clean-label options. Domestic nutraceutical companies launch capsules, sachets, and chewable formats suited for daily supplementation. Growth in online platforms and organized pharmacy chains expands accessibility across metro and Tier-2 cities. Preventive-health awareness and lifestyle-related deficiency concerns support ongoing adoption of plant-derived Vitamin D3 within general wellness routines.

Market Development Factors:
  • Strong demand for vegan and clean-label supplement formats.
  • Expansion of nutraceutical brands offering algae- and lichen-based D3.
  • Increased use across preventive-health and daily wellness categories.
  • Broader distribution through pharmacies and digital health platforms.

How is Germany advancing the Plant-Based Vitamin D3 Supplements Market?

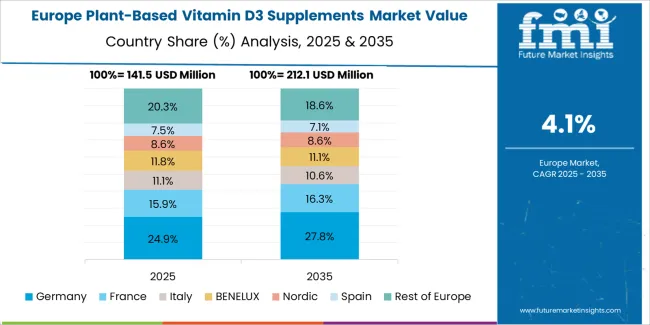
Plant Based Vitamin D3 Supplements Market Europe Country Market Share Analysis, 2025 & 2035

Germany’s market grows at 5.3% CAGR, supported by established dietary-supplement regulations, rising preference for plant-sourced micronutrients, and broad adoption of algae-derived Vitamin D3 within vegan product portfolios. Consumers favor formulations featuring verified purity, documented sourcing, and compliance with European ingredient guidelines. Retailers and health stores supply capsules, sprays, and fortified foods containing plant-derived D3. Increased focus on clean-label composition and allergen-free ingredients strengthens demand. Use across adult wellness, senior health, and fortified nutrition categories supports stable market expansion.

Key Market Characteristics:

  • High reliance on regulated, verified plant-derived vitamin sources.
  • Broad availability of capsule, spray, and fortified-food formats.
  • Increased demand for allergen-free and clean-label supplements.
  • Adoption across adult, senior, and specialty-nutrition categories.

How is Brazil developing the Plant-Based Vitamin D3 Supplements Market?

Brazil’s market grows at 4.8% CAGR, driven by increasing interest in plant-based diets, rising nutritional-supplement usage, and growing awareness of Vitamin D deficiency. Consumers adopt plant-based D3 supplements as part of broader wellness routines, including immune support and daily nutritional balance. Retailers distribute algae-derived and lichen-derived D3 products across pharmacies and online marketplaces. Growth in urban health-conscious households strengthens demand for clean-label formulations. Domestic nutraceutical firms expand offerings aligned with vegan and natural-ingredient preferences.

Market Development Factors:
  • Increased awareness of vitamin-deficiency risks.
  • Rising demand for vegan nutritional products in urban areas.
  • Expanded retail distribution across pharmacies and online stores.
  • Product development by local nutraceutical manufacturers.

How is the United States progressing in the Plant-Based Vitamin D3 Supplements Market?

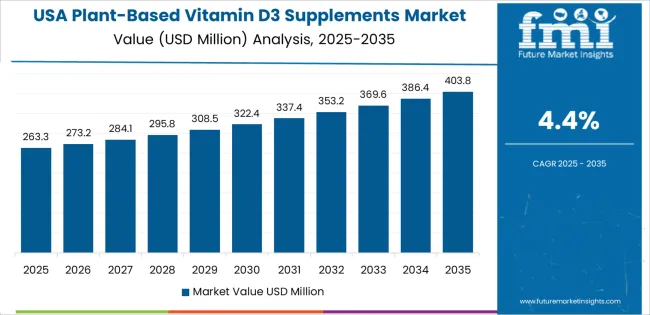
Plant Based Vitamin D3 Supplements Market Country Value Analysis

The United States grows at 4.4% CAGR, supported by established nutraceutical consumption, rising adoption of plant-based diets, and increased availability of algae-derived D3 within clean-label supplement portfolios. Health-focused consumers seek plant-based alternatives to traditional lanolin-derived D3. Manufacturers offer gummies, capsules, and liquid formulations positioned for general wellness, bone health, and immune support. Retailers and online marketplaces distribute vegan-certified products across premium and mainstream categories. Integration of plant-based D3 in functional foods and multivitamin blends supports ongoing adoption.

Key Market Factors:

  • Broad use of plant-based D3 in wellness and immune-support supplements.
  • Strong retail presence across natural-product and online channels.
  • Increased preference for vegan-certified and clean-label formulations.
  • Use in fortified foods and multivitamin combinations.

How is the United Kingdom developing the Plant-Based Vitamin D3 Supplements Market?

The United Kingdom’s market grows at 3.9% CAGR, supported by steady demand for clean-label supplements, expansion of vegan nutritional products, and increased use of algae-derived D3 in wellness routines. Retailers offer capsules, chewables, and sprays tailored to adult consumers seeking plant-based alternatives. Health stores and online platforms supply certified vegan D3 formulations aligned with national supplement-use guidelines. Broader awareness of vitamin-deficiency risks during winter months supports consistent seasonal demand.

Market Development Factors:
  • Strong demand for certified vegan and clean-label supplements.
  • Increased adoption of plant-derived D3 during seasonal deficiency periods.
  • Broad availability across online platforms and health stores.
  • Growth in plant-based lifestyle and wellness segments.

How is Japan maintaining the Plant-Based Vitamin D3 Supplements Market?

Plant Based Vitamin D3 Supplements Market Japan Market Share Analysis By Product Type

Japan’s market grows at 3.5% CAGR, supported by consistent nutraceutical consumption, interest in plant-based wellness products, and adoption of clean-label supplements among adult consumers. Algae-derived D3 formulations are used in capsules, chewable formats, and fortified health foods. Domestic brands emphasize purity, dosage stability, and compact packaging suited for daily use. Growth in e-commerce and specialty health stores strengthens access to vegan nutritional products. Increased preventive-health focus among older adults supports continued uptake of plant-derived D3 supplements.

Key Market Characteristics:
  • Stable adoption of algae-derived D3 across adult wellness routines.
  • Strong interest in clean-label and purity-focused formulations.
  • Expanded retail presence through pharmacies and online stores.
  • Consistent demand among aging populations prioritizing preventive health.

What is the competitive landscape of the Plant-Based Vitamin D3 Supplements Market?

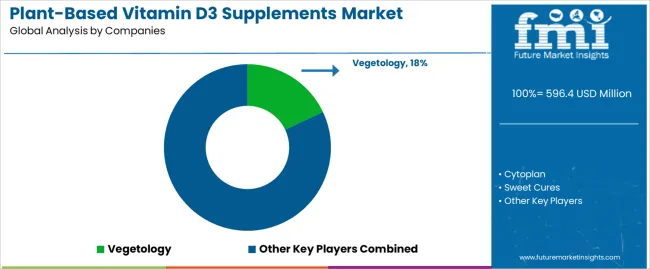
Plant Based Vitamin D3 Supplements Market Analysis By Company

The plant-based vitamin D3 supplements market is moderately fragmented, with about a dozen manufacturers supplying algae-derived D3 for nutritional, vegan, and fortified health products. Vegetology leads the market with an estimated 18.0% global share, supported by its early adoption of algae-sourced D3 and consistent product quality verified through established supplement channels. Its leadership is reinforced by controlled raw material sourcing and reliable formulation standards for capsules, sprays, and blended nutritional products.

Cytoplan, Sweet Cures, and Lamberts Healthcare follow as strong competitors, offering plant-based D3 in formulations suited to daily supplementation and dietary programmes. Their positions rely on documented ingredient quality, batch consistency, and established presence in the UK and European health markets. Healthspan, Solgar, and DR.VEGAN maintain balanced portfolios that integrate plant-sourced D3 within broader vitamin and mineral product lines.

International suppliers including Biogen, Life Extension, Inlife Pharma, and Land Art contribute to market growth through regionally adapted formulations and diverse delivery formats such as liquids, tablets, and soft gels. Nordic supports niche demand for plant-derived D3 in clean-label products aligned with Scandinavian nutrition preferences.

Competition in this market centers on ingredient purity, certification transparency, and formulation stability. Growth is driven by rising demand for vegan-compatible supplements and wider consumer interest in algae-derived nutrients that support consistent serum D3 levels without reliance on animal sources.

Key Players in the Plant-Based Vitamin D3 Supplements Market

  • Vegetology
  • Cytoplan
  • Sweet Cures
  • Lamberts Healthcare
  • Healthspan
  • Solgar
  • DR.VEGAN
  • Biogen
  • Life Extension
  • Inlife Pharma
  • Land Art
  • Nordic

Scope of the Report

Items Values
Quantitative Units USD million
Product Type Liquid Preparations, Tablet, Others
Application Online Sales, Offline Sales
Regions Covered Asia Pacific, Europe, North America, Latin America, Middle East & Africa
Countries Covered India, China, USA, Germany, South Korea, Japan, Italy, and 40+ countries
Key Companies Profiled Vegetology, Cytoplan, Sweet Cures, Lamberts Healthcare, Healthspan, Solgar, DR.VEGAN, Biogen, Life Extension, Inlife Pharma, Land Art, Nordic
Additional Attributes Dollar sales by product type and application categories; regional adoption trends across Asia Pacific, Europe, and North America; competitive landscape of plant-based nutraceutical and vitamin supplement brands; advancements in vegan-certified D3 formulations sourced from lichen; integration with e-commerce health retail, nutrition programs, and ecofriendly supplement manufacturing.

Plant-Based Vitamin D3 Supplements Market by Segment

Product Type:

  • Liquid Preparations
  • Tablet
  • Others

Application:

  • Online Sales
  • Offline Sales

Region:

  • Asia Pacific
    • China
    • Japan
    • South Korea
    • India
    • Australia & New Zealand
    • ASEAN
    • Rest of Asia Pacific
  • Europe
    • Germany
    • United Kingdom
    • France
    • Italy
    • Spain
    • Nordic
    • BENELUX
    • Rest of Europe
  • North America
    • United States
    • Canada
    • Mexico
  • Latin America
    • Brazil
    • Chile
    • Rest of Latin America
  • Middle East & Africa
    • Kingdom of Saudi Arabia
    • Other GCC Countries
    • Turkey
    • South Africa
    • Other African Union
    • Rest of Middle East & Africa

Frequently Asked Questions

How big is the plant-based vitamin d3 supplements market in 2025?

The global plant-based vitamin d3 supplements market is estimated to be valued at USD 596.4 million in 2025.

What will be the size of plant-based vitamin d3 supplements market in 2035?

The market size for the plant-based vitamin d3 supplements market is projected to reach USD 935.0 million by 2035.

How much will be the plant-based vitamin d3 supplements market growth between 2025 and 2035?

The plant-based vitamin d3 supplements market is expected to grow at a 4.6% CAGR between 2025 and 2035.

What are the key product types in the plant-based vitamin d3 supplements market?

The key product types in plant-based vitamin d3 supplements market are tablet, liquid preparations and others.

Which application segment to contribute significant share in the plant-based vitamin d3 supplements market in 2025?

In terms of application, online sales segment to command 61.0% share in the plant-based vitamin d3 supplements market in 2025.

Table of Content

  1. Executive Summary
    • Global Market Outlook
    • Demand to side Trends
    • Supply to side Trends
    • Technology Roadmap Analysis
    • Analysis and Recommendations
  2. Market Overview
    • Market Coverage / Taxonomy
    • Market Definition / Scope / Limitations
  3. Market Background
    • Market Dynamics
      • Drivers
      • Restraints
      • Opportunity
      • Trends
    • Scenario Forecast
      • Demand in Optimistic Scenario
      • Demand in Likely Scenario
      • Demand in Conservative Scenario
    • Opportunity Map Analysis
    • Product Life Cycle Analysis
    • Supply Chain Analysis
    • Investment Feasibility Matrix
    • Value Chain Analysis
    • PESTLE and Porter’s Analysis
    • Regulatory Landscape
    • Regional Parent Market Outlook
    • Production and Consumption Statistics
    • Import and Export Statistics
  4. Global Market Analysis 2020 to 2024 and Forecast, 2025 to 2035
    • Historical Market Size Value (USD Million) Analysis, 2020 to 2024
    • Current and Future Market Size Value (USD Million) Projections, 2025 to 2035
      • Y to o to Y Growth Trend Analysis
      • Absolute $ Opportunity Analysis
  5. Global Market Pricing Analysis 2020 to 2024 and Forecast 2025 to 2035
  6. Global Market Analysis 2020 to 2024 and Forecast 2025 to 2035, By Product Type
    • Introduction / Key Findings
    • Historical Market Size Value (USD Million) Analysis By Product Type , 2020 to 2024
    • Current and Future Market Size Value (USD Million) Analysis and Forecast By Product Type , 2025 to 2035
      • Tablet
      • Liquid Preparations
      • Others
    • Y to o to Y Growth Trend Analysis By Product Type , 2020 to 2024
    • Absolute $ Opportunity Analysis By Product Type , 2025 to 2035
  7. Global Market Analysis 2020 to 2024 and Forecast 2025 to 2035, By Application
    • Introduction / Key Findings
    • Historical Market Size Value (USD Million) Analysis By Application, 2020 to 2024
    • Current and Future Market Size Value (USD Million) Analysis and Forecast By Application, 2025 to 2035
      • Online Sales
      • Offline Sales
    • Y to o to Y Growth Trend Analysis By Application, 2020 to 2024
    • Absolute $ Opportunity Analysis By Application, 2025 to 2035
  8. Global Market Analysis 2020 to 2024 and Forecast 2025 to 2035, By Region
    • Introduction
    • Historical Market Size Value (USD Million) Analysis By Region, 2020 to 2024
    • Current Market Size Value (USD Million) Analysis and Forecast By Region, 2025 to 2035
      • North America
      • Latin America
      • Western Europe
      • Eastern Europe
      • East Asia
      • South Asia and Pacific
      • Middle East & Africa
    • Market Attractiveness Analysis By Region
  9. North America Market Analysis 2020 to 2024 and Forecast 2025 to 2035, By Country
    • Historical Market Size Value (USD Million) Trend Analysis By Market Taxonomy, 2020 to 2024
    • Market Size Value (USD Million) Forecast By Market Taxonomy, 2025 to 2035
      • By Country
        • USA
        • Canada
        • Mexico
      • By Product Type
      • By Application
    • Market Attractiveness Analysis
      • By Country
      • By Product Type
      • By Application
    • Key Takeaways
  10. Latin America Market Analysis 2020 to 2024 and Forecast 2025 to 2035, By Country
    • Historical Market Size Value (USD Million) Trend Analysis By Market Taxonomy, 2020 to 2024
    • Market Size Value (USD Million) Forecast By Market Taxonomy, 2025 to 2035
      • By Country
        • Brazil
        • Chile
        • Rest of Latin America
      • By Product Type
      • By Application
    • Market Attractiveness Analysis
      • By Country
      • By Product Type
      • By Application
    • Key Takeaways
  11. Western Europe Market Analysis 2020 to 2024 and Forecast 2025 to 2035, By Country
    • Historical Market Size Value (USD Million) Trend Analysis By Market Taxonomy, 2020 to 2024
    • Market Size Value (USD Million) Forecast By Market Taxonomy, 2025 to 2035
      • By Country
        • Germany
        • UK
        • Italy
        • Spain
        • France
        • Nordic
        • BENELUX
        • Rest of Western Europe
      • By Product Type
      • By Application
    • Market Attractiveness Analysis
      • By Country
      • By Product Type
      • By Application
    • Key Takeaways
  12. Eastern Europe Market Analysis 2020 to 2024 and Forecast 2025 to 2035, By Country
    • Historical Market Size Value (USD Million) Trend Analysis By Market Taxonomy, 2020 to 2024
    • Market Size Value (USD Million) Forecast By Market Taxonomy, 2025 to 2035
      • By Country
        • Russia
        • Poland
        • Hungary
        • Balkan & Baltic
        • Rest of Eastern Europe
      • By Product Type
      • By Application
    • Market Attractiveness Analysis
      • By Country
      • By Product Type
      • By Application
    • Key Takeaways
  13. East Asia Market Analysis 2020 to 2024 and Forecast 2025 to 2035, By Country
    • Historical Market Size Value (USD Million) Trend Analysis By Market Taxonomy, 2020 to 2024
    • Market Size Value (USD Million) Forecast By Market Taxonomy, 2025 to 2035
      • By Country
        • China
        • Japan
        • South Korea
      • By Product Type
      • By Application
    • Market Attractiveness Analysis
      • By Country
      • By Product Type
      • By Application
    • Key Takeaways
  14. South Asia and Pacific Market Analysis 2020 to 2024 and Forecast 2025 to 2035, By Country
    • Historical Market Size Value (USD Million) Trend Analysis By Market Taxonomy, 2020 to 2024
    • Market Size Value (USD Million) Forecast By Market Taxonomy, 2025 to 2035
      • By Country
        • India
        • ASEAN
        • Australia & New Zealand
        • Rest of South Asia and Pacific
      • By Product Type
      • By Application
    • Market Attractiveness Analysis
      • By Country
      • By Product Type
      • By Application
    • Key Takeaways
  15. Middle East & Africa Market Analysis 2020 to 2024 and Forecast 2025 to 2035, By Country
    • Historical Market Size Value (USD Million) Trend Analysis By Market Taxonomy, 2020 to 2024
    • Market Size Value (USD Million) Forecast By Market Taxonomy, 2025 to 2035
      • By Country
        • Kingdom of Saudi Arabia
        • Other GCC Countries
        • Turkiye
        • South Africa
        • Other African Union
        • Rest of Middle East & Africa
      • By Product Type
      • By Application
    • Market Attractiveness Analysis
      • By Country
      • By Product Type
      • By Application
    • Key Takeaways
  16. Key Countries Market Analysis
    • USA
      • Pricing Analysis
      • Market Share Analysis, 2024
        • By Product Type
        • By Application
    • Canada
      • Pricing Analysis
      • Market Share Analysis, 2024
        • By Product Type
        • By Application
    • Mexico
      • Pricing Analysis
      • Market Share Analysis, 2024
        • By Product Type
        • By Application
    • Brazil
      • Pricing Analysis
      • Market Share Analysis, 2024
        • By Product Type
        • By Application
    • Chile
      • Pricing Analysis
      • Market Share Analysis, 2024
        • By Product Type
        • By Application
    • Germany
      • Pricing Analysis
      • Market Share Analysis, 2024
        • By Product Type
        • By Application
    • UK
      • Pricing Analysis
      • Market Share Analysis, 2024
        • By Product Type
        • By Application
    • Italy
      • Pricing Analysis
      • Market Share Analysis, 2024
        • By Product Type
        • By Application
    • Spain
      • Pricing Analysis
      • Market Share Analysis, 2024
        • By Product Type
        • By Application
    • France
      • Pricing Analysis
      • Market Share Analysis, 2024
        • By Product Type
        • By Application
    • India
      • Pricing Analysis
      • Market Share Analysis, 2024
        • By Product Type
        • By Application
    • ASEAN
      • Pricing Analysis
      • Market Share Analysis, 2024
        • By Product Type
        • By Application
    • Australia & New Zealand
      • Pricing Analysis
      • Market Share Analysis, 2024
        • By Product Type
        • By Application
    • China
      • Pricing Analysis
      • Market Share Analysis, 2024
        • By Product Type
        • By Application
    • Japan
      • Pricing Analysis
      • Market Share Analysis, 2024
        • By Product Type
        • By Application
    • South Korea
      • Pricing Analysis
      • Market Share Analysis, 2024
        • By Product Type
        • By Application
    • Russia
      • Pricing Analysis
      • Market Share Analysis, 2024
        • By Product Type
        • By Application
    • Poland
      • Pricing Analysis
      • Market Share Analysis, 2024
        • By Product Type
        • By Application
    • Hungary
      • Pricing Analysis
      • Market Share Analysis, 2024
        • By Product Type
        • By Application
    • Kingdom of Saudi Arabia
      • Pricing Analysis
      • Market Share Analysis, 2024
        • By Product Type
        • By Application
    • Turkiye
      • Pricing Analysis
      • Market Share Analysis, 2024
        • By Product Type
        • By Application
    • South Africa
      • Pricing Analysis
      • Market Share Analysis, 2024
        • By Product Type
        • By Application
  17. Market Structure Analysis
    • Competition Dashboard
    • Competition Benchmarking
    • Market Share Analysis of Top Players
      • By Regional
      • By Product Type
      • By Application
  18. Competition Analysis
    • Competition Deep Dive
      • Vegetology
        • Overview
        • Product Portfolio
        • Profitability by Market Segments (Product/Age /Sales Channel/Region)
        • Sales Footprint
        • Strategy Overview
          • Marketing Strategy
          • Product Strategy
          • Channel Strategy
      • Cytoplan
      • Sweet Cures
      • Lamberts Healthcare
      • Healthspan
      • Solgar
      • DR.VEGAN
      • Biogen
      • Life Extension
      • Inlife Pharma
      • Land Art
      • Nordic
  19. Assumptions & Acronyms Used
  20. Research Methodology

List of Tables

  • Table 1: Global Market Value (USD Million) Forecast by Region, 2020 to 2035
  • Table 2: Global Market Value (USD Million) Forecast by Product Type , 2020 to 2035
  • Table 3: Global Market Value (USD Million) Forecast by Application, 2020 to 2035
  • Table 4: North America Market Value (USD Million) Forecast by Country, 2020 to 2035
  • Table 5: North America Market Value (USD Million) Forecast by Product Type , 2020 to 2035
  • Table 6: North America Market Value (USD Million) Forecast by Application, 2020 to 2035
  • Table 7: Latin America Market Value (USD Million) Forecast by Country, 2020 to 2035
  • Table 8: Latin America Market Value (USD Million) Forecast by Product Type , 2020 to 2035
  • Table 9: Latin America Market Value (USD Million) Forecast by Application, 2020 to 2035
  • Table 10: Western Europe Market Value (USD Million) Forecast by Country, 2020 to 2035
  • Table 11: Western Europe Market Value (USD Million) Forecast by Product Type , 2020 to 2035
  • Table 12: Western Europe Market Value (USD Million) Forecast by Application, 2020 to 2035
  • Table 13: Eastern Europe Market Value (USD Million) Forecast by Country, 2020 to 2035
  • Table 14: Eastern Europe Market Value (USD Million) Forecast by Product Type , 2020 to 2035
  • Table 15: Eastern Europe Market Value (USD Million) Forecast by Application, 2020 to 2035
  • Table 16: East Asia Market Value (USD Million) Forecast by Country, 2020 to 2035
  • Table 17: East Asia Market Value (USD Million) Forecast by Product Type , 2020 to 2035
  • Table 18: East Asia Market Value (USD Million) Forecast by Application, 2020 to 2035
  • Table 19: South Asia and Pacific Market Value (USD Million) Forecast by Country, 2020 to 2035
  • Table 20: South Asia and Pacific Market Value (USD Million) Forecast by Product Type , 2020 to 2035
  • Table 21: South Asia and Pacific Market Value (USD Million) Forecast by Application, 2020 to 2035
  • Table 22: Middle East & Africa Market Value (USD Million) Forecast by Country, 2020 to 2035
  • Table 23: Middle East & Africa Market Value (USD Million) Forecast by Product Type , 2020 to 2035
  • Table 24: Middle East & Africa Market Value (USD Million) Forecast by Application, 2020 to 2035

List of Figures

  • Figure 1: Global Market Pricing Analysis
  • Figure 2: Global Market Value (USD Million) Forecast 2020-2035
  • Figure 3: Global Market Value Share and BPS Analysis by Product Type , 2025 and 2035
  • Figure 4: Global Market Y-o-Y Growth Comparison by Product Type , 2025-2035
  • Figure 5: Global Market Attractiveness Analysis by Product Type
  • Figure 6: Global Market Value Share and BPS Analysis by Application, 2025 and 2035
  • Figure 7: Global Market Y-o-Y Growth Comparison by Application, 2025-2035
  • Figure 8: Global Market Attractiveness Analysis by Application
  • Figure 9: Global Market Value (USD Million) Share and BPS Analysis by Region, 2025 and 2035
  • Figure 10: Global Market Y-o-Y Growth Comparison by Region, 2025-2035
  • Figure 11: Global Market Attractiveness Analysis by Region
  • Figure 12: North America Market Incremental Dollar Opportunity, 2025-2035
  • Figure 13: Latin America Market Incremental Dollar Opportunity, 2025-2035
  • Figure 14: Western Europe Market Incremental Dollar Opportunity, 2025-2035
  • Figure 15: Eastern Europe Market Incremental Dollar Opportunity, 2025-2035
  • Figure 16: East Asia Market Incremental Dollar Opportunity, 2025-2035
  • Figure 17: South Asia and Pacific Market Incremental Dollar Opportunity, 2025-2035
  • Figure 18: Middle East & Africa Market Incremental Dollar Opportunity, 2025-2035
  • Figure 19: North America Market Value Share and BPS Analysis by Country, 2025 and 2035
  • Figure 20: North America Market Value Share and BPS Analysis by Product Type , 2025 and 2035
  • Figure 21: North America Market Y-o-Y Growth Comparison by Product Type , 2025-2035
  • Figure 22: North America Market Attractiveness Analysis by Product Type
  • Figure 23: North America Market Value Share and BPS Analysis by Application, 2025 and 2035
  • Figure 24: North America Market Y-o-Y Growth Comparison by Application, 2025-2035
  • Figure 25: North America Market Attractiveness Analysis by Application
  • Figure 26: Latin America Market Value Share and BPS Analysis by Country, 2025 and 2035
  • Figure 27: Latin America Market Value Share and BPS Analysis by Product Type , 2025 and 2035
  • Figure 28: Latin America Market Y-o-Y Growth Comparison by Product Type , 2025-2035
  • Figure 29: Latin America Market Attractiveness Analysis by Product Type
  • Figure 30: Latin America Market Value Share and BPS Analysis by Application, 2025 and 2035
  • Figure 31: Latin America Market Y-o-Y Growth Comparison by Application, 2025-2035
  • Figure 32: Latin America Market Attractiveness Analysis by Application
  • Figure 33: Western Europe Market Value Share and BPS Analysis by Country, 2025 and 2035
  • Figure 34: Western Europe Market Value Share and BPS Analysis by Product Type , 2025 and 2035
  • Figure 35: Western Europe Market Y-o-Y Growth Comparison by Product Type , 2025-2035
  • Figure 36: Western Europe Market Attractiveness Analysis by Product Type
  • Figure 37: Western Europe Market Value Share and BPS Analysis by Application, 2025 and 2035
  • Figure 38: Western Europe Market Y-o-Y Growth Comparison by Application, 2025-2035
  • Figure 39: Western Europe Market Attractiveness Analysis by Application
  • Figure 40: Eastern Europe Market Value Share and BPS Analysis by Country, 2025 and 2035
  • Figure 41: Eastern Europe Market Value Share and BPS Analysis by Product Type , 2025 and 2035
  • Figure 42: Eastern Europe Market Y-o-Y Growth Comparison by Product Type , 2025-2035
  • Figure 43: Eastern Europe Market Attractiveness Analysis by Product Type
  • Figure 44: Eastern Europe Market Value Share and BPS Analysis by Application, 2025 and 2035
  • Figure 45: Eastern Europe Market Y-o-Y Growth Comparison by Application, 2025-2035
  • Figure 46: Eastern Europe Market Attractiveness Analysis by Application
  • Figure 47: East Asia Market Value Share and BPS Analysis by Country, 2025 and 2035
  • Figure 48: East Asia Market Value Share and BPS Analysis by Product Type , 2025 and 2035
  • Figure 49: East Asia Market Y-o-Y Growth Comparison by Product Type , 2025-2035
  • Figure 50: East Asia Market Attractiveness Analysis by Product Type
  • Figure 51: East Asia Market Value Share and BPS Analysis by Application, 2025 and 2035
  • Figure 52: East Asia Market Y-o-Y Growth Comparison by Application, 2025-2035
  • Figure 53: East Asia Market Attractiveness Analysis by Application
  • Figure 54: South Asia and Pacific Market Value Share and BPS Analysis by Country, 2025 and 2035
  • Figure 55: South Asia and Pacific Market Value Share and BPS Analysis by Product Type , 2025 and 2035
  • Figure 56: South Asia and Pacific Market Y-o-Y Growth Comparison by Product Type , 2025-2035
  • Figure 57: South Asia and Pacific Market Attractiveness Analysis by Product Type
  • Figure 58: South Asia and Pacific Market Value Share and BPS Analysis by Application, 2025 and 2035
  • Figure 59: South Asia and Pacific Market Y-o-Y Growth Comparison by Application, 2025-2035
  • Figure 60: South Asia and Pacific Market Attractiveness Analysis by Application
  • Figure 61: Middle East & Africa Market Value Share and BPS Analysis by Country, 2025 and 2035
  • Figure 62: Middle East & Africa Market Value Share and BPS Analysis by Product Type , 2025 and 2035
  • Figure 63: Middle East & Africa Market Y-o-Y Growth Comparison by Product Type , 2025-2035
  • Figure 64: Middle East & Africa Market Attractiveness Analysis by Product Type
  • Figure 65: Middle East & Africa Market Value Share and BPS Analysis by Application, 2025 and 2035
  • Figure 66: Middle East & Africa Market Y-o-Y Growth Comparison by Application, 2025-2035
  • Figure 67: Middle East & Africa Market Attractiveness Analysis by Application
  • Figure 68: Global Market - Tier Structure Analysis
  • Figure 69: Global Market - Company Share Analysis
Dashboard
Dashboard
Dashboard
Dashboard
Dashboard
Dashboard

Our Research Products

Full Research Suite

The "Full Research Suite" delivers actionable market intel, deep dives on markets or technologies, so clients act faster, cut risk, and unlock growth.

Competitor Leaderboard Report

The Leaderboard benchmarks and ranks top vendors, classifying them as Established Leaders, Leading Challengers, or Disruptors & Challengers.

Future Leaders Index

Locates where complements amplify value and substitutes erode it, forecasting net impact by horizon

Market Data & Forecasts

We deliver granular, decision-grade intel: market sizing, 5-year forecasts, pricing, adoption, usage, revenue, and operational KPIs—plus competitor tracking, regulation, and value chains—across 60 countries broadly.

Market Focus Report

Spot the shifts before they hit your P&L. We track inflection points, adoption curves, pricing moves, and ecosystem plays to show where demand is heading, why it is changing, and what to do next across high-growth markets and disruptive tech

Survey Report

Real-time reads of user behavior. We track shifting priorities, perceptions of today’s and next-gen services, and provider experience, then pace how fast tech moves from trial to adoption, blending buyer, consumer, and channel inputs with social signals (#WhySwitch, #UX).

Bespoke Reports

Partner with our analyst team to build a custom report designed around your business priorities. From analysing market trends to assessing competitors or crafting bespoke datasets, we tailor insights to your needs.

Supplier Intelligence

Discovery & Profiling

Capacity & Footprint

Performance & Risk

Compliance & Governance

Commercial Readiness

Who Supplies Whom

Scorecards & Shortlists

Playbooks & Docs

Category Intelligence

Definition & Scope

Demand & Use Cases

Cost Drivers

Market Structure

Supply Chain Map

Trade & Policy

Operating Norms

Deliverables

Buyer Intelligence

Account Basics

Spend & Scope

Procurement Model

Vendor Requirements

Terms & Policies

Entry Strategy

Pain Points & Triggers

Outputs

Pricing Analysis

Benchmarks

Trends

Should-Cost

Indexation

Landed Cost

Commercial Terms

Deliverables

Brand Analysis

Positioning & Value Prop

Share & Presence

Customer Evidence

Go-to-Market

Digital & Reputation

Compliance & Trust

KPIs & Gaps

Outputs

Full Research Suite comprises of:

Market outlook & trends analysis

Market outlook & trends analysis

Interviews & case studies

Interviews & case studies

Strategic recommendations

Strategic recommendations

Vendor profiles & capabilities analysis

Vendor profiles & capabilities analysis

5-year forecasts

5-year forecasts

8 regions and 60+ country-level data splits

8 regions and 60+ country-level data splits

Market segment data splits

Market segment data splits

12 months of continuous data updates

12 months of continuous data updates

DELIVERED AS:

PDF EXCEL ONLINE

Full Research Suite


$5000

$7500

$10000

Buy Report Now
Similar Industry Reports

Similar Industry Reports

Plant-based Iron Supplements Market

Plant-based Iron Supplements Market Growth - Functional Nutrition & Demand 2025 to 2035

Vitamin B12 Ingredient Market

Vitamin B12 Ingredient Market Size and Share Forecast Outlook 2025 to 2035

Vitamin C Ingredients Market

Vitamin C Ingredients Market Size and Share Forecast Outlook 2025 to 2035

Vitamin Biomarkers Market

Vitamin Biomarkers Market Size and Share Forecast Outlook 2025 to 2035

Vitamin E Antioxidant Creams Market

Vitamin E Antioxidant Creams Market Analysis - Size, Share, and Forecast Outlook 2025 to 2035

Vitamin C Serums (Ascorbic Acid) Market

Vitamin C Serums (Ascorbic Acid) Market Analysis - Size and Share Forecast Outlook 2025 to 2035

Vitamin Tonics Market

Vitamin Tonics Market Size and Share Forecast Outlook 2025 to 2035

Vitamin A Market
Vitamin A Market

Vitamin A Market Size and Share Forecast Outlook 2025 to 2035

Vitamin Ingredients Market

Vitamin Ingredients Market Size and Share Forecast Outlook 2025 to 2035

Vitamin Premix Market

Vitamin Premix Market Analysis - Size, Growth, and Forecast 2025 to 2035

Vitamin Patches Market

Vitamin Patches Market - Size, Share, and Forecast Outlook 2025 to 2035

Vitamin Gummies Market

Vitamin Gummies Market Analysis - Size, Share, and Forecast Outlook 2025 to 2035

Vitamin D Ingredients Market

Vitamin D Ingredients Market Size, Growth, and Forecast for 2025 to 2035

Vitamin Yeast Market

Vitamin Yeast Market Analysis by Vitamin Composition, Application, Product Claim andOther Types Through 2035

Vitamin Supplement Market

Vitamin Supplement Market Insights - Wellness & Industry Growth 2025 to 2035

Vitamin D Testing Market

Vitamin D Testing Market Analysis by Component, Type, and Region: Forecast for 2025 to 2035

Vitamin and Mineral Supplement Market

Vitamin and Mineral Supplement Market Insights - Trends & Forecast 2025 to 2035

Vitamin B Test Market

Vitamin B Test Market Insights - Size, Trends & Forecast 2025 to 2035

Vitamin and Mineral Market

Vitamin and Mineral Market – Growth, Innovations & Health Trends

Vitamin Shot Market
Vitamin Shot Market

Vitamin Shot Market – Growth, Demand & Functional Benefits

Future Market Insights

Plant-Based Vitamin D3 Supplements Market

Chat With MaRIA

Chat With

MaRIA

Hi There, I am MaRIA, Your Market Research Intelligence Assistant. How may I help you?