- Global Locations -
Headquarters
Future Market Insights, Inc.
Christiana Corporate, 200 Continental Drive, Suite 401, Newark, Delaware - 19713, United States
T: +1-845-579-5705
Americas
Future Market Insights, Inc.
616 Corporate Way, Suite 2-9018,
Valley Cottage, NY 10989,
United States
T: +1-347-918-3531
MEA
Future Market Insights

1602-6 Jumeirah Bay X2 Tower, Plot No: JLT-PH2-X2A,

Jumeirah Lakes Towers, Dubai,

United Arab Emirates

Europe
Future Market Insights
3rd Floor, 207 Regent Street,
London W1B 3HH
United Kingdom
T: + 44 (0) 20 8123 9659
D: +44 (0) 20 3287 4268
Asia Pacific
Future Market Insights Global & Consulting Pvt. Ltd.
Office No. 401-A, 4th Floor,
VANTAGE 9, S.No. 36/1/1,
Baner, Pune 411045 India

Stem Cell Therapies Market

Stem Cell Therapies Market by Type, Therapeutic Application, Cell Source & Region - Forecast 2022 - 2032

Market Insights on Stem Cell Therapies covering sales outlook, demand forecast and up-to-date key trends

Request Sample

Stem Cell Therapies Market Overview (2022-2032)

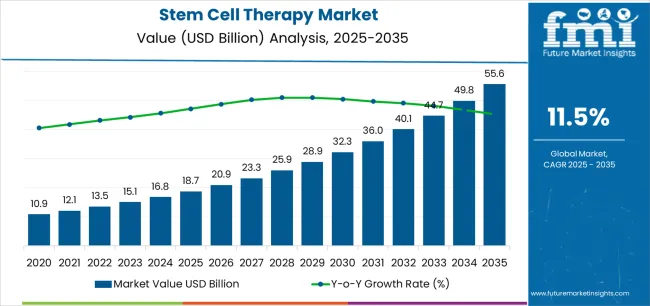
[250 Pages Report] The stem cell therapy market is expected to grow at a CAGR of 16.7% to USD 401 million by 2026, up from USD 187 million in 2021.

Attributes

Details

Stem Cell Therapy Market (CAGR)

  16.7%

Stem Cell Therapy Market  (2026)

USD 401 million

Stem Cell Therapy Market  (2021)

USD 187 million

Factors such as expanding stem cell research activities and increasing approvals of GMP-certified facilities to generate stem cells are driving stem cell therapy market expansion.

In the next years, the growing need for iPSCs as an alternative to ESCs, as well as the expanding demand for cell and gene treatments, are projected to promote the expansion of the stem cell therapy market.

What has been the Impact of COVID-19 on Stem Cell Therapy Market?

On March 11, 2020, the World Health Organization (WHO) proclaimed COVID-19 a pandemic. To combat the epidemic, researchers have been developing novel cures and treatments. Stem cells have been shown to be a successful treatment for pulmonary illnesses, especially COVID-19, in recent years.

At least 10 projects have been registered in the official international registry for clinical trials, implicating the use of mesenchymal stem cells to patients with coronavirus pneumonia hence increasing the demand for stem cell therapy and sales of stem cell therapy.

Don't pay for what you don't need

Customize your report by selecting specific countries or regions and save 30%!

What are the Drivers Contributing to the Growth of the Stem Cell Therapy Market?

The demand for innovative and better medicines to treat autoimmune, neurological, and cardiovascular disorders has led to a surge in demand for stem cell therapy and sales of stem cell therapy and research activity and funding for cell-based research.

Ethical considerations about embryonic stem cells are a source of restraint for the stem cell therapy market.

As stem cells are obtained by killing a human embryo, several ethical concerns are involved with the demand for stem cell therapy. A human embryo is seen as potential life, and eliminating them is considered immoral even if it can save a human life. Concerns about using embryonic stem cells to produce stem cell therapies limit stem cell therapy market expansion and the sales of stem cell therapy.

What are the Future Opportunities of the Stem Cell Therapy Market?

Adult stem cells that have been genetically reprogrammed to resemble embryonic stem cells are known as induced pluripotent stem cells (iPSCs). iPSCs are becoming a viable alternative to ESCs for the stem cell therapy market.

ESCs are involved with socio-ethical concerns and legislation about contraception, abortion, and in vitro fertilization since they are derived from early-stage embryos. The use of iPSCs avoids using human embryos, eliminating social and ethical concerns surging the demand for stem cell therapy with increased sales of stem cell therapy.

Sabyasachi Ghosh
Sabyasachi Ghosh
Principal Consultant
LinkedIn
Talk to Analyst

Find your sweet spots for generating winning opportunities in this market.

What is the Regional Outlook of Stem Cell Therapy Market?

North America, Asia Pacific, and Europe accounted for the highest proportion of the stem cell therapy market.

This geographical segment's substantial proportion of the stem cell therapy market is largely due to the increased public-private financing and research grants for producing safe and effective stem cell treatment products, as well as the expanding number of clinical trials, can be ascribed to North America's major part of the stem cell therapy market with increased sales of stem cell therapy.

How is the Stem Cell Therapy Market Segmented based on Type?

Allogeneic stem cell treatment had the prominent demand for stem cell therapy and sales of stem cell therapy.

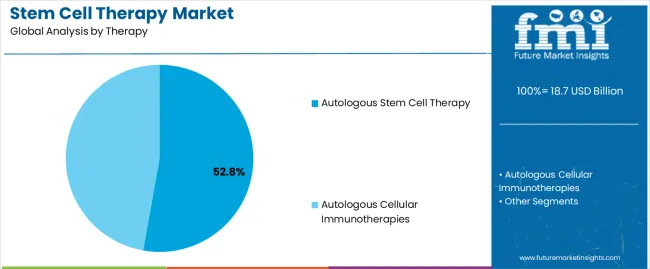
The stem cell therapy market is divided into two types, i.e., allogeneic stem cell therapy and autologous stem cell therapy. The allogeneic category held the most significant proportion for demand for stem cell therapy in the stem cell therapy market.

The simplicity of manufacturing and production methods, as well as the increased availability of innovative stem cell products across critical countries, are contributing to the allogeneic segment's rise in the stem cell therapy market.

Get the data you need at a Fraction of the cost

Personalize your report by choosing insights you need
and save 40%!

How is the Stem Cell Therapy Market Segmented on the basis of Therapeutic Application?

During the predicted period, the sector of inflammatory and autoimmune illnesses will have the highest sales of stem cell therapy.

The stem cell therapy market is divided into musculoskeletal disorders, wounds and injuries, cardiovascular illnesses, surgeries, inflammatory and autoimmune diseases, neurological disorders, and other therapeutic applications based on therapeutic.

Due to the rising frequency of neurological illnesses and the high cost of therapy, the sales of stem cell therapy and demand for stem cell therapy neurological disorders category are predicted to increase at the fastest CAGR over the forecast period.

How is the Stem Cell Therapy Market Segmented on the basis of End Use?

Hospitals and research institutes are partnering to improve treatment options, therefore, escalat6ing demand for stem cell therapy along with sales of stem cell therapy.

The end-use category of hospitals is expected to grow by roughly 10.6% through 2027.

The stem cell therapy market is growing because of a growing demand for stem cell therapy and sales of stem cell therapy in hospitals to minimize difficulties caused by intrusive approaches such as surgical procedures.

Hospitals are associated with research facilities and academic institutes that do considerable research to develop novel stem cell therapy. Collaborations with research institutions enable hospitals to improve their treatment options and, as a result, have a favorable impact on stem cell therapy market statistics.

Who are the Key Market Players of the Stem Cell Therapy Market?

Key players in the stem cell therapy market include Smith & Nephew (UK, MEDIPOST Co., Ltd. (South Korea), Anterogen Co., Ltd. (South Korea), PHARMICELL Co., Ltd. (South Korea), JCR Pharmaceuticals Co., Ltd. (Japan), and NuVasive, Inc. (US).

In March 2021, Novadip Biosciences received approval from U.S. FDA for the Company's Investigational New Drug (IND) application for its autologous cell therapy product NVD-003. The product is used to treat Congenital Pseudarthrosis of the Tibia (CPT).

This strategy is likely to enhance its product offerings and expand its customer base as well as sales of stem cell therapy and demand for stem cell therapy, thereby strengthening its position in the stem cell therapy market.

In August 2020, Cipla and Stempeutics collaborated to launch Stempucel cell therapy to treat critical limb ischemia to grab the largest stem cell therapy market share.

Scope Of Report

Report Attribute

Details

Growth rate

CAGR of 16.7% from 2022 to 2032

Base year for estimation

2021

Historical data

2015 – 2020

Forecast period

2022 – 2032

Quantitative units

Revenue in USD million, volume in kilotons, and CAGR from 2022 to 2032

Report coverage

Revenue forecast, volume forecast, company ranking, competitive landscape, growth factors, and trends, Pricing Analysis,

Segments covered

Type, application, cell source, region

Regional scope

North America; Western Europe, Eastern Europe, Middle East, Africa, ASEAN, South Asia, Rest of Asia, Australia and New Zealand

Country scope

U.S.; Canada; Mexico; Germany; U.K.; France; Italy; Spain; Russia; Belgium; Poland; Czech Republic; China; India; Japan; Australia; Brazil; Argentina; Colombia; Saudi Arabia; UAE; Iran; South Africa

Key companies profiled

Smith & Nephew (UK), MEDIPOST Co., Ltd. (South Korea), Anterogen Co., Ltd. (South Korea), PHARMICELL Co., Ltd. (South Korea), JCR Pharmaceuticals Co., Ltd. (Japan), and NuVasive, Inc. (US)

Customization scope

Free report customization (equivalent to up to 8 analysts working days) with purchase. Addition or alteration to country, regional & segment scope.

Pricing and purchase options

Avail customized purchase options to meet your exact research needs.

Key Segments

By Type:

  • Allogeneic
  • Autologous

By Therapeutic Application:

  • Musculoskeletal
  • Wound & Injury
  • CVD
  • Autoimmune & Inflammatory

By Cell Source:

  • Adipose tissue
  • Bone Marrow
  • Placenta/Umbilical Cord

By Region:

  • North America
  • Latin America
  • Asia Pacific
  • MEA
  • Europe

Frequently Asked Questions

North America stem cell therapy market valued at USD 3.7 billion in 2020 and is forecast to expand at 10.3% CAGR.

The end-use category of hospitals is expected to grow by roughly 10.6% with escalated demand for stem cell therapy

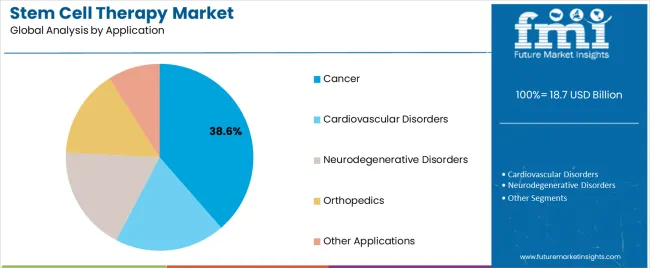
Oncology segment accounted for about 37.1% of the stem cell therapy market share.

Autologous segment in stem cell therapy market is projected to grow with a stem cell therapy market share of around 10.5%.

Table of Content

1. Executive Summary

    1.1. Global Market Outlook

    1.2. Demand-side Trends

    1.3. Supply-side Trends

    1.4. Technology Roadmap Analysis

    1.5. Analysis and Recommendations

2. Market Overview

    2.1. Market Coverage / Taxonomy

    2.2. Market Definition / Scope / Limitations

3. Market Background

    3.1. Market Dynamics

        3.1.1. Drivers

        3.1.2. Restraints

        3.1.3. Opportunity

        3.1.4. Trends

    3.2. Scenario Forecast

        3.2.1. Demand in Optimistic Scenario

        3.2.2. Demand in Likely Scenario

        3.2.3. Demand in Conservative Scenario

    3.3. Opportunity Map Analysis

    3.4. Investment Feasibility Matrix

    3.5. PESTLE and Porter’s Analysis

    3.6. Regulatory Landscape

        3.6.1. By Key Regions

        3.6.2. By Key Countries

    3.7. Regional Parent Market Outlook

4. Global Market Analysis 2017-2021 and Forecast, 2022-2032

    4.1. Historical Market Size Value (US$ Mn) Analysis, 2017-2021

    4.2. Current and Future Market Size Value (US$ Mn) Projections, 2022-2032

        4.2.1. Y-o-Y Growth Trend Analysis

        4.2.2. Absolute $ Opportunity Analysis

5. Global Market Analysis 2017-2021 and Forecast 2022-2032, By Therapy Type

    5.1. Introduction / Key Findings

    5.2. Historical Market Size Value (US$ Mn) Analysis By Therapy Type, 2017-2021

    5.3. Current and Future Market Size Value (US$ Mn) Analysis and Forecast By Therapy Type, 2022-2032

        5.3.1. Allogeneic Therapy

        5.3.2. Autologous Therapy

    5.4. Y-o-Y Growth Trend Analysis By Therapy Type, 2017-2021

    5.5. Absolute $ Opportunity Analysis By Therapy Type, 2022-2032

Deep-dive segmentation will be available in the sample on request

6. Global Market Analysis 2017-2021 and Forecast 2022-2032, By Indication

    6.1. Introduction / Key Findings

    6.2. Historical Market Size Value (US$ Mn) Analysis By Indication, 2017-2021

    6.3. Current and Future Market Size Value (US$ Mn) Analysis and Forecast By Indication, 2022-2032

        6.3.1. Autoimmune Diseases

        6.3.2. Musculoskeletal Disorders

        6.3.3. Acute Graft Host Disease

        6.3.4. Trauma Injuries

        6.3.5. Others

    6.4. Y-o-Y Growth Trend Analysis By Indication, 2017-2021

    6.5. Absolute $ Opportunity Analysis By Indication, 2022-2032

Deep-dive segmentation will be available in the sample on request

7. Global Market Analysis 2017-2021 and Forecast 2022-2032, By End User

    7.1. Introduction / Key Findings

    7.2. Historical Market Size Value (US$ Mn) Analysis By End User, 2017-2021

    7.3. Current and Future Market Size Value (US$ Mn) Analysis and Forecast By End User, 2022-2032

        7.3.1. Hospitals

        7.3.2. Acute Care Facilities

        7.3.3. Specialized Clinics

    7.4. Y-o-Y Growth Trend Analysis By End User, 2017-2021

    7.5. Absolute $ Opportunity Analysis By End User, 2022-2032

Deep-dive segmentation will be available in the sample on request

8. Global Market Analysis 2017-2021 and Forecast 2022-2032, By Stem Cell Type

    8.1. Introduction / Key Findings

    8.2. Historical Market Size Value (US$ Mn) Analysis By Stem Cell Type, 2017-2021

    8.3. Current and Future Market Size Value (US$ Mn) Analysis and Forecast By Stem Cell Type, 2022-2032

        8.3.1. Embryonic Stem Cells

        8.3.2. Tissue-specific Stem Cells

        8.3.3. Mesenchymal Stem Cells

        8.3.4. Induced Pluripotent Stem Cells

    8.4. Y-o-Y Growth Trend Analysis By Stem Cell Type, 2017-2021

    8.5. Absolute $ Opportunity Analysis By Stem Cell Type, 2022-2032

Deep-dive segmentation will be available in the sample on request

9. Global Market Analysis 2017-2021 and Forecast 2022-2032, By Region

    9.1. Introduction

    9.2. Historical Market Size Value (US$ Mn) Analysis By Region, 2017-2021

    9.3. Current Market Size Value (US$ Mn) Analysis and Forecast By Region, 2022-2032

        9.3.1. North America

        9.3.2. Latin America

        9.3.3. Europe

        9.3.4. East Asia

        9.3.5. South Asia & Pacific

        9.3.6. MEA

    9.4. Market Attractiveness Analysis By Region

10. North America Market Analysis 2017-2021 and Forecast 2022-2032, By Country

    10.1. Historical Market Size Value (US$ Mn) Trend Analysis By Market Taxonomy, 2017-2021

    10.2. Market Size Value (US$ Mn) Forecast By Market Taxonomy, 2022-2032

        10.2.1. By Country

            10.2.1.1. U.K.

            10.2.1.2. Canada

        10.2.2. By Therapy Type

        10.2.3. By Indication

        10.2.4. By End User

        10.2.5. By Stem Cell Type

    10.3. Market Attractiveness Analysis

        10.3.1. By Country

        10.3.2. By Therapy Type

        10.3.3. By Indication

        10.3.4. By End User

        10.3.5. By Stem Cell Type

    10.4. Key Takeaways

11. Latin America Market Analysis 2017-2021 and Forecast 2022-2032, By Country

    11.1. Historical Market Size Value (US$ Mn) Trend Analysis By Market Taxonomy, 2017-2021

    11.2. Market Size Value (US$ Mn) Forecast By Market Taxonomy, 2022-2032

        11.2.1. By Country

            11.2.1.1. Brazil

            11.2.1.2. Mexico

            11.2.1.3. Rest of Latin America

        11.2.2. By Therapy Type

        11.2.3. By Indication

        11.2.4. By End User

        11.2.5. By Stem Cell Type

    11.3. Market Attractiveness Analysis

        11.3.1. By Country

        11.3.2. By Therapy Type

        11.3.3. By Indication

        11.3.4. By End User

        11.3.5. By Stem Cell Type

    11.4. Key Takeaways

12. Europe Market Analysis 2017-2021 and Forecast 2022-2032, By Country

    12.1. Historical Market Size Value (US$ Mn) Trend Analysis By Market Taxonomy, 2017-2021

    12.2. Market Size Value (US$ Mn) Forecast By Market Taxonomy, 2022-2032

        12.2.1. By Country

            12.2.1.1. Germany

            12.2.1.2. U.K.

            12.2.1.3. France

            12.2.1.4. Spain

            12.2.1.5. Italy

            12.2.1.6. Rest of Europe

        12.2.2. By Therapy Type

        12.2.3. By Indication

        12.2.4. By End User

        12.2.5. By Stem Cell Type

    12.3. Market Attractiveness Analysis

        12.3.1. By Country

        12.3.2. By Therapy Type

        12.3.3. By Indication

        12.3.4. By End User

        12.3.5. By Stem Cell Type

    12.4. Key Takeaways

13. East Asia Market Analysis 2017-2021 and Forecast 2022-2032, By Country

    13.1. Historical Market Size Value (US$ Mn) Trend Analysis By Market Taxonomy, 2017-2021

    13.2. Market Size Value (US$ Mn) Forecast By Market Taxonomy, 2022-2032

        13.2.1. By Country

            13.2.1.1. China

            13.2.1.2. Japan

            13.2.1.3. South Korea

        13.2.2. By Therapy Type

        13.2.3. By Indication

        13.2.4. By End User

        13.2.5. By Stem Cell Type

    13.3. Market Attractiveness Analysis

        13.3.1. By Country

        13.3.2. By Therapy Type

        13.3.3. By Indication

        13.3.4. By End User

        13.3.5. By Stem Cell Type

    13.4. Key Takeaways

14. South Asia & Pacific Market Analysis 2017-2021 and Forecast 2022-2032, By Country

    14.1. Historical Market Size Value (US$ Mn) Trend Analysis By Market Taxonomy, 2017-2021

    14.2. Market Size Value (US$ Mn) Forecast By Market Taxonomy, 2022-2032

        14.2.1. By Country

            14.2.1.1. India

            14.2.1.2. Thailand

            14.2.1.3. Indonesia

            14.2.1.4. Malaysia

            14.2.1.5. Singapore

            14.2.1.6. Australia

            14.2.1.7. New Zealand

            14.2.1.8. Rest of South Asia & Pacific

        14.2.2. By Therapy Type

        14.2.3. By Indication

        14.2.4. By End User

        14.2.5. By Stem Cell Type

    14.3. Market Attractiveness Analysis

        14.3.1. By Country

        14.3.2. By Therapy Type

        14.3.3. By Indication

        14.3.4. By End User

        14.3.5. By Stem Cell Type

    14.4. Key Takeaways

15. MEA Market Analysis 2017-2021 and Forecast 2022-2032, By Country

    15.1. Historical Market Size Value (US$ Mn) Trend Analysis By Market Taxonomy, 2017-2021

    15.2. Market Size Value (US$ Mn) Forecast By Market Taxonomy, 2022-2032

        15.2.1. By Country

            15.2.1.1. GCC Countries

            15.2.1.2. South Africa

            15.2.1.3. Israel

            15.2.1.4. Rest of MEA

        15.2.2. By Therapy Type

        15.2.3. By Indication

        15.2.4. By End User

        15.2.5. By Stem Cell Type

    15.3. Market Attractiveness Analysis

        15.3.1. By Country

        15.3.2. By Therapy Type

        15.3.3. By Indication

        15.3.4. By End User

        15.3.5. By Stem Cell Type

    15.4. Key Takeaways

16. Key Countries Market Analysis

    16.1. U.K.

        16.1.1. Pricing Analysis

        16.1.2. Market Share Analysis, 2021

            16.1.2.1. By Therapy Type

            16.1.2.2. By Indication

            16.1.2.3. By End User

            16.1.2.4. By Stem Cell Type

    16.2. Canada

        16.2.1. Pricing Analysis

        16.2.2. Market Share Analysis, 2021

            16.2.2.1. By Therapy Type

            16.2.2.2. By Indication

            16.2.2.3. By End User

            16.2.2.4. By Stem Cell Type

    16.3. Brazil

        16.3.1. Pricing Analysis

        16.3.2. Market Share Analysis, 2021

            16.3.2.1. By Therapy Type

            16.3.2.2. By Indication

            16.3.2.3. By End User

            16.3.2.4. By Stem Cell Type

    16.4. Mexico

        16.4.1. Pricing Analysis

        16.4.2. Market Share Analysis, 2021

            16.4.2.1. By Therapy Type

            16.4.2.2. By Indication

            16.4.2.3. By End User

            16.4.2.4. By Stem Cell Type

    16.5. Germany

        16.5.1. Pricing Analysis

        16.5.2. Market Share Analysis, 2021

            16.5.2.1. By Therapy Type

            16.5.2.2. By Indication

            16.5.2.3. By End User

            16.5.2.4. By Stem Cell Type

    16.6. U.K.

        16.6.1. Pricing Analysis

        16.6.2. Market Share Analysis, 2021

            16.6.2.1. By Therapy Type

            16.6.2.2. By Indication

            16.6.2.3. By End User

            16.6.2.4. By Stem Cell Type

    16.7. France

        16.7.1. Pricing Analysis

        16.7.2. Market Share Analysis, 2021

            16.7.2.1. By Therapy Type

            16.7.2.2. By Indication

            16.7.2.3. By End User

            16.7.2.4. By Stem Cell Type

    16.8. Spain

        16.8.1. Pricing Analysis

        16.8.2. Market Share Analysis, 2021

            16.8.2.1. By Therapy Type

            16.8.2.2. By Indication

            16.8.2.3. By End User

            16.8.2.4. By Stem Cell Type

    16.9. Italy

        16.9.1. Pricing Analysis

        16.9.2. Market Share Analysis, 2021

            16.9.2.1. By Therapy Type

            16.9.2.2. By Indication

            16.9.2.3. By End User

            16.9.2.4. By Stem Cell Type

    16.10. China

        16.10.1. Pricing Analysis

        16.10.2. Market Share Analysis, 2021

            16.10.2.1. By Therapy Type

            16.10.2.2. By Indication

            16.10.2.3. By End User

            16.10.2.4. By Stem Cell Type

    16.11. Japan

        16.11.1. Pricing Analysis

        16.11.2. Market Share Analysis, 2021

            16.11.2.1. By Therapy Type

            16.11.2.2. By Indication

            16.11.2.3. By End User

            16.11.2.4. By Stem Cell Type

    16.12. South Korea

        16.12.1. Pricing Analysis

        16.12.2. Market Share Analysis, 2021

            16.12.2.1. By Therapy Type

            16.12.2.2. By Indication

            16.12.2.3. By End User

            16.12.2.4. By Stem Cell Type

    16.13. India

        16.13.1. Pricing Analysis

        16.13.2. Market Share Analysis, 2021

            16.13.2.1. By Therapy Type

            16.13.2.2. By Indication

            16.13.2.3. By End User

            16.13.2.4. By Stem Cell Type

    16.14. Thailand

        16.14.1. Pricing Analysis

        16.14.2. Market Share Analysis, 2021

            16.14.2.1. By Therapy Type

            16.14.2.2. By Indication

            16.14.2.3. By End User

            16.14.2.4. By Stem Cell Type

    16.15. Indonesia

        16.15.1. Pricing Analysis

        16.15.2. Market Share Analysis, 2021

            16.15.2.1. By Therapy Type

            16.15.2.2. By Indication

            16.15.2.3. By End User

            16.15.2.4. By Stem Cell Type

    16.16. Malaysia

        16.16.1. Pricing Analysis

        16.16.2. Market Share Analysis, 2021

            16.16.2.1. By Therapy Type

            16.16.2.2. By Indication

            16.16.2.3. By End User

            16.16.2.4. By Stem Cell Type

    16.17. Singapore

        16.17.1. Pricing Analysis

        16.17.2. Market Share Analysis, 2021

            16.17.2.1. By Therapy Type

            16.17.2.2. By Indication

            16.17.2.3. By End User

            16.17.2.4. By Stem Cell Type

    16.18. Australia

        16.18.1. Pricing Analysis

        16.18.2. Market Share Analysis, 2021

            16.18.2.1. By Therapy Type

            16.18.2.2. By Indication

            16.18.2.3. By End User

            16.18.2.4. By Stem Cell Type

    16.19. New Zealand

        16.19.1. Pricing Analysis

        16.19.2. Market Share Analysis, 2021

            16.19.2.1. By Therapy Type

            16.19.2.2. By Indication

            16.19.2.3. By End User

            16.19.2.4. By Stem Cell Type

    16.20. GCC Countries

        16.20.1. Pricing Analysis

        16.20.2. Market Share Analysis, 2021

            16.20.2.1. By Therapy Type

            16.20.2.2. By Indication

            16.20.2.3. By End User

            16.20.2.4. By Stem Cell Type

    16.21. South Africa

        16.21.1. Pricing Analysis

        16.21.2. Market Share Analysis, 2021

            16.21.2.1. By Therapy Type

            16.21.2.2. By Indication

            16.21.2.3. By End User

            16.21.2.4. By Stem Cell Type

    16.22. Israel

        16.22.1. Pricing Analysis

        16.22.2. Market Share Analysis, 2021

            16.22.2.1. By Therapy Type

            16.22.2.2. By Indication

            16.22.2.3. By End User

            16.22.2.4. By Stem Cell Type

17. Market Structure Analysis

    17.1. Competition Dashboard

    17.2. Competition Benchmarking

    17.3. Market Share Analysis of Top Players

        17.3.1. By Regional

        17.3.2. By Therapy Type

        17.3.3. By Indication

        17.3.4. By End User

        17.3.5. By Stem Cell Type

18. Competition Analysis

    18.1. Competition Deep Dive

        18.1.1. Vericel Corporation

            18.1.1.1. Overview

            18.1.1.2. Product Portfolio

            18.1.1.3. Profitability by Market Segments

            18.1.1.4. Sales Footprint

            18.1.1.5. Strategy Overview

                18.1.1.5.1. Marketing Strategy

        18.1.2. Cyagen Biosciences, Inc.

            18.1.2.1. Overview

            18.1.2.2. Product Portfolio

            18.1.2.3. Profitability by Market Segments

            18.1.2.4. Sales Footprint

            18.1.2.5. Strategy Overview

                18.1.2.5.1. Marketing Strategy

        18.1.3. Stemcell Technologies Inc.

            18.1.3.1. Overview

            18.1.3.2. Product Portfolio

            18.1.3.3. Profitability by Market Segments

            18.1.3.4. Sales Footprint

            18.1.3.5. Strategy Overview

                18.1.3.5.1. Marketing Strategy

        18.1.4. Celegene Corporation

            18.1.4.1. Overview

            18.1.4.2. Product Portfolio

            18.1.4.3. Profitability by Market Segments

            18.1.4.4. Sales Footprint

            18.1.4.5. Strategy Overview

                18.1.4.5.1. Marketing Strategy

        18.1.5. Cellular Dynamics International

            18.1.5.1. Overview

            18.1.5.2. Product Portfolio

            18.1.5.3. Profitability by Market Segments

            18.1.5.4. Sales Footprint

            18.1.5.5. Strategy Overview

                18.1.5.5.1. Marketing Strategy

        18.1.6. Cytori Therapeutics, Inc.

            18.1.6.1. Overview

            18.1.6.2. Product Portfolio

            18.1.6.3. Profitability by Market Segments

            18.1.6.4. Sales Footprint

            18.1.6.5. Strategy Overview

                18.1.6.5.1. Marketing Strategy

        18.1.7. Fibrocell Science, Inc.

            18.1.7.1. Overview

            18.1.7.2. Product Portfolio

            18.1.7.3. Profitability by Market Segments

            18.1.7.4. Sales Footprint

            18.1.7.5. Strategy Overview

                18.1.7.5.1. Marketing Strategy

        18.1.8. Mesoblast Ltd

            18.1.8.1. Overview

            18.1.8.2. Product Portfolio

            18.1.8.3. Profitability by Market Segments

            18.1.8.4. Sales Footprint

            18.1.8.5. Strategy Overview

                18.1.8.5.1. Marketing Strategy

        18.1.9. Regeneus Ltd

            18.1.9.1. Overview

            18.1.9.2. Product Portfolio

            18.1.9.3. Profitability by Market Segments

            18.1.9.4. Sales Footprint

            18.1.9.5. Strategy Overview

                18.1.9.5.1. Marketing Strategy

        18.1.10. EMD Millipore Corporation

            18.1.10.1. Overview

            18.1.10.2. Product Portfolio

            18.1.10.3. Profitability by Market Segments

            18.1.10.4. Sales Footprint

            18.1.10.5. Strategy Overview

                18.1.10.5.1. Marketing Strategy

        18.1.11. ReNeuron Group plc

            18.1.11.1. Overview

            18.1.11.2. Product Portfolio

            18.1.11.3. Profitability by Market Segments

            18.1.11.4. Sales Footprint

            18.1.11.5. Strategy Overview

                18.1.11.5.1. Marketing Strategy

        18.1.12. International Stem Cell Corporation

            18.1.12.1. Overview

            18.1.12.2. Product Portfolio

            18.1.12.3. Profitability by Market Segments

            18.1.12.4. Sales Footprint

            18.1.12.5. Strategy Overview

                18.1.12.5.1. Marketing Strategy

19. Assumptions & Acronyms Used

20. Research Methodology

Don't pay for what you don't need

Customize your report by selecting specific countries or regions and save 30%!

List of Tables

Table 1: Global Market Value (US$ Mn) Forecast by Region, 2017-2032

Table 2: Global Market Value (US$ Mn) Forecast by Therapy Type, 2017-2032

Table 3: Global Market Value (US$ Mn) Forecast by Indication, 2017-2032

Table 4: Global Market Value (US$ Mn) Forecast by End User, 2017-2032

Table 5: Global Market Value (US$ Mn) Forecast by Stem Cell Type, 2017-2032

Table 6: North America Market Value (US$ Mn) Forecast by Country, 2017-2032

Table 7: North America Market Value (US$ Mn) Forecast by Therapy Type, 2017-2032

Table 8: North America Market Value (US$ Mn) Forecast by Indication, 2017-2032

Table 9: North America Market Value (US$ Mn) Forecast by End User, 2017-2032

Table 10: North America Market Value (US$ Mn) Forecast by Stem Cell Type, 2017-2032

Table 11: Latin America Market Value (US$ Mn) Forecast by Country, 2017-2032

Table 12: Latin America Market Value (US$ Mn) Forecast by Therapy Type, 2017-2032

Table 13: Latin America Market Value (US$ Mn) Forecast by Indication, 2017-2032

Table 14: Latin America Market Value (US$ Mn) Forecast by End User, 2017-2032

Table 15: Latin America Market Value (US$ Mn) Forecast by Stem Cell Type, 2017-2032

Table 16: Europe Market Value (US$ Mn) Forecast by Country, 2017-2032

Table 17: Europe Market Value (US$ Mn) Forecast by Therapy Type, 2017-2032

Table 18: Europe Market Value (US$ Mn) Forecast by Indication, 2017-2032

Table 19: Europe Market Value (US$ Mn) Forecast by End User, 2017-2032

Table 20: Europe Market Value (US$ Mn) Forecast by Stem Cell Type, 2017-2032

Table 21: East Asia Market Value (US$ Mn) Forecast by Country, 2017-2032

Table 22: East Asia Market Value (US$ Mn) Forecast by Therapy Type, 2017-2032

Table 23: East Asia Market Value (US$ Mn) Forecast by Indication, 2017-2032

Table 24: East Asia Market Value (US$ Mn) Forecast by End User, 2017-2032

Table 25: East Asia Market Value (US$ Mn) Forecast by Stem Cell Type, 2017-2032

Table 26: South Asia & Pacific Market Value (US$ Mn) Forecast by Country, 2017-2032

Table 27: South Asia & Pacific Market Value (US$ Mn) Forecast by Therapy Type, 2017-2032

Table 28: South Asia & Pacific Market Value (US$ Mn) Forecast by Indication, 2017-2032

Table 29: South Asia & Pacific Market Value (US$ Mn) Forecast by End User, 2017-2032

Table 30: South Asia & Pacific Market Value (US$ Mn) Forecast by Stem Cell Type, 2017-2032

Table 31: MEA Market Value (US$ Mn) Forecast by Country, 2017-2032

Table 32: MEA Market Value (US$ Mn) Forecast by Therapy Type, 2017-2032

Table 33: MEA Market Value (US$ Mn) Forecast by Indication, 2017-2032

Table 34: MEA Market Value (US$ Mn) Forecast by End User, 2017-2032

Table 35: MEA Market Value (US$ Mn) Forecast by Stem Cell Type, 2017-2032
Sabyasachi Ghosh
Sabyasachi Ghosh
Principal Consultant
LinkedIn
Talk to Analyst

Find your sweet spots for generating winning opportunities in this market.

List of Charts

Figure 1: Global Market Value (US$ Mn) by Therapy Type, 2022-2032

Figure 2: Global Market Value (US$ Mn) by Indication, 2022-2032

Figure 3: Global Market Value (US$ Mn) by End User, 2022-2032

Figure 4: Global Market Value (US$ Mn) by Stem Cell Type, 2022-2032

Figure 5: Global Market Value (US$ Mn) by Region, 2022-2032

Figure 6: Global Market Value (US$ Mn) Analysis by Region, 2017-2032

Figure 7: Global Market Value Share (%) and BPS Analysis by Region, 2022-2032

Figure 8: Global Market Y-o-Y Growth (%) Projections by Region, 2022-2032

Figure 9: Global Market Value (US$ Mn) Analysis by Therapy Type, 2017-2032

Figure 10: Global Market Value Share (%) and BPS Analysis by Therapy Type, 2022-2032

Figure 11: Global Market Y-o-Y Growth (%) Projections by Therapy Type, 2022-2032

Figure 12: Global Market Value (US$ Mn) Analysis by Indication, 2017-2032

Figure 13: Global Market Value Share (%) and BPS Analysis by Indication, 2022-2032

Figure 14: Global Market Y-o-Y Growth (%) Projections by Indication, 2022-2032

Figure 15: Global Market Value (US$ Mn) Analysis by End User, 2017-2032

Figure 16: Global Market Value Share (%) and BPS Analysis by End User, 2022-2032

Figure 17: Global Market Y-o-Y Growth (%) Projections by End User, 2022-2032

Figure 18: Global Market Value (US$ Mn) Analysis by Stem Cell Type, 2017-2032

Figure 19: Global Market Value Share (%) and BPS Analysis by Stem Cell Type, 2022-2032

Figure 20: Global Market Y-o-Y Growth (%) Projections by Stem Cell Type, 2022-2032

Figure 21: Global Market Attractiveness by Therapy Type, 2022-2032

Figure 22: Global Market Attractiveness by Indication, 2022-2032

Figure 23: Global Market Attractiveness by End User, 2022-2032

Figure 24: Global Market Attractiveness by Stem Cell Type, 2022-2032

Figure 25: Global Market Attractiveness by Region, 2022-2032

Figure 26: North America Market Value (US$ Mn) by Therapy Type, 2022-2032

Figure 27: North America Market Value (US$ Mn) by Indication, 2022-2032

Figure 28: North America Market Value (US$ Mn) by End User, 2022-2032

Figure 29: North America Market Value (US$ Mn) by Stem Cell Type, 2022-2032

Figure 30: North America Market Value (US$ Mn) by Country, 2022-2032

Figure 31: North America Market Value (US$ Mn) Analysis by Country, 2017-2032

Figure 32: North America Market Value Share (%) and BPS Analysis by Country, 2022-2032

Figure 33: North America Market Y-o-Y Growth (%) Projections by Country, 2022-2032

Figure 34: North America Market Value (US$ Mn) Analysis by Therapy Type, 2017-2032

Figure 35: North America Market Value Share (%) and BPS Analysis by Therapy Type, 2022-2032

Figure 36: North America Market Y-o-Y Growth (%) Projections by Therapy Type, 2022-2032

Figure 37: North America Market Value (US$ Mn) Analysis by Indication, 2017-2032

Figure 38: North America Market Value Share (%) and BPS Analysis by Indication, 2022-2032

Figure 39: North America Market Y-o-Y Growth (%) Projections by Indication, 2022-2032

Figure 40: North America Market Value (US$ Mn) Analysis by End User, 2017-2032

Figure 41: North America Market Value Share (%) and BPS Analysis by End User, 2022-2032

Figure 42: North America Market Y-o-Y Growth (%) Projections by End User, 2022-2032

Figure 43: North America Market Value (US$ Mn) Analysis by Stem Cell Type, 2017-2032

Figure 44: North America Market Value Share (%) and BPS Analysis by Stem Cell Type, 2022-2032

Figure 45: North America Market Y-o-Y Growth (%) Projections by Stem Cell Type, 2022-2032

Figure 46: North America Market Attractiveness by Therapy Type, 2022-2032

Figure 47: North America Market Attractiveness by Indication, 2022-2032

Figure 48: North America Market Attractiveness by End User, 2022-2032

Figure 49: North America Market Attractiveness by Stem Cell Type, 2022-2032

Figure 50: North America Market Attractiveness by Country, 2022-2032

Figure 51: Latin America Market Value (US$ Mn) by Therapy Type, 2022-2032

Figure 52: Latin America Market Value (US$ Mn) by Indication, 2022-2032

Figure 53: Latin America Market Value (US$ Mn) by End User, 2022-2032

Figure 54: Latin America Market Value (US$ Mn) by Stem Cell Type, 2022-2032

Figure 55: Latin America Market Value (US$ Mn) by Country, 2022-2032

Figure 56: Latin America Market Value (US$ Mn) Analysis by Country, 2017-2032

Figure 57: Latin America Market Value Share (%) and BPS Analysis by Country, 2022-2032

Figure 58: Latin America Market Y-o-Y Growth (%) Projections by Country, 2022-2032

Figure 59: Latin America Market Value (US$ Mn) Analysis by Therapy Type, 2017-2032

Figure 60: Latin America Market Value Share (%) and BPS Analysis by Therapy Type, 2022-2032

Figure 61: Latin America Market Y-o-Y Growth (%) Projections by Therapy Type, 2022-2032

Figure 62: Latin America Market Value (US$ Mn) Analysis by Indication, 2017-2032

Figure 63: Latin America Market Value Share (%) and BPS Analysis by Indication, 2022-2032

Figure 64: Latin America Market Y-o-Y Growth (%) Projections by Indication, 2022-2032

Figure 65: Latin America Market Value (US$ Mn) Analysis by End User, 2017-2032

Figure 66: Latin America Market Value Share (%) and BPS Analysis by End User, 2022-2032

Figure 67: Latin America Market Y-o-Y Growth (%) Projections by End User, 2022-2032

Figure 68: Latin America Market Value (US$ Mn) Analysis by Stem Cell Type, 2017-2032

Figure 69: Latin America Market Value Share (%) and BPS Analysis by Stem Cell Type, 2022-2032

Figure 70: Latin America Market Y-o-Y Growth (%) Projections by Stem Cell Type, 2022-2032

Figure 71: Latin America Market Attractiveness by Therapy Type, 2022-2032

Figure 72: Latin America Market Attractiveness by Indication, 2022-2032

Figure 73: Latin America Market Attractiveness by End User, 2022-2032

Figure 74: Latin America Market Attractiveness by Stem Cell Type, 2022-2032

Figure 75: Latin America Market Attractiveness by Country, 2022-2032

Figure 76: Europe Market Value (US$ Mn) by Therapy Type, 2022-2032

Figure 77: Europe Market Value (US$ Mn) by Indication, 2022-2032

Figure 78: Europe Market Value (US$ Mn) by End User, 2022-2032

Figure 79: Europe Market Value (US$ Mn) by Stem Cell Type, 2022-2032

Figure 80: Europe Market Value (US$ Mn) by Country, 2022-2032

Figure 81: Europe Market Value (US$ Mn) Analysis by Country, 2017-2032

Figure 82: Europe Market Value Share (%) and BPS Analysis by Country, 2022-2032

Figure 83: Europe Market Y-o-Y Growth (%) Projections by Country, 2022-2032

Figure 84: Europe Market Value (US$ Mn) Analysis by Therapy Type, 2017-2032

Figure 85: Europe Market Value Share (%) and BPS Analysis by Therapy Type, 2022-2032

Figure 86: Europe Market Y-o-Y Growth (%) Projections by Therapy Type, 2022-2032

Figure 87: Europe Market Value (US$ Mn) Analysis by Indication, 2017-2032

Figure 88: Europe Market Value Share (%) and BPS Analysis by Indication, 2022-2032

Figure 89: Europe Market Y-o-Y Growth (%) Projections by Indication, 2022-2032

Figure 90: Europe Market Value (US$ Mn) Analysis by End User, 2017-2032

Figure 91: Europe Market Value Share (%) and BPS Analysis by End User, 2022-2032

Figure 92: Europe Market Y-o-Y Growth (%) Projections by End User, 2022-2032

Figure 93: Europe Market Value (US$ Mn) Analysis by Stem Cell Type, 2017-2032

Figure 94: Europe Market Value Share (%) and BPS Analysis by Stem Cell Type, 2022-2032

Figure 95: Europe Market Y-o-Y Growth (%) Projections by Stem Cell Type, 2022-2032

Figure 96: Europe Market Attractiveness by Therapy Type, 2022-2032

Figure 97: Europe Market Attractiveness by Indication, 2022-2032

Figure 98: Europe Market Attractiveness by End User, 2022-2032

Figure 99: Europe Market Attractiveness by Stem Cell Type, 2022-2032

Figure 100: Europe Market Attractiveness by Country, 2022-2032

Figure 101: East Asia Market Value (US$ Mn) by Therapy Type, 2022-2032

Figure 102: East Asia Market Value (US$ Mn) by Indication, 2022-2032

Figure 103: East Asia Market Value (US$ Mn) by End User, 2022-2032

Figure 104: East Asia Market Value (US$ Mn) by Stem Cell Type, 2022-2032

Figure 105: East Asia Market Value (US$ Mn) by Country, 2022-2032

Figure 106: East Asia Market Value (US$ Mn) Analysis by Country, 2017-2032

Figure 107: East Asia Market Value Share (%) and BPS Analysis by Country, 2022-2032

Figure 108: East Asia Market Y-o-Y Growth (%) Projections by Country, 2022-2032

Figure 109: East Asia Market Value (US$ Mn) Analysis by Therapy Type, 2017-2032

Figure 110: East Asia Market Value Share (%) and BPS Analysis by Therapy Type, 2022-2032

Figure 111: East Asia Market Y-o-Y Growth (%) Projections by Therapy Type, 2022-2032

Figure 112: East Asia Market Value (US$ Mn) Analysis by Indication, 2017-2032

Figure 113: East Asia Market Value Share (%) and BPS Analysis by Indication, 2022-2032

Figure 114: East Asia Market Y-o-Y Growth (%) Projections by Indication, 2022-2032

Figure 115: East Asia Market Value (US$ Mn) Analysis by End User, 2017-2032

Figure 116: East Asia Market Value Share (%) and BPS Analysis by End User, 2022-2032

Figure 117: East Asia Market Y-o-Y Growth (%) Projections by End User, 2022-2032

Figure 118: East Asia Market Value (US$ Mn) Analysis by Stem Cell Type, 2017-2032

Figure 119: East Asia Market Value Share (%) and BPS Analysis by Stem Cell Type, 2022-2032

Figure 120: East Asia Market Y-o-Y Growth (%) Projections by Stem Cell Type, 2022-2032

Figure 121: East Asia Market Attractiveness by Therapy Type, 2022-2032

Figure 122: East Asia Market Attractiveness by Indication, 2022-2032

Figure 123: East Asia Market Attractiveness by End User, 2022-2032

Figure 124: East Asia Market Attractiveness by Stem Cell Type, 2022-2032

Figure 125: East Asia Market Attractiveness by Country, 2022-2032

Figure 126: South Asia & Pacific Market Value (US$ Mn) by Therapy Type, 2022-2032

Figure 127: South Asia & Pacific Market Value (US$ Mn) by Indication, 2022-2032

Figure 128: South Asia & Pacific Market Value (US$ Mn) by End User, 2022-2032

Figure 129: South Asia & Pacific Market Value (US$ Mn) by Stem Cell Type, 2022-2032

Figure 130: South Asia & Pacific Market Value (US$ Mn) by Country, 2022-2032

Figure 131: South Asia & Pacific Market Value (US$ Mn) Analysis by Country, 2017-2032

Figure 132: South Asia & Pacific Market Value Share (%) and BPS Analysis by Country, 2022-2032

Figure 133: South Asia & Pacific Market Y-o-Y Growth (%) Projections by Country, 2022-2032

Figure 134: South Asia & Pacific Market Value (US$ Mn) Analysis by Therapy Type, 2017-2032

Figure 135: South Asia & Pacific Market Value Share (%) and BPS Analysis by Therapy Type, 2022-2032

Figure 136: South Asia & Pacific Market Y-o-Y Growth (%) Projections by Therapy Type, 2022-2032

Figure 137: South Asia & Pacific Market Value (US$ Mn) Analysis by Indication, 2017-2032

Figure 138: South Asia & Pacific Market Value Share (%) and BPS Analysis by Indication, 2022-2032

Figure 139: South Asia & Pacific Market Y-o-Y Growth (%) Projections by Indication, 2022-2032

Figure 140: South Asia & Pacific Market Value (US$ Mn) Analysis by End User, 2017-2032

Figure 141: South Asia & Pacific Market Value Share (%) and BPS Analysis by End User, 2022-2032

Figure 142: South Asia & Pacific Market Y-o-Y Growth (%) Projections by End User, 2022-2032

Figure 143: South Asia & Pacific Market Value (US$ Mn) Analysis by Stem Cell Type, 2017-2032

Figure 144: South Asia & Pacific Market Value Share (%) and BPS Analysis by Stem Cell Type, 2022-2032

Figure 145: South Asia & Pacific Market Y-o-Y Growth (%) Projections by Stem Cell Type, 2022-2032

Figure 146: South Asia & Pacific Market Attractiveness by Therapy Type, 2022-2032

Figure 147: South Asia & Pacific Market Attractiveness by Indication, 2022-2032

Figure 148: South Asia & Pacific Market Attractiveness by End User, 2022-2032

Figure 149: South Asia & Pacific Market Attractiveness by Stem Cell Type, 2022-2032

Figure 150: South Asia & Pacific Market Attractiveness by Country, 2022-2032

Figure 151: MEA Market Value (US$ Mn) by Therapy Type, 2022-2032

Figure 152: MEA Market Value (US$ Mn) by Indication, 2022-2032

Figure 153: MEA Market Value (US$ Mn) by End User, 2022-2032

Figure 154: MEA Market Value (US$ Mn) by Stem Cell Type, 2022-2032

Figure 155: MEA Market Value (US$ Mn) by Country, 2022-2032

Figure 156: MEA Market Value (US$ Mn) Analysis by Country, 2017-2032

Figure 157: MEA Market Value Share (%) and BPS Analysis by Country, 2022-2032

Figure 158: MEA Market Y-o-Y Growth (%) Projections by Country, 2022-2032

Figure 159: MEA Market Value (US$ Mn) Analysis by Therapy Type, 2017-2032

Figure 160: MEA Market Value Share (%) and BPS Analysis by Therapy Type, 2022-2032

Figure 161: MEA Market Y-o-Y Growth (%) Projections by Therapy Type, 2022-2032

Figure 162: MEA Market Value (US$ Mn) Analysis by Indication, 2017-2032

Figure 163: MEA Market Value Share (%) and BPS Analysis by Indication, 2022-2032

Figure 164: MEA Market Y-o-Y Growth (%) Projections by Indication, 2022-2032

Figure 165: MEA Market Value (US$ Mn) Analysis by End User, 2017-2032

Figure 166: MEA Market Value Share (%) and BPS Analysis by End User, 2022-2032

Figure 167: MEA Market Y-o-Y Growth (%) Projections by End User, 2022-2032

Figure 168: MEA Market Value (US$ Mn) Analysis by Stem Cell Type, 2017-2032

Figure 169: MEA Market Value Share (%) and BPS Analysis by Stem Cell Type, 2022-2032

Figure 170: MEA Market Y-o-Y Growth (%) Projections by Stem Cell Type, 2022-2032

Figure 171: MEA Market Attractiveness by Therapy Type, 2022-2032

Figure 172: MEA Market Attractiveness by Indication, 2022-2032

Figure 173: MEA Market Attractiveness by End User, 2022-2032

Figure 174: MEA Market Attractiveness by Stem Cell Type, 2022-2032

Figure 175: MEA Market Attractiveness by Country, 2022-2032

Recommendations

Healthcare

Cell Culture Incubator Market

Published : July 2023

Healthcare

Cell Line Development Services Market

Published : July 2023

Healthcare

Cell Regeneration Medicine Market

Published : October 2022

Explore Healthcare Insights

View Reports

Stem Cell Therapies Market

We value your privacy

We use cookies to enhance your browsing experience, serve personalized ads or content, and analyze our traffic.

By clicking "Accept All", you consent to our use of cookies. Cookie Policy