Induced Pluripotent Stem Cells Production Market Analysis - Size, Share, and Forecast Outlook 2025 to 2035

The induced pluripotent stem cells production market is valued at USD 1.7 billion in 2025 and is forecast to reach USD 4.4 billion by 2035, registering a CAGR of 10.0%. Analysis of the acceleration and deceleration pattern suggests an initial phase of stronger growth, driven by expanding research applications, increasing funding, and rising interest in regenerative medicine. As adoption broadens, the market experiences consistent acceleration through mid-forecast years, supported by technological advancements in cell reprogramming and differentiation. Toward the later years, a gradual deceleration is expected as the market approaches a more stable adoption curve, with growth sustained by clinical applications and commercialization but at a moderated pace compared to early expansion.
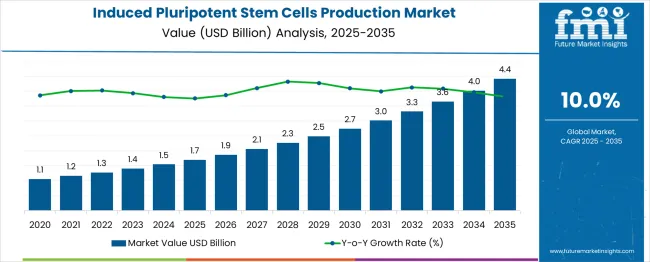
Quick Stats for Induced Pluripotent Stem Cells Production Market

  • Induced Pluripotent Stem Cells Production Market Value (2025): USD 1.7 billion
  • Induced Pluripotent Stem Cells Production Market Forecast Value (2035): USD 4.4 billion
  • Induced Pluripotent Stem Cells Production Market Forecast CAGR: 10.0%
  • Leading Process in Induced Pluripotent Stem Cells Production Market: Manual iPSC Production Process (77.6%)
  • Leading Workflow in Induced Pluripotent Stem Cells Production Market: Cell Culture (37.3%)
  • Leading Product in Induced Pluripotent Stem Cells Production Market: Consumables & Kits (40.0%)
  • Leading Application in Induced Pluripotent Stem Cells Production Market: Drug Development & Discovery (43%)
  • Leading End Use in Induced Pluripotent Stem Cells Production Market: Biotechnology & Pharmaceutical Companies (59%)
  • Key Growth Regions in Induced Pluripotent Stem Cells Production Market: North America, Europe, and Asia Pacific
  • Key Players in Induced Pluripotent Stem Cells Production Market: FUJIFILM Cellular Dynamics Inc., Lonza, Axol Bioscience Ltd., Evotec, Hitachi Ltd., REPROCELL Inc., Fate Therapeutics, Thermo Fisher Scientific Inc., StemCellsFactory III, Applied StemCells Inc.

Induced Pluripotent Stem Cells Production Market Market Value Analysis

Induced Pluripotent Stem Cells Production Market Key Takeaways

Metric Value
Market Value (2025) USD 1.7 billion
Forecast Market Value (2035) USD 4.4 billion
Forecast CAGR (2025–2035) 10.0%

The market has gained significant momentum in recent years, driven by its expanding role in regenerative medicine, disease modeling, and drug discovery. Historical trends highlight consistent adoption across pharmaceutical and academic research institutions, supported by advances in reprogramming technologies and cell culture methods. When combined with a CAGR approach, long-term forecasting provides a reliable projection of market size. Current estimates suggest that the market will maintain a CAGR in the range of 8% to 10% over the next decade, reflecting strong demand for scalable iPSC production methods and increasing investments in personalized medicine research. The upward trendline confirms that market growth will not plateau in the near term, as emerging applications continue to drive new opportunities.

Looking forward to 2035, the market is projected to expand significantly, with CAGR-based compounding indicating a several-fold increase compared to its 2025 baseline. While occasional fluctuations may arise due to ethical debates, high production costs, and regulatory approval processes, these are expected to create short-term slowdowns rather than structural declines. Long-term trend analysis reinforces that the trajectory remains strongly upward, supported by breakthroughs in automated cell culture platforms and gene-editing integration. The combined forecasting approach illustrates that the induced pluripotent stem cells production market will remain a critical growth domain within life sciences, positioning itself as a cornerstone of future therapeutic and research innovations.

Why is the Induced Pluripotent Stem Cells Production Market is Growing?

Market expansion is being supported by the revolutionary potential of iPSC technology in regenerative medicine and the growing demand for personalized therapeutic approaches that address individual patient genetic profiles. iPSCs offer unique advantages including patient-specific cell generation, unlimited proliferation capacity, and differentiation potential into any cell type, making them invaluable for drug development, disease modeling, and therapeutic applications. The technology addresses critical limitations of traditional cell sources while providing ethical alternatives to embryonic stem cells.

The increasing investment in regenerative medicine research and the growing focuses on personalized medicine are driving substantial demand for iPSC production capabilities and related technologies. Pharmaceutical companies are adopting iPSC platforms for drug discovery, toxicology testing, and therapeutic development to improve success rates and reduce development costs. Additionally, the advancing automation technologies and standardization of iPSC production protocols are making the technology more accessible and scalable for commercial applications, supported by regulatory framework development and quality assurance standards.

Segmental Analysis

The market is segmented by process outlook, workflow outlook, product outlook, application outlook, end use outlook, and region. By process outlook, the market is divided into manual iPSC production process and automated iPSC production process. Based on workflow outlook, the market is categorized into cell culture, reprogramming, cell characterization/analysis, engineering, and others. In terms of product outlook, the market is segmented into consumables and kits, media, instruments/devices, services, and others. By application outlook, the market is classified into drug development and discovery, regenerative medicine, toxicology studies, and others. By end use outlook, the market is divided into biotechnology and pharmaceutical companies, hospitals and clinics, research and academic institutes, and others. Regionally, the market is divided into North America, Europe, East Asia, South Asia & Pacific, Latin America, and Middle East & Africa.
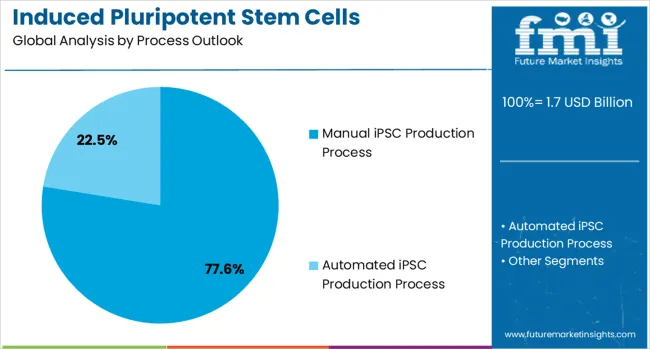
By Process Outlook, Manual iPSC Production Process Segment Accounts for 77.6% Market Share

Induced Pluripotent Stem Cells Production Market Analysis By Process Outlook

Manual iPSC production processes are projected to account for 77.6% of the induced pluripotent stem cells production market in 2025. This leading share is supported by the current state of iPSC technology where manual processes remain essential for quality control, customization, and research applications. Manual production methods offer flexibility in protocol adaptation, specialized handling requirements, and research-specific modifications that automated systems cannot yet fully replicate. The segment benefits from established protocols, skilled technician expertise, and the ability to customize production parameters for specific research and therapeutic applications.
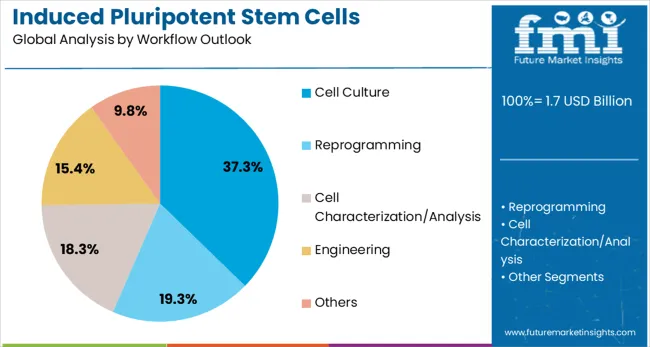
By Workflow Outlook, Cell Culture Segment Accounts for 37.3% Market Share

Induced Pluripotent Stem Cells Production Market Analysis By Workflow Outlook

Cell culture workflows are expected to represent 37.3% of iPSC production activities in 2025. This dominant share reflects the critical importance of cell culture techniques in iPSC generation, maintenance, and differentiation protocols. Cell culture represents the foundation of iPSC technology, requiring specialized media, culture conditions, and handling procedures that ensure cell viability and pluripotency maintenance. The segment benefits from continuous advancement in culture media formulations, surface coating technologies, and environmental control systems that optimize iPSC production outcomes.
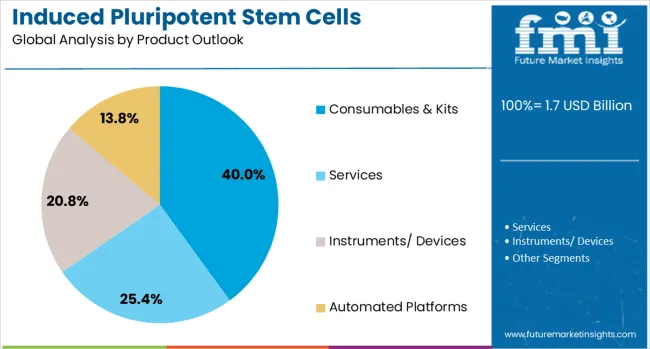
By Product Outlook, Consumables & Kits Segment Accounts for 40.0% Market Share

Induced Pluripotent Stem Cells Production Market Analysis By Product Outlook

Consumables and kits are projected to contribute 40.0% of the market in 2025, representing the ongoing materials and reagents required for iPSC production and maintenance. These products include specialized culture media, reprogramming factors, characterization reagents, and quality control materials that are essential for successful iPSC generation. Consumables represent recurring revenue streams for suppliers and reflect the continuous material requirements of active iPSC research and production facilities. The segment is supported by advancing formulation technologies and standardized kit development that simplifies iPSC production protocols.
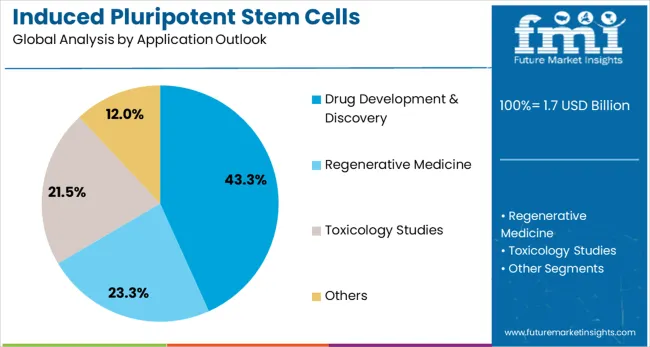
By Application Outlook, Drug Development & Discovery Segment Accounts for 43.3% Market Share

Induced Pluripotent Stem Cells Production Market Analysis By Application Outlook

Drug development and discovery applications are estimated to hold 43.3% of the market share in 2025. This significant share reflects the substantial adoption of iPSC technology by pharmaceutical companies for drug screening, toxicity testing, and therapeutic target identification. iPSC-derived cell models provide superior predictive capabilities compared to traditional cell lines and animal models, enabling more accurate assessment of drug efficacy and safety. The segment benefits from increasing pharmaceutical industry recognition of iPSC technology value and growing regulatory acceptance of iPSC-based testing approaches.
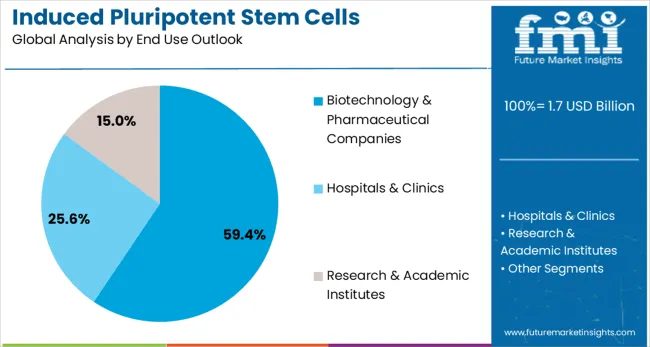
By End Use Outlook, Biotechnology & Pharmaceutical Companies Segment Accounts for 59.4% Market Share

Induced Pluripotent Stem Cells Production Market Analysis By End Use Outlook

Biotechnology and pharmaceutical companies are expected to represent 59.4% of iPSC production demand in 2025. This dominant share reflects the primary role of commercial organizations in driving iPSC technology development and application for therapeutic and research purposes. These companies possess the resources, expertise, and market focus necessary to translate iPSC technology into commercial products and services. The segment benefits from substantial industry investment in iPSC technology platforms and growing integration of iPSC applications into drug development pipelines.

What are the Drivers, Restraints, and Key Trends of the Induced Pluripotent Stem Cells Production Market?

The market is advancing rapidly due to scientific breakthroughs and increasing commercial applications. The market faces challenges including technical complexity, standardization requirements, and regulatory uncertainty for therapeutic applications. Quality control considerations and reproducibility requirements continue to influence production protocols and technology adoption patterns while ensuring research validity and therapeutic safety.

Advancement in Automation and Standardization Technologies

The growing development of automated iPSC production platforms is enabling standardized, scalable, and reproducible cell production that meets commercial and therapeutic application requirements. Advanced robotic systems, automated media handling, and integrated monitoring technologies are reducing manual labor requirements while improving production consistency and quality control. These technologies are particularly valuable for pharmaceutical companies and commercial service providers that require high-throughput iPSC production capabilities for drug development and therapeutic applications.

Integration of Artificial Intelligence and Machine Learning in iPSC Production

Modern iPSC production facilities are incorporating AI and machine learning technologies to optimize production protocols, predict cell behavior, and improve quality control processes. Advanced algorithms can analyze cell morphology, gene expression patterns, and differentiation potential to ensure optimal iPSC quality and functionality. These technologies enable predictive maintenance, process optimization, and automated decision-making that enhance production efficiency while reducing variability and production costs.
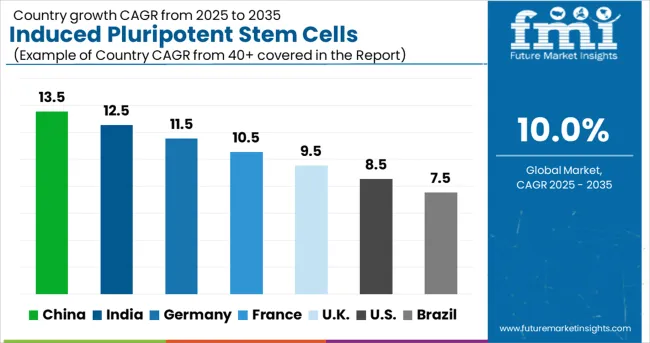
Analysis of Induced Pluripotent Stem Cells Production Market by Key Country

Induced Pluripotent Stem Cells Production Market Cagr Analysis By Country

Countries CAGR (2025-2035)
China 13.5%
India 12.5%
Germany 11.5%
France 10.5%
UK 9.5%
USA 8.5%
Brazil 7.5%

The global market is expected to grow at a CAGR of 10.0% between 2025 and 2035, driven by rising demand for regenerative medicine and expanding applications in drug discovery and disease modeling. China leads with 13.5% growth, supported by large-scale government funding in stem cell research and rapid expansion of biotechnology infrastructure. India follows at 12.5%, reflecting growing research collaborations and increasing focus on personalized medicine. Germany records 11.5%, driven by strong academic research and advanced clinical applications. France is projected at 10.5%, supported by adoption of innovative stem cell technologies in therapeutic development. The UK grows at 9.5% with increasing focus on translational research, while the USA expands at 8.5%, influenced by steady commercialization efforts and clinical trial activity. Brazil shows 7.5%, reflecting gradual development of regenerative medicine capabilities.

The report covers an in-depth analysis of 40+ countries, top-performing countries are highlighted below.

Demand Forecast for iPSCs Production Market in China

China is expected to record the highest CAGR of 13.5% between 2025 and 2035, driven by expanding research programs and government backed investments in stem cell technologies. Universities, biotech startups, and pharmaceutical companies have rapidly adopted iPSC technologies for regenerative medicine, toxicology testing, and rare disease research. Government initiatives have supported the establishment of stem cell banks and large scale production centers. Domestic players such as Jinan UniStem and international firms have collaborated to transfer advanced technologies. The increasing number of clinical studies using iPSC derived therapies is boosting market prospects, particularly in chronic disease management. China’s growing influence in global stem cell research is expected to further accelerate adoption over the forecast period.

  • Government funded stem cell banks supported large scale production
  • Jinan UniStem collaborated with international providers for technology transfer
  • Clinical studies expanded use of iPSCs in chronic disease management

Market Expansion of iPSCs Production in India

India is forecasted to expand at a CAGR of 12.5% during 2025–2035, driven by rising investments in biotechnology research and regenerative medicine. Academic research institutions, hospitals, and biotech companies have embraced iPSC production for applications in oncology, neurology, and pharmacological testing. The Indian Council of Medical Research has provided regulatory oversight to ensure ethical compliance in stem cell research. Domestic companies and multinational providers have collaborated to establish production facilities and training programs. Increasing prevalence of chronic diseases has fueled demand for patient specific therapies, creating new opportunities. Cost effective research capabilities and skilled workforce are positioning India as a significant contributor to global iPSC development.

  • Indian Council of Medical Research enforced ethical oversight in iPSC research
  • Collaborations established production facilities and training programs
  • Rising chronic diseases fueled demand for patient specific iPSC therapies

Market Analysis of iPSCs Production in Germany

Germany is expected to grow at a CAGR of 11.5% from 2025 to 2035, supported by strong investments in biomedical research and pharmaceutical innovation. Universities, biotech firms, and healthcare institutions have adopted iPSC production for drug screening, disease modeling, and regenerative therapies. Regulatory guidelines under the European Medicines Agency have provided structured pathways for clinical adoption. Companies such as Evotec and Fraunhofer IGB have pioneered advancements in large scale cell reprogramming, cryopreservation, and high throughput screening. Integration of iPSC platforms with artificial intelligence and automation has further improved efficiency. Germany’s well established research infrastructure and skilled workforce are expected to sustain growth in the market over the coming decade.

  • Evotec and Fraunhofer IGB advanced high throughput iPSC technologies
  • EMA guidelines structured safe clinical adoption pathways
  • AI integration improved efficiency in iPSC screening and production

Future Prospects of iPSCs Production Market in France

France is projected to grow at a CAGR of 10.5% between 2025 and 2035, shaped by growing investments in regenerative medicine and public private partnerships. Research centers and biotech firms have increasingly adopted iPSC technologies for toxicology, cell therapy, and disease modeling. The French National Institute of Health and Medical Research has supported iPSC studies, ensuring ethical compliance and scientific advancement. Companies have invested in scalable production platforms and cryopreservation technologies to serve the pharmaceutical industry. Rising interest in neurological disorders and cardiovascular research has strengthened demand for iPSC based applications. With a strong focus on innovation and international collaborations, France is positioned for steady growth in the market.

  • INSERM supported iPSC studies with ethical and scientific frameworks
  • Scalable production platforms enhanced pharmaceutical applications
  • Neurological and cardiovascular research boosted iPSC adoption

Adoption of iPSCs Production Market in the United Kingdom

The United Kingdom is expected to grow at a CAGR of 9.5% between 2025 and 2035, supported by government initiatives and investments in advanced therapies. Universities, biotech firms, and the National Health Service have promoted iPSC production for personalized medicine, oncology research, and toxicology testing. Regulatory oversight by the MHRA has guided ethical and safe applications in clinical studies. Companies such as Oxford Biomedica and ReNeuron have developed iPSC platforms for therapeutic purposes. Collaborations with European research consortia have strengthened technology access and innovation. Market expansion is anticipated as demand for iPSC derived therapies increases, particularly in rare disease treatment and regenerative care.
  • Oxford Biomedica and ReNeuron advanced therapeutic iPSC platforms
  • MHRA oversight ensured safe and ethical clinical applications
  • Collaborations with European consortia expanded research opportunities

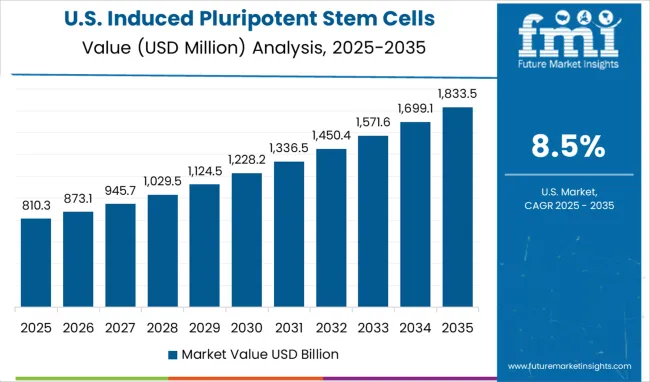
Growth Analysis of iPSCs Production Market in the United States

Induced Pluripotent Stem Cells Production Market Country Value Analysis

The market in the United States is projected to grow at a CAGR of 8.5% between 2025 and 2035, supported by advancements in regenerative medicine and biotechnology research. Academic institutions and private companies have invested in large scale iPSC facilities for disease modeling, drug discovery, and personalized medicine. Regulatory guidance from the FDA has shaped standards for safe iPSC generation and therapeutic applications. Leading players such as Fate Therapeutics and Thermo Fisher Scientific have expanded capabilities in cell reprogramming, cryopreservation, and automation technologies. Growth is further supported by rising clinical trials involving iPSC derived therapies, particularly in neurology and cardiology. Market adoption is expected to strengthen as advanced manufacturing processes improve scalability and cost efficiency.

  • Fate Therapeutics and Thermo Fisher expanded iPSC production and automation
  • FDA regulatory guidance shaped safe production and therapeutic applications
  • Clinical trials in neurology and cardiology increased iPSC adoption

iPSCs Production Market Development in Brazil

Brazil is projected to grow at a CAGR of 7.5% between 2025 and 2035, influenced by increasing focus on biotechnology research and medical applications. Research institutes and hospitals have begun adopting iPSC technologies for regenerative therapies, toxicology studies, and chronic disease modeling. Government funding and partnerships with international biotech companies have facilitated gradual market penetration. Ethical guidelines and research frameworks have been established to regulate stem cell studies. Domestic laboratories are focusing on cost effective production methods to expand access. While adoption is at an early stage compared to developed regions, Brazil’s growing biomedical sector is expected to contribute steadily to global iPSC advancements.
  • Government funding and international partnerships supported adoption
  • Ethical guidelines regulated stem cell research frameworks
  • Domestic laboratories focused on cost effective iPSC production methods

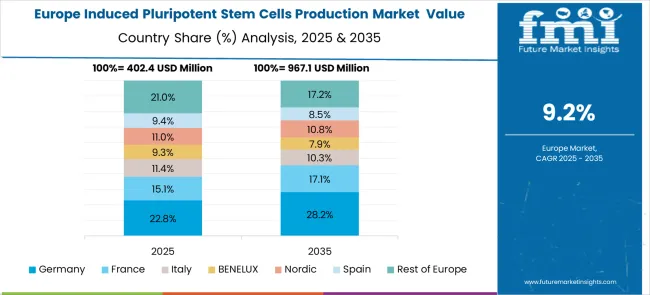
Europe Market Split by Country

Induced Pluripotent Stem Cells Production Market Europe Country Market Share Analysis, 2025 & 2035

The market in Europe is projected to grow from USD 480.0 million in 2025 to USD 1.18 billion by 2035, registering a CAGR of 9.4% over the forecast period. Germany is expected to maintain its leadership with a 26.9% share in 2025, supported by strong biotechnology sector and advanced research infrastructure. The UK holds 24.1% market share, followed by France at 19.6%, Italy at 12.0%, and Spain at 8.7%. Nordic countries contribute 5.4% to the regional market, while BENELUX accounts for 2.8%. The Rest of Europe region represents 0.5% of the market, driven by emerging biotechnology initiatives in Eastern European countries.
Competitive Landscape of Induced Pluripotent Stem Cells Production Market

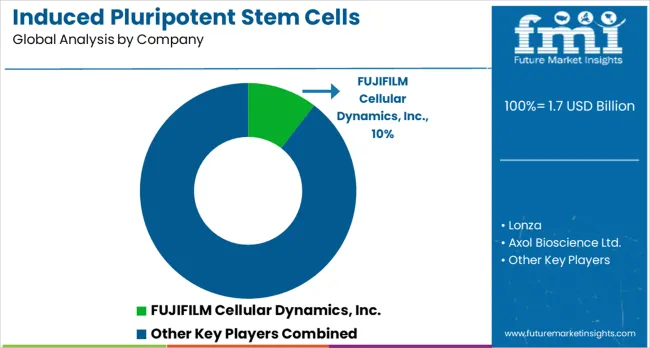
Induced Pluripotent Stem Cells Production Market Analysis By Company

FUJIFILM Cellular Dynamics, Lonza, and Thermo Fisher Scientific lead the field with large-scale production systems, standardized cell lines, and end-to-end solutions for pharmaceutical research and clinical development. Their competitive advantage lies in global infrastructure, regulatory expertise, and integration of automation technologies that ensure reproducibility and high-quality output. Specialized players including Axol Bioscience, Evotec, and REPROCELL focus on custom iPSC-derived models, targeting applications in drug screening, disease modeling, and personalized medicine. These firms compete through innovation in differentiation protocols, advanced culture media, and efficient reprogramming methods. Fate Therapeutics extends competition toward therapeutic development, with pipelines based on iPSC-derived immune cells for cancer and regenerative medicine, positioning itself uniquely compared to companies with purely research-oriented offerings.

Smaller firms such as StemCellsFactory III and Applied StemCells compete by offering tailored services, niche protocols, and flexible production support for academic institutions and biotech start-ups. Product brochures in this segment highlight high-quality reprogramming kits, differentiation platforms, and cell banking services designed for both research and translational needs. The competitive environment is defined by the ability to deliver reliable, scalable, and clinically compliant iPSC production. Large corporations dominate with infrastructure and regulatory backing, while mid-sized and niche companies attract clients through customization and specialized innovation. Success in this market depends on technological precision, service adaptability, and alignment with the growing demand for stem cell-based drug discovery and regenerative medicine applications.

Key Players in the Induced Pluripotent Stem Cells Production Market

  • FUJIFILM Cellular Dynamics, Inc.
  • Lonza
  • Axol Bioscience Ltd.
  • Evotec
  • Hitachi, Ltd.
  • REPROCELL Inc.
  • Fate Therapeutics
  • Thermo Fisher Scientific, Inc.
  • StemCellsFactory III
  • Applied StemCells, Inc.

Scope of the Report

Item Value
Quantitative Units USD 1.7 billion
Process Outlook Manual iPSC Production Process, Automated iPSC Production Process
Workflow Outlook Cell Culture, Reprogramming, Cell Characterization/Analysis, Engineering, Others
Product Outlook Consumables & Kits, Media, Instruments/Devices, Services, Others
Application Outlook Drug Development & Discovery, Regenerative Medicine, Toxicology Studies, Others
End Use Outlook Biotechnology & Pharmaceutical Companies, Hospitals & Clinics, Research & Academic Institutes, Others
Regions Covered North America, Europe, East Asia, South Asia & Pacific, Latin America, Middle East & Africa
Countries Covered United States, Germany, India, China, United Kingdom, Japan, Brazil, France
Key Companies Profiled FUJIFILM Cellular Dynamics Inc., Lonza, Axol Bioscience Ltd., Evotec, Hitachi Ltd., REPROCELL Inc., Fate Therapeutics, Thermo Fisher Scientific Inc., StemCellsFactory III, Applied StemCells Inc.
Additional Attributes Revenue analysis by process, workflow, product, application, and end use segments, regional research and development patterns across major biotechnology markets, competitive positioning with established biotechnology companies and pharmaceutical corporations, researcher and industry preferences for different iPSC production technologies and protocols, integration with automation and artificial intelligence technologies for enhanced production efficiency, innovations in quality control systems and standardization protocols for therapeutic applications, and adoption of regulatory-compliant production processes for clinical translation and commercial development.

Induced Pluripotent Stem Cells Production Market by Segments

Process Outlook:

  • Manual iPSC Production Process
  • Automated iPSC Production Process

Workflow Outlook:

  • Cell Culture Reprogramming
  • Cell Characterization/Analysis Engineering Others

Product Outlook:

  • Consumables & Kits
  • Media
  • Instruments/Devices
  • Services
  • Others

Application Outlook:

  • Drug Development & Discovery
  • Regenerative Medicine
  • Toxicology Studies
  • Others

End Use Outlook:

  • Biotechnology & Pharmaceutical
  • Companies Hospitals & Clinics
  • Research & Academic Institutes
  • Others

Region:

  • North America
    • United States
    • Canada
    • Mexico
  • Europe
    • Germany
    • United Kingdom
    • France
    • Italy
    • Spain
    • Nordic
    • BENELUX
    • Rest of Europe
  • Asia Pacific
    • China
    • Japan
    • South Korea
    • India
    • ASEAN
    • Australia & New Zealand
    • Rest of Asia Pacific
  • Latin America
    • Brazil
    • Chile
    • Rest of Latin America
  • Middle East & Africa
    • Kingdom of Saudi Arabia
    • Other GCC Countries
    • Turkey
    • South Africa
    • Other African Union
    • Rest of Middle East & Africa

Table of Content

  1. Executive Summary
    • Global Market Outlook
    • Demand-side Trends
    • Supply-side Trends
    • Technology Roadmap Analysis
    • Analysis and Recommendations
  2. Market Overview
    • Market Coverage / Taxonomy
    • Market Definition / Scope / Limitations
  3. Market Background
    • Market Dynamics
      • Drivers
      • Restraints
      • Opportunity
      • Trends
    • Scenario Forecast
      • Demand in Optimistic Scenario
      • Demand in Likely Scenario
      • Demand in Conservative Scenario
    • Opportunity Map Analysis
    • Product Life Cycle Analysis
    • Supply Chain Analysis
    • Investment Feasibility Matrix
    • Value Chain Analysis
    • PESTLE and Porter’s Analysis
    • Regulatory Landscape
    • Regional Parent Market Outlook
    • Production and Consumption Statistics
    • Import and Export Statistics
  4. Global Induced Pluripotent Stem Cells Production Market Analysis 2020-2024 and Forecast, 2025-2035
    • Historical Market Size Value (USD Mn) Analysis, 2020-2024
    • Current and Future Market Size Value (USD Mn) Projections, 2025-2035
      • Y-o-Y Growth Trend Analysis
      • Absolute $ Opportunity Analysis
  5. Global Induced Pluripotent Stem Cells Production Market Pricing Analysis 2020-2024 and Forecast 2025-2035
  6. Global Induced Pluripotent Stem Cells Production Market Analysis 2020-2024 and Forecast 2025-2035, By Process Outlook
    • Introduction / Key Findings
    • Historical Market Size Value (USD Mn) Analysis By Process Outlook , 2020-2024
    • Current and Future Market Size Value (USD Mn) Analysis and Forecast By Process Outlook , 2025-2035
      • Manual iPSC Production Process
      • Automated iPSC Production Process
    • Y-o-Y Growth Trend Analysis By Process Outlook , 2020-2024
    • Absolute $ Opportunity Analysis By Process Outlook , 2025-2035
  7. Global Induced Pluripotent Stem Cells Production Market Analysis 2020-2024 and Forecast 2025-2035, By Workflow Outlook
    • Introduction / Key Findings
    • Historical Market Size Value (USD Mn) Analysis By Workflow Outlook, 2020-2024
    • Current and Future Market Size Value (USD Mn) Analysis and Forecast By Workflow Outlook, 2025-2035
      • Cell Culture
      • Reprogramming
      • Cell Characterization/Analysis
      • Engineering
      • Others
    • Y-o-Y Growth Trend Analysis By Workflow Outlook, 2020-2024
    • Absolute $ Opportunity Analysis By Workflow Outlook, 2025-2035
  8. Global Induced Pluripotent Stem Cells Production Market Analysis 2020-2024 and Forecast 2025-2035, By Product Outlook
    • Introduction / Key Findings
    • Historical Market Size Value (USD Mn) Analysis By Product Outlook, 2020-2024
    • Current and Future Market Size Value (USD Mn) Analysis and Forecast By Product Outlook, 2025-2035
      • Consumables & Kits
        • Media
        • Kits
        • Others
      • Services
      • Instruments/ Devices
      • Automated Platforms
    • Y-o-Y Growth Trend Analysis By Product Outlook, 2020-2024
    • Absolute $ Opportunity Analysis By Product Outlook, 2025-2035
  9. Global Induced Pluripotent Stem Cells Production Market Analysis 2020-2024 and Forecast 2025-2035, By Application Outlook
    • Introduction / Key Findings
    • Historical Market Size Value (USD Mn) Analysis By Application Outlook, 2020-2024
    • Current and Future Market Size Value (USD Mn) Analysis and Forecast By Application Outlook, 2025-2035
      • Drug Development & Discovery
      • Regenerative Medicine
      • Toxicology Studies
      • Others
    • Y-o-Y Growth Trend Analysis By Application Outlook, 2020-2024
    • Absolute $ Opportunity Analysis By Application Outlook, 2025-2035
  10. Global Induced Pluripotent Stem Cells Production Market Analysis 2020-2024 and Forecast 2025-2035, By End Use Outlook
    • Introduction / Key Findings
    • Historical Market Size Value (USD Mn) Analysis By End Use Outlook, 2020-2024
    • Current and Future Market Size Value (USD Mn) Analysis and Forecast By End Use Outlook, 2025-2035
      • Biotechnology & Pharmaceutical Companies
      • Hospitals & Clinics
      • Research & Academic Institutes
    • Y-o-Y Growth Trend Analysis By End Use Outlook, 2020-2024
    • Absolute $ Opportunity Analysis By End Use Outlook, 2025-2035
  11. Global Induced Pluripotent Stem Cells Production Market Analysis 2020-2024 and Forecast 2025-2035, By Region
    • Introduction
    • Historical Market Size Value (USD Mn) Analysis By Region, 2020-2024
    • Current Market Size Value (USD Mn) Analysis and Forecast By Region, 2025-2035
      • North America
      • Latin America
      • Western Europe
      • Eastern Europe
      • East Asia
      • South Asia and Pacific
      • Middle East & Africa
    • Market Attractiveness Analysis By Region
  12. North America Induced Pluripotent Stem Cells Production Market Analysis 2020-2024 and Forecast 2025-2035, By Country
    • Historical Market Size Value (USD Mn) Trend Analysis By Market Taxonomy, 2020-2024
    • Market Size Value (USD Mn) Forecast By Market Taxonomy, 2025-2035
      • By Country
        • USA
        • Canada
        • Mexico
      • By Process Outlook
      • By Workflow Outlook
      • By Product Outlook
      • By Application Outlook
      • By End Use Outlook
    • Market Attractiveness Analysis
      • By Country
      • By Process Outlook
      • By Workflow Outlook
      • By Product Outlook
      • By Application Outlook
      • By End Use Outlook
    • Key Takeaways
  13. Latin America Induced Pluripotent Stem Cells Production Market Analysis 2020-2024 and Forecast 2025-2035, By Country
    • Historical Market Size Value (USD Mn) Trend Analysis By Market Taxonomy, 2020-2024
    • Market Size Value (USD Mn) Forecast By Market Taxonomy, 2025-2035
      • By Country
        • Brazil
        • Chile
        • Rest of Latin America
      • By Process Outlook
      • By Workflow Outlook
      • By Product Outlook
      • By Application Outlook
      • By End Use Outlook
    • Market Attractiveness Analysis
      • By Country
      • By Process Outlook
      • By Workflow Outlook
      • By Product Outlook
      • By Application Outlook
      • By End Use Outlook
    • Key Takeaways
  14. Western Europe Induced Pluripotent Stem Cells Production Market Analysis 2020-2024 and Forecast 2025-2035, By Country
    • Historical Market Size Value (USD Mn) Trend Analysis By Market Taxonomy, 2020-2024
    • Market Size Value (USD Mn) Forecast By Market Taxonomy, 2025-2035
      • By Country
        • Germany
        • UK
        • Italy
        • Spain
        • France
        • Nordic
        • BENELUX
        • Rest of Western Europe
      • By Process Outlook
      • By Workflow Outlook
      • By Product Outlook
      • By Application Outlook
      • By End Use Outlook
    • Market Attractiveness Analysis
      • By Country
      • By Process Outlook
      • By Workflow Outlook
      • By Product Outlook
      • By Application Outlook
      • By End Use Outlook
    • Key Takeaways
  15. Eastern Europe Induced Pluripotent Stem Cells Production Market Analysis 2020-2024 and Forecast 2025-2035, By Country
    • Historical Market Size Value (USD Mn) Trend Analysis By Market Taxonomy, 2020-2024
    • Market Size Value (USD Mn) Forecast By Market Taxonomy, 2025-2035
      • By Country
        • Russia
        • Poland
        • Hungary
        • Balkan & Baltic
        • Rest of Eastern Europe
      • By Process Outlook
      • By Workflow Outlook
      • By Product Outlook
      • By Application Outlook
      • By End Use Outlook
    • Market Attractiveness Analysis
      • By Country
      • By Process Outlook
      • By Workflow Outlook
      • By Product Outlook
      • By Application Outlook
      • By End Use Outlook
    • Key Takeaways
  16. East Asia Induced Pluripotent Stem Cells Production Market Analysis 2020-2024 and Forecast 2025-2035, By Country
    • Historical Market Size Value (USD Mn) Trend Analysis By Market Taxonomy, 2020-2024
    • Market Size Value (USD Mn) Forecast By Market Taxonomy, 2025-2035
      • By Country
        • China
        • Japan
        • South Korea
      • By Process Outlook
      • By Workflow Outlook
      • By Product Outlook
      • By Application Outlook
      • By End Use Outlook
    • Market Attractiveness Analysis
      • By Country
      • By Process Outlook
      • By Workflow Outlook
      • By Product Outlook
      • By Application Outlook
      • By End Use Outlook
    • Key Takeaways
  17. South Asia and Pacific Induced Pluripotent Stem Cells Production Market Analysis 2020-2024 and Forecast 2025-2035, By Country
    • Historical Market Size Value (USD Mn) Trend Analysis By Market Taxonomy, 2020-2024
    • Market Size Value (USD Mn) Forecast By Market Taxonomy, 2025-2035
      • By Country
        • India
        • ASEAN
        • Australia & New Zealand
        • Rest of South Asia and Pacific
      • By Process Outlook
      • By Workflow Outlook
      • By Product Outlook
      • By Application Outlook
      • By End Use Outlook
    • Market Attractiveness Analysis
      • By Country
      • By Process Outlook
      • By Workflow Outlook
      • By Product Outlook
      • By Application Outlook
      • By End Use Outlook
    • Key Takeaways
  18. Middle East & Africa Induced Pluripotent Stem Cells Production Market Analysis 2020-2024 and Forecast 2025-2035, By Country
    • Historical Market Size Value (USD Mn) Trend Analysis By Market Taxonomy, 2020-2024
    • Market Size Value (USD Mn) Forecast By Market Taxonomy, 2025-2035
      • By Country
        • Kingdom of Saudi Arabia
        • Other GCC Countries
        • Turkiye
        • South Africa
        • Other African Union
        • Rest of Middle East & Africa
      • By Process Outlook
      • By Workflow Outlook
      • By Product Outlook
      • By Application Outlook
      • By End Use Outlook
    • Market Attractiveness Analysis
      • By Country
      • By Process Outlook
      • By Workflow Outlook
      • By Product Outlook
      • By Application Outlook
      • By End Use Outlook
    • Key Takeaways
  19. Key Countries Induced Pluripotent Stem Cells Production Market Analysis
    • USA
      • Pricing Analysis
      • Market Share Analysis, 2024
        • By Process Outlook
        • By Workflow Outlook
        • By Product Outlook
        • By Application Outlook
        • By End Use Outlook
    • Canada
      • Pricing Analysis
      • Market Share Analysis, 2024
        • By Process Outlook
        • By Workflow Outlook
        • By Product Outlook
        • By Application Outlook
        • By End Use Outlook
    • Mexico
      • Pricing Analysis
      • Market Share Analysis, 2024
        • By Process Outlook
        • By Workflow Outlook
        • By Product Outlook
        • By Application Outlook
        • By End Use Outlook
    • Brazil
      • Pricing Analysis
      • Market Share Analysis, 2024
        • By Process Outlook
        • By Workflow Outlook
        • By Product Outlook
        • By Application Outlook
        • By End Use Outlook
    • Chile
      • Pricing Analysis
      • Market Share Analysis, 2024
        • By Process Outlook
        • By Workflow Outlook
        • By Product Outlook
        • By Application Outlook
        • By End Use Outlook
    • Germany
      • Pricing Analysis
      • Market Share Analysis, 2024
        • By Process Outlook
        • By Workflow Outlook
        • By Product Outlook
        • By Application Outlook
        • By End Use Outlook
    • UK
      • Pricing Analysis
      • Market Share Analysis, 2024
        • By Process Outlook
        • By Workflow Outlook
        • By Product Outlook
        • By Application Outlook
        • By End Use Outlook
    • Italy
      • Pricing Analysis
      • Market Share Analysis, 2024
        • By Process Outlook
        • By Workflow Outlook
        • By Product Outlook
        • By Application Outlook
        • By End Use Outlook
    • Spain
      • Pricing Analysis
      • Market Share Analysis, 2024
        • By Process Outlook
        • By Workflow Outlook
        • By Product Outlook
        • By Application Outlook
        • By End Use Outlook
    • France
      • Pricing Analysis
      • Market Share Analysis, 2024
        • By Process Outlook
        • By Workflow Outlook
        • By Product Outlook
        • By Application Outlook
        • By End Use Outlook
    • India
      • Pricing Analysis
      • Market Share Analysis, 2024
        • By Process Outlook
        • By Workflow Outlook
        • By Product Outlook
        • By Application Outlook
        • By End Use Outlook
    • ASEAN
      • Pricing Analysis
      • Market Share Analysis, 2024
        • By Process Outlook
        • By Workflow Outlook
        • By Product Outlook
        • By Application Outlook
        • By End Use Outlook
    • Australia & New Zealand
      • Pricing Analysis
      • Market Share Analysis, 2024
        • By Process Outlook
        • By Workflow Outlook
        • By Product Outlook
        • By Application Outlook
        • By End Use Outlook
    • China
      • Pricing Analysis
      • Market Share Analysis, 2024
        • By Process Outlook
        • By Workflow Outlook
        • By Product Outlook
        • By Application Outlook
        • By End Use Outlook
    • Japan
      • Pricing Analysis
      • Market Share Analysis, 2024
        • By Process Outlook
        • By Workflow Outlook
        • By Product Outlook
        • By Application Outlook
        • By End Use Outlook
    • South Korea
      • Pricing Analysis
      • Market Share Analysis, 2024
        • By Process Outlook
        • By Workflow Outlook
        • By Product Outlook
        • By Application Outlook
        • By End Use Outlook
    • Russia
      • Pricing Analysis
      • Market Share Analysis, 2024
        • By Process Outlook
        • By Workflow Outlook
        • By Product Outlook
        • By Application Outlook
        • By End Use Outlook
    • Poland
      • Pricing Analysis
      • Market Share Analysis, 2024
        • By Process Outlook
        • By Workflow Outlook
        • By Product Outlook
        • By Application Outlook
        • By End Use Outlook
    • Hungary
      • Pricing Analysis
      • Market Share Analysis, 2024
        • By Process Outlook
        • By Workflow Outlook
        • By Product Outlook
        • By Application Outlook
        • By End Use Outlook
    • Kingdom of Saudi Arabia
      • Pricing Analysis
      • Market Share Analysis, 2024
        • By Process Outlook
        • By Workflow Outlook
        • By Product Outlook
        • By Application Outlook
        • By End Use Outlook
    • Turkiye
      • Pricing Analysis
      • Market Share Analysis, 2024
        • By Process Outlook
        • By Workflow Outlook
        • By Product Outlook
        • By Application Outlook
        • By End Use Outlook
    • South Africa
      • Pricing Analysis
      • Market Share Analysis, 2024
        • By Process Outlook
        • By Workflow Outlook
        • By Product Outlook
        • By Application Outlook
        • By End Use Outlook
  20. Market Structure Analysis
    • Competition Dashboard
    • Competition Benchmarking
    • Market Share Analysis of Top Players
      • By Regional
      • By Process Outlook
      • By Workflow Outlook
      • By Product Outlook
      • By Application Outlook
      • By End Use Outlook
  21. Competition Analysis
    • Competition Deep Dive
      • FUJIFILM Cellular Dynamics, Inc.
        • Overview
        • Product Portfolio
        • Profitability by Market Segments (Product/Age /Sales Channel/Region)
        • Sales Footprint
        • Strategy Overview
          • Marketing Strategy
          • Product Strategy
          • Channel Strategy
      • Lonza
      • Axol Bioscience Ltd.
      • Evotec
      • Hitachi, Ltd.
      • REPROCELL Inc.
      • Fate Therapeutics
      • Thermo Fisher Scientific, Inc.
      • StemCellsFactory III
      • Applied StemCells, Inc.
  22. Assumptions & Acronyms Used
  23. Research Methodology

List of Tables

  • Table 1: Global Induced Pluripotent Stem Cells Production Market Value (USD Mn) Forecast by Region, 2020-2035
  • Table 2: Global Induced Pluripotent Stem Cells Production Market Value (USD Mn) Forecast by Process Outlook , 2020-2035
  • Table 3: Global Induced Pluripotent Stem Cells Production Market Value (USD Mn) Forecast by Workflow Outlook, 2020-2035
  • Table 4: Global Induced Pluripotent Stem Cells Production Market Value (USD Mn) Forecast by Product Outlook, 2020-2035
  • Table 5: Global Induced Pluripotent Stem Cells Production Market Value (USD Mn) Forecast by Application Outlook, 2020-2035
  • Table 6: Global Induced Pluripotent Stem Cells Production Market Value (USD Mn) Forecast by End Use Outlook, 2020-2035
  • Table 7: North America Induced Pluripotent Stem Cells Production Market Value (USD Mn) Forecast by Country, 2020-2035
  • Table 8: North America Induced Pluripotent Stem Cells Production Market Value (USD Mn) Forecast by Process Outlook , 2020-2035
  • Table 9: North America Induced Pluripotent Stem Cells Production Market Value (USD Mn) Forecast by Workflow Outlook, 2020-2035
  • Table 10: North America Induced Pluripotent Stem Cells Production Market Value (USD Mn) Forecast by Product Outlook, 2020-2035
  • Table 11: North America Induced Pluripotent Stem Cells Production Market Value (USD Mn) Forecast by Application Outlook, 2020-2035
  • Table 12: North America Induced Pluripotent Stem Cells Production Market Value (USD Mn) Forecast by End Use Outlook, 2020-2035
  • Table 13: Latin America Induced Pluripotent Stem Cells Production Market Value (USD Mn) Forecast by Country, 2020-2035
  • Table 14: Latin America Induced Pluripotent Stem Cells Production Market Value (USD Mn) Forecast by Process Outlook , 2020-2035
  • Table 15: Latin America Induced Pluripotent Stem Cells Production Market Value (USD Mn) Forecast by Workflow Outlook, 2020-2035
  • Table 16: Latin America Induced Pluripotent Stem Cells Production Market Value (USD Mn) Forecast by Product Outlook, 2020-2035
  • Table 17: Latin America Induced Pluripotent Stem Cells Production Market Value (USD Mn) Forecast by Application Outlook, 2020-2035
  • Table 18: Latin America Induced Pluripotent Stem Cells Production Market Value (USD Mn) Forecast by End Use Outlook, 2020-2035
  • Table 19: Western Europe Induced Pluripotent Stem Cells Production Market Value (USD Mn) Forecast by Country, 2020-2035
  • Table 20: Western Europe Induced Pluripotent Stem Cells Production Market Value (USD Mn) Forecast by Process Outlook , 2020-2035
  • Table 21: Western Europe Induced Pluripotent Stem Cells Production Market Value (USD Mn) Forecast by Workflow Outlook, 2020-2035
  • Table 22: Western Europe Induced Pluripotent Stem Cells Production Market Value (USD Mn) Forecast by Product Outlook, 2020-2035
  • Table 23: Western Europe Induced Pluripotent Stem Cells Production Market Value (USD Mn) Forecast by Application Outlook, 2020-2035
  • Table 24: Western Europe Induced Pluripotent Stem Cells Production Market Value (USD Mn) Forecast by End Use Outlook, 2020-2035
  • Table 25: Eastern Europe Induced Pluripotent Stem Cells Production Market Value (USD Mn) Forecast by Country, 2020-2035
  • Table 26: Eastern Europe Induced Pluripotent Stem Cells Production Market Value (USD Mn) Forecast by Process Outlook , 2020-2035
  • Table 27: Eastern Europe Induced Pluripotent Stem Cells Production Market Value (USD Mn) Forecast by Workflow Outlook, 2020-2035
  • Table 28: Eastern Europe Induced Pluripotent Stem Cells Production Market Value (USD Mn) Forecast by Product Outlook, 2020-2035
  • Table 29: Eastern Europe Induced Pluripotent Stem Cells Production Market Value (USD Mn) Forecast by Application Outlook, 2020-2035
  • Table 30: Eastern Europe Induced Pluripotent Stem Cells Production Market Value (USD Mn) Forecast by End Use Outlook, 2020-2035
  • Table 31: East Asia Induced Pluripotent Stem Cells Production Market Value (USD Mn) Forecast by Country, 2020-2035
  • Table 32: East Asia Induced Pluripotent Stem Cells Production Market Value (USD Mn) Forecast by Process Outlook , 2020-2035
  • Table 33: East Asia Induced Pluripotent Stem Cells Production Market Value (USD Mn) Forecast by Workflow Outlook, 2020-2035
  • Table 34: East Asia Induced Pluripotent Stem Cells Production Market Value (USD Mn) Forecast by Product Outlook, 2020-2035
  • Table 35: East Asia Induced Pluripotent Stem Cells Production Market Value (USD Mn) Forecast by Application Outlook, 2020-2035
  • Table 36: East Asia Induced Pluripotent Stem Cells Production Market Value (USD Mn) Forecast by End Use Outlook, 2020-2035
  • Table 37: South Asia and Pacific Induced Pluripotent Stem Cells Production Market Value (USD Mn) Forecast by Country, 2020-2035
  • Table 38: South Asia and Pacific Induced Pluripotent Stem Cells Production Market Value (USD Mn) Forecast by Process Outlook , 2020-2035
  • Table 39: South Asia and Pacific Induced Pluripotent Stem Cells Production Market Value (USD Mn) Forecast by Workflow Outlook, 2020-2035
  • Table 40: South Asia and Pacific Induced Pluripotent Stem Cells Production Market Value (USD Mn) Forecast by Product Outlook, 2020-2035
  • Table 41: South Asia and Pacific Induced Pluripotent Stem Cells Production Market Value (USD Mn) Forecast by Application Outlook, 2020-2035
  • Table 42: South Asia and Pacific Induced Pluripotent Stem Cells Production Market Value (USD Mn) Forecast by End Use Outlook, 2020-2035
  • Table 43: Middle East & Africa Induced Pluripotent Stem Cells Production Market Value (USD Mn) Forecast by Country, 2020-2035
  • Table 44: Middle East & Africa Induced Pluripotent Stem Cells Production Market Value (USD Mn) Forecast by Process Outlook , 2020-2035
  • Table 45: Middle East & Africa Induced Pluripotent Stem Cells Production Market Value (USD Mn) Forecast by Workflow Outlook, 2020-2035
  • Table 46: Middle East & Africa Induced Pluripotent Stem Cells Production Market Value (USD Mn) Forecast by Product Outlook, 2020-2035
  • Table 47: Middle East & Africa Induced Pluripotent Stem Cells Production Market Value (USD Mn) Forecast by Application Outlook, 2020-2035
  • Table 48: Middle East & Africa Induced Pluripotent Stem Cells Production Market Value (USD Mn) Forecast by End Use Outlook, 2020-2035

List of Figures

  • Figure 1: Global Induced Pluripotent Stem Cells Production Market Pricing Analysis
  • Figure 2: Global Induced Pluripotent Stem Cells Production Market Value (USD Mn) Forecast 2020–2035
  • Figure 3: Global Induced Pluripotent Stem Cells Production Market Value Share and BPS Analysis by Process Outlook , 2025 and 2035
  • Figure 4: Global Induced Pluripotent Stem Cells Production Market Y-o-Y Growth Comparison by Process Outlook , 2025–2035
  • Figure 5: Global Induced Pluripotent Stem Cells Production Market Attractiveness Analysis by Process Outlook
  • Figure 6: Global Induced Pluripotent Stem Cells Production Market Value Share and BPS Analysis by Workflow Outlook, 2025 and 2035
  • Figure 7: Global Induced Pluripotent Stem Cells Production Market Y-o-Y Growth Comparison by Workflow Outlook, 2025–2035
  • Figure 8: Global Induced Pluripotent Stem Cells Production Market Attractiveness Analysis by Workflow Outlook
  • Figure 9: Global Induced Pluripotent Stem Cells Production Market Value Share and BPS Analysis by Product Outlook, 2025 and 2035
  • Figure 10: Global Induced Pluripotent Stem Cells Production Market Y-o-Y Growth Comparison by Product Outlook, 2025–2035
  • Figure 11: Global Induced Pluripotent Stem Cells Production Market Attractiveness Analysis by Product Outlook
  • Figure 12: Global Induced Pluripotent Stem Cells Production Market Value Share and BPS Analysis by Application Outlook, 2025 and 2035
  • Figure 13: Global Induced Pluripotent Stem Cells Production Market Y-o-Y Growth Comparison by Application Outlook, 2025–2035
  • Figure 14: Global Induced Pluripotent Stem Cells Production Market Attractiveness Analysis by Application Outlook
  • Figure 15: Global Induced Pluripotent Stem Cells Production Market Value Share and BPS Analysis by End Use Outlook, 2025 and 2035
  • Figure 16: Global Induced Pluripotent Stem Cells Production Market Y-o-Y Growth Comparison by End Use Outlook, 2025–2035
  • Figure 17: Global Induced Pluripotent Stem Cells Production Market Attractiveness Analysis by End Use Outlook
  • Figure 18: Global Induced Pluripotent Stem Cells Production Market Value (USD Mn) Share and BPS Analysis by Region, 2025 and 2035
  • Figure 19: Global Induced Pluripotent Stem Cells Production Market Y-o-Y Growth Comparison by Region, 2025–2035
  • Figure 20: Global Induced Pluripotent Stem Cells Production Market Attractiveness Analysis by Region
  • Figure 21: North America Induced Pluripotent Stem Cells Production Market Incremental Dollar Opportunity, 2025–2035
  • Figure 22: Latin America Induced Pluripotent Stem Cells Production Market Incremental Dollar Opportunity, 2025–2035
  • Figure 23: Western Europe Induced Pluripotent Stem Cells Production Market Incremental Dollar Opportunity, 2025–2035
  • Figure 24: Eastern Europe Induced Pluripotent Stem Cells Production Market Incremental Dollar Opportunity, 2025–2035
  • Figure 25: East Asia Induced Pluripotent Stem Cells Production Market Incremental Dollar Opportunity, 2025–2035
  • Figure 26: South Asia and Pacific Induced Pluripotent Stem Cells Production Market Incremental Dollar Opportunity, 2025–2035
  • Figure 27: Middle East & Africa Induced Pluripotent Stem Cells Production Market Incremental Dollar Opportunity, 2025–2035
  • Figure 28: North America Induced Pluripotent Stem Cells Production Market Value Share and BPS Analysis by Country, 2025 and 2035
  • Figure 29: North America Induced Pluripotent Stem Cells Production Market Value Share and BPS Analysis by Process Outlook , 2025 and 2035
  • Figure 30: North America Induced Pluripotent Stem Cells Production Market Y-o-Y Growth Comparison by Process Outlook , 2025–2035
  • Figure 31: North America Induced Pluripotent Stem Cells Production Market Attractiveness Analysis by Process Outlook
  • Figure 32: North America Induced Pluripotent Stem Cells Production Market Value Share and BPS Analysis by Workflow Outlook, 2025 and 2035
  • Figure 33: North America Induced Pluripotent Stem Cells Production Market Y-o-Y Growth Comparison by Workflow Outlook, 2025–2035
  • Figure 34: North America Induced Pluripotent Stem Cells Production Market Attractiveness Analysis by Workflow Outlook
  • Figure 35: North America Induced Pluripotent Stem Cells Production Market Value Share and BPS Analysis by Product Outlook, 2025 and 2035
  • Figure 36: North America Induced Pluripotent Stem Cells Production Market Y-o-Y Growth Comparison by Product Outlook, 2025–2035
  • Figure 37: North America Induced Pluripotent Stem Cells Production Market Attractiveness Analysis by Product Outlook
  • Figure 38: North America Induced Pluripotent Stem Cells Production Market Value Share and BPS Analysis by Application Outlook, 2025 and 2035
  • Figure 39: North America Induced Pluripotent Stem Cells Production Market Y-o-Y Growth Comparison by Application Outlook, 2025–2035
  • Figure 40: North America Induced Pluripotent Stem Cells Production Market Attractiveness Analysis by Application Outlook
  • Figure 41: North America Induced Pluripotent Stem Cells Production Market Value Share and BPS Analysis by End Use Outlook, 2025 and 2035
  • Figure 42: North America Induced Pluripotent Stem Cells Production Market Y-o-Y Growth Comparison by End Use Outlook, 2025–2035
  • Figure 43: North America Induced Pluripotent Stem Cells Production Market Attractiveness Analysis by End Use Outlook
  • Figure 44: Latin America Induced Pluripotent Stem Cells Production Market Value Share and BPS Analysis by Country, 2025 and 2035
  • Figure 45: Latin America Induced Pluripotent Stem Cells Production Market Value Share and BPS Analysis by Process Outlook , 2025 and 2035
  • Figure 46: Latin America Induced Pluripotent Stem Cells Production Market Y-o-Y Growth Comparison by Process Outlook , 2025–2035
  • Figure 47: Latin America Induced Pluripotent Stem Cells Production Market Attractiveness Analysis by Process Outlook
  • Figure 48: Latin America Induced Pluripotent Stem Cells Production Market Value Share and BPS Analysis by Workflow Outlook, 2025 and 2035
  • Figure 49: Latin America Induced Pluripotent Stem Cells Production Market Y-o-Y Growth Comparison by Workflow Outlook, 2025–2035
  • Figure 50: Latin America Induced Pluripotent Stem Cells Production Market Attractiveness Analysis by Workflow Outlook
  • Figure 51: Latin America Induced Pluripotent Stem Cells Production Market Value Share and BPS Analysis by Product Outlook, 2025 and 2035
  • Figure 52: Latin America Induced Pluripotent Stem Cells Production Market Y-o-Y Growth Comparison by Product Outlook, 2025–2035
  • Figure 53: Latin America Induced Pluripotent Stem Cells Production Market Attractiveness Analysis by Product Outlook
  • Figure 54: Latin America Induced Pluripotent Stem Cells Production Market Value Share and BPS Analysis by Application Outlook, 2025 and 2035
  • Figure 55: Latin America Induced Pluripotent Stem Cells Production Market Y-o-Y Growth Comparison by Application Outlook, 2025–2035
  • Figure 56: Latin America Induced Pluripotent Stem Cells Production Market Attractiveness Analysis by Application Outlook
  • Figure 57: Latin America Induced Pluripotent Stem Cells Production Market Value Share and BPS Analysis by End Use Outlook, 2025 and 2035
  • Figure 58: Latin America Induced Pluripotent Stem Cells Production Market Y-o-Y Growth Comparison by End Use Outlook, 2025–2035
  • Figure 59: Latin America Induced Pluripotent Stem Cells Production Market Attractiveness Analysis by End Use Outlook
  • Figure 60: Western Europe Induced Pluripotent Stem Cells Production Market Value Share and BPS Analysis by Country, 2025 and 2035
  • Figure 61: Western Europe Induced Pluripotent Stem Cells Production Market Value Share and BPS Analysis by Process Outlook , 2025 and 2035
  • Figure 62: Western Europe Induced Pluripotent Stem Cells Production Market Y-o-Y Growth Comparison by Process Outlook , 2025–2035
  • Figure 63: Western Europe Induced Pluripotent Stem Cells Production Market Attractiveness Analysis by Process Outlook
  • Figure 64: Western Europe Induced Pluripotent Stem Cells Production Market Value Share and BPS Analysis by Workflow Outlook, 2025 and 2035
  • Figure 65: Western Europe Induced Pluripotent Stem Cells Production Market Y-o-Y Growth Comparison by Workflow Outlook, 2025–2035
  • Figure 66: Western Europe Induced Pluripotent Stem Cells Production Market Attractiveness Analysis by Workflow Outlook
  • Figure 67: Western Europe Induced Pluripotent Stem Cells Production Market Value Share and BPS Analysis by Product Outlook, 2025 and 2035
  • Figure 68: Western Europe Induced Pluripotent Stem Cells Production Market Y-o-Y Growth Comparison by Product Outlook, 2025–2035
  • Figure 69: Western Europe Induced Pluripotent Stem Cells Production Market Attractiveness Analysis by Product Outlook
  • Figure 70: Western Europe Induced Pluripotent Stem Cells Production Market Value Share and BPS Analysis by Application Outlook, 2025 and 2035
  • Figure 71: Western Europe Induced Pluripotent Stem Cells Production Market Y-o-Y Growth Comparison by Application Outlook, 2025–2035
  • Figure 72: Western Europe Induced Pluripotent Stem Cells Production Market Attractiveness Analysis by Application Outlook
  • Figure 73: Western Europe Induced Pluripotent Stem Cells Production Market Value Share and BPS Analysis by End Use Outlook, 2025 and 2035
  • Figure 74: Western Europe Induced Pluripotent Stem Cells Production Market Y-o-Y Growth Comparison by End Use Outlook, 2025–2035
  • Figure 75: Western Europe Induced Pluripotent Stem Cells Production Market Attractiveness Analysis by End Use Outlook
  • Figure 76: Eastern Europe Induced Pluripotent Stem Cells Production Market Value Share and BPS Analysis by Country, 2025 and 2035
  • Figure 77: Eastern Europe Induced Pluripotent Stem Cells Production Market Value Share and BPS Analysis by Process Outlook , 2025 and 2035
  • Figure 78: Eastern Europe Induced Pluripotent Stem Cells Production Market Y-o-Y Growth Comparison by Process Outlook , 2025–2035
  • Figure 79: Eastern Europe Induced Pluripotent Stem Cells Production Market Attractiveness Analysis by Process Outlook
  • Figure 80: Eastern Europe Induced Pluripotent Stem Cells Production Market Value Share and BPS Analysis by Workflow Outlook, 2025 and 2035
  • Figure 81: Eastern Europe Induced Pluripotent Stem Cells Production Market Y-o-Y Growth Comparison by Workflow Outlook, 2025–2035
  • Figure 82: Eastern Europe Induced Pluripotent Stem Cells Production Market Attractiveness Analysis by Workflow Outlook
  • Figure 83: Eastern Europe Induced Pluripotent Stem Cells Production Market Value Share and BPS Analysis by Product Outlook, 2025 and 2035
  • Figure 84: Eastern Europe Induced Pluripotent Stem Cells Production Market Y-o-Y Growth Comparison by Product Outlook, 2025–2035
  • Figure 85: Eastern Europe Induced Pluripotent Stem Cells Production Market Attractiveness Analysis by Product Outlook
  • Figure 86: Eastern Europe Induced Pluripotent Stem Cells Production Market Value Share and BPS Analysis by Application Outlook, 2025 and 2035
  • Figure 87: Eastern Europe Induced Pluripotent Stem Cells Production Market Y-o-Y Growth Comparison by Application Outlook, 2025–2035
  • Figure 88: Eastern Europe Induced Pluripotent Stem Cells Production Market Attractiveness Analysis by Application Outlook
  • Figure 89: Eastern Europe Induced Pluripotent Stem Cells Production Market Value Share and BPS Analysis by End Use Outlook, 2025 and 2035
  • Figure 90: Eastern Europe Induced Pluripotent Stem Cells Production Market Y-o-Y Growth Comparison by End Use Outlook, 2025–2035
  • Figure 91: Eastern Europe Induced Pluripotent Stem Cells Production Market Attractiveness Analysis by End Use Outlook
  • Figure 92: East Asia Induced Pluripotent Stem Cells Production Market Value Share and BPS Analysis by Country, 2025 and 2035
  • Figure 93: East Asia Induced Pluripotent Stem Cells Production Market Value Share and BPS Analysis by Process Outlook , 2025 and 2035
  • Figure 94: East Asia Induced Pluripotent Stem Cells Production Market Y-o-Y Growth Comparison by Process Outlook , 2025–2035
  • Figure 95: East Asia Induced Pluripotent Stem Cells Production Market Attractiveness Analysis by Process Outlook
  • Figure 96: East Asia Induced Pluripotent Stem Cells Production Market Value Share and BPS Analysis by Workflow Outlook, 2025 and 2035
  • Figure 97: East Asia Induced Pluripotent Stem Cells Production Market Y-o-Y Growth Comparison by Workflow Outlook, 2025–2035
  • Figure 98: East Asia Induced Pluripotent Stem Cells Production Market Attractiveness Analysis by Workflow Outlook
  • Figure 99: East Asia Induced Pluripotent Stem Cells Production Market Value Share and BPS Analysis by Product Outlook, 2025 and 2035
  • Figure 100: East Asia Induced Pluripotent Stem Cells Production Market Y-o-Y Growth Comparison by Product Outlook, 2025–2035
  • Figure 101: East Asia Induced Pluripotent Stem Cells Production Market Attractiveness Analysis by Product Outlook
  • Figure 102: East Asia Induced Pluripotent Stem Cells Production Market Value Share and BPS Analysis by Application Outlook, 2025 and 2035
  • Figure 103: East Asia Induced Pluripotent Stem Cells Production Market Y-o-Y Growth Comparison by Application Outlook, 2025–2035
  • Figure 104: East Asia Induced Pluripotent Stem Cells Production Market Attractiveness Analysis by Application Outlook
  • Figure 105: East Asia Induced Pluripotent Stem Cells Production Market Value Share and BPS Analysis by End Use Outlook, 2025 and 2035
  • Figure 106: East Asia Induced Pluripotent Stem Cells Production Market Y-o-Y Growth Comparison by End Use Outlook, 2025–2035
  • Figure 107: East Asia Induced Pluripotent Stem Cells Production Market Attractiveness Analysis by End Use Outlook
  • Figure 108: South Asia and Pacific Induced Pluripotent Stem Cells Production Market Value Share and BPS Analysis by Country, 2025 and 2035
  • Figure 109: South Asia and Pacific Induced Pluripotent Stem Cells Production Market Value Share and BPS Analysis by Process Outlook , 2025 and 2035
  • Figure 110: South Asia and Pacific Induced Pluripotent Stem Cells Production Market Y-o-Y Growth Comparison by Process Outlook , 2025–2035
  • Figure 111: South Asia and Pacific Induced Pluripotent Stem Cells Production Market Attractiveness Analysis by Process Outlook
  • Figure 112: South Asia and Pacific Induced Pluripotent Stem Cells Production Market Value Share and BPS Analysis by Workflow Outlook, 2025 and 2035
  • Figure 113: South Asia and Pacific Induced Pluripotent Stem Cells Production Market Y-o-Y Growth Comparison by Workflow Outlook, 2025–2035
  • Figure 114: South Asia and Pacific Induced Pluripotent Stem Cells Production Market Attractiveness Analysis by Workflow Outlook
  • Figure 115: South Asia and Pacific Induced Pluripotent Stem Cells Production Market Value Share and BPS Analysis by Product Outlook, 2025 and 2035
  • Figure 116: South Asia and Pacific Induced Pluripotent Stem Cells Production Market Y-o-Y Growth Comparison by Product Outlook, 2025–2035
  • Figure 117: South Asia and Pacific Induced Pluripotent Stem Cells Production Market Attractiveness Analysis by Product Outlook
  • Figure 118: South Asia and Pacific Induced Pluripotent Stem Cells Production Market Value Share and BPS Analysis by Application Outlook, 2025 and 2035
  • Figure 119: South Asia and Pacific Induced Pluripotent Stem Cells Production Market Y-o-Y Growth Comparison by Application Outlook, 2025–2035
  • Figure 120: South Asia and Pacific Induced Pluripotent Stem Cells Production Market Attractiveness Analysis by Application Outlook
  • Figure 121: South Asia and Pacific Induced Pluripotent Stem Cells Production Market Value Share and BPS Analysis by End Use Outlook, 2025 and 2035
  • Figure 122: South Asia and Pacific Induced Pluripotent Stem Cells Production Market Y-o-Y Growth Comparison by End Use Outlook, 2025–2035
  • Figure 123: South Asia and Pacific Induced Pluripotent Stem Cells Production Market Attractiveness Analysis by End Use Outlook
  • Figure 124: Middle East & Africa Induced Pluripotent Stem Cells Production Market Value Share and BPS Analysis by Country, 2025 and 2035
  • Figure 125: Middle East & Africa Induced Pluripotent Stem Cells Production Market Value Share and BPS Analysis by Process Outlook , 2025 and 2035
  • Figure 126: Middle East & Africa Induced Pluripotent Stem Cells Production Market Y-o-Y Growth Comparison by Process Outlook , 2025–2035
  • Figure 127: Middle East & Africa Induced Pluripotent Stem Cells Production Market Attractiveness Analysis by Process Outlook
  • Figure 128: Middle East & Africa Induced Pluripotent Stem Cells Production Market Value Share and BPS Analysis by Workflow Outlook, 2025 and 2035
  • Figure 129: Middle East & Africa Induced Pluripotent Stem Cells Production Market Y-o-Y Growth Comparison by Workflow Outlook, 2025–2035
  • Figure 130: Middle East & Africa Induced Pluripotent Stem Cells Production Market Attractiveness Analysis by Workflow Outlook
  • Figure 131: Middle East & Africa Induced Pluripotent Stem Cells Production Market Value Share and BPS Analysis by Product Outlook, 2025 and 2035
  • Figure 132: Middle East & Africa Induced Pluripotent Stem Cells Production Market Y-o-Y Growth Comparison by Product Outlook, 2025–2035
  • Figure 133: Middle East & Africa Induced Pluripotent Stem Cells Production Market Attractiveness Analysis by Product Outlook
  • Figure 134: Middle East & Africa Induced Pluripotent Stem Cells Production Market Value Share and BPS Analysis by Application Outlook, 2025 and 2035
  • Figure 135: Middle East & Africa Induced Pluripotent Stem Cells Production Market Y-o-Y Growth Comparison by Application Outlook, 2025–2035
  • Figure 136: Middle East & Africa Induced Pluripotent Stem Cells Production Market Attractiveness Analysis by Application Outlook
  • Figure 137: Middle East & Africa Induced Pluripotent Stem Cells Production Market Value Share and BPS Analysis by End Use Outlook, 2025 and 2035
  • Figure 138: Middle East & Africa Induced Pluripotent Stem Cells Production Market Y-o-Y Growth Comparison by End Use Outlook, 2025–2035
  • Figure 139: Middle East & Africa Induced Pluripotent Stem Cells Production Market Attractiveness Analysis by End Use Outlook
  • Figure 140: Global Induced Pluripotent Stem Cells Production Market – Tier Structure Analysis
  • Figure 141: Global Induced Pluripotent Stem Cells Production Market – Company Share Analysis

Frequently Asked Questions

How big is the induced pluripotent stem cells production market in 2025?

The global induced pluripotent stem cells production market is estimated to be valued at USD 1.7 billion in 2025.

What will be the size of induced pluripotent stem cells production market in 2035?

The market size for the induced pluripotent stem cells production market is projected to reach USD 4.4 billion by 2035.

How much will be the induced pluripotent stem cells production market growth between 2025 and 2035?

The induced pluripotent stem cells production market is expected to grow at a 10.0% CAGR between 2025 and 2035.

What are the key product types in the induced pluripotent stem cells production market ?

The key product types in induced pluripotent stem cells production market are manual ipsc production process and automated ipsc production process.

Which workflow outlook segment to contribute significant share in the induced pluripotent stem cells production market in 2025?

In terms of workflow outlook, cell culture segment to command 37.3% share in the induced pluripotent stem cells production market in 2025.

Explore Similar Insights

Future Market Insights

Induced Pluripotent Stem Cells Production Market

Chat With

MaRIA

Hi There, I am MaRIA, Your Market Research Intelligence Assistant. How may I help you?