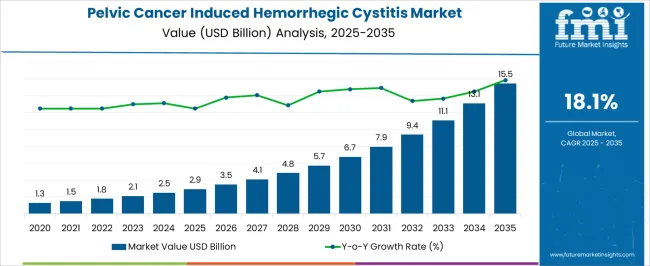
The Pelvic Cancer Induced Hemorrhegic Cystitis Market is estimated to be valued at USD 2.9 billion in 2025 and is projected to reach USD 15.5 billion by 2035, registering a compound annual growth rate (CAGR) of 18.1% over the forecast period.

| Metric | Value |
|---|---|
| Pelvic Cancer Induced Hemorrhegic Cystitis Market Estimated Value in (2025 E) | USD 2.9 billion |
| Pelvic Cancer Induced Hemorrhegic Cystitis Market Forecast Value in (2035 F) | USD 15.5 billion |
| Forecast CAGR (2025 to 2035) | 18.1% |
The Pelvic Cancer Induced Hemorrhegic Cystitis market is gaining momentum due to the increasing incidence of pelvic malignancies and the growing use of aggressive treatment modalities. The current market landscape is influenced by advancements in cancer care that have prolonged survival rates but introduced complications such as hemorrhagic cystitis, particularly in patients receiving pelvic irradiation or chemotherapy.
Clinical updates and oncology conference data suggest that the demand for effective management strategies has intensified, as physicians seek to balance therapeutic outcomes with patient quality of life. Regulatory bodies and healthcare systems have been prioritizing supportive care interventions, creating a favorable environment for innovation in both pharmacological and non-pharmacological solutions.
Technological progress in treatment delivery and a growing focus on integrated oncology care are expected to shape future growth These factors, along with a higher number of patients undergoing radiation-based treatments globally, are contributing to a sustained need for targeted solutions in this therapeutic space.
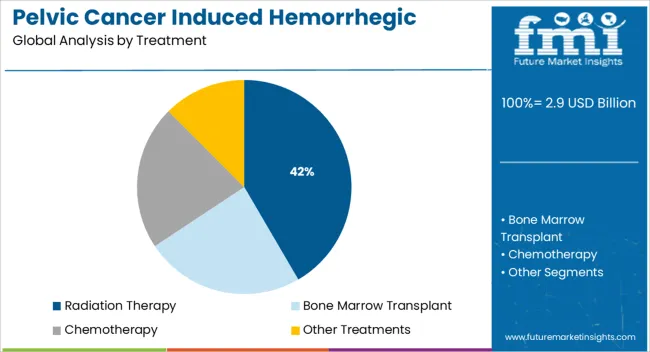
The market is segmented by Treatment and region. By Treatment, the market is divided into Radiation Therapy, Bone Marrow Transplant, Chemotherapy, and Other Treatments. Regionally, the market is classified into North America, Latin America, Western Europe, Eastern Europe, Balkan & Baltic Countries, Russia & Belarus, Central Asia, East Asia, South Asia & Pacific, and the Middle East & Africa.

The radiation therapy segment is expected to account for 41.6% of the Pelvic Cancer Induced Hemorrhegic Cystitis market revenue share in 2025, making it the leading treatment segment. This dominance has been driven by the extensive use of pelvic radiation in managing cancers of the bladder, prostate, cervix, and rectum. Reports from clinical oncology forums and hospital case studies indicate that radiation remains a standard component of curative and palliative treatment regimens, despite its association with late-onset complications such as hemorrhagic cystitis.
The growing number of patients undergoing radiotherapy, combined with rising cancer prevalence, has resulted in an increased incidence of treatment-induced bladder inflammation and bleeding. Hospitals and specialty centers have been investing in mitigation protocols and supportive therapies, reinforcing demand for radiation-associated cystitis management.
Additionally, enhanced survival outcomes due to modern radiation planning techniques have inadvertently contributed to long-term toxicities, thereby sustaining the relevance of this segment in ongoing clinical care This convergence of factors has supported the segment’s continued leadership within the market.
The Pelvic Cancer Induced Hemorrhagic Cystitis Market was worth around USD 1.3 Billion in 2020 while growing at a CAGR of 12.7%. The emergence and popularity of targeted therapy.
The rapid strides made in drug targeting techniques have allowed physicians to inject drugs directly into the bladder containing tumors which are aiding in market expansion. Considering these factors, the market is estimated to grow with a CAGR of 18.01%, reaching a valuation of USD 11 billion by end of the forecast period.
Strategic Initiatives Adopted by Market Players
Bladder disorders are a number of bladder issues that can affect daily physical activities. The most common bladder disorders are cystitis, interstitial cystitis, overactive bladder, urinary incontinence, and bladder cancer. Most bladder issues are caused by a bacterial infection that enters the urinary tract.
Various strategic initiatives by the market players in terms of collaboration, acquisition, partnership, and others, encourages them to increase their company's product portfolio, leading to market expansion and hence improving the product demand among customers, which ultimately provides the market players to earn maximum revenue. Thus, leading to market growth.
Rising Research and Development Investments and Launch of Novel Therapies in Upcoming Years to Augment Growth
Various treatment options and innovative therapies are available for OAB and other bladder disorders. Many biopharmaceutical and pharmaceutical companies are investing in various unconventional therapies for bladder disorders, which are expected to fuel market expansion.
Combination of Different Target Therapies
Combination Therapies are much more effective than monotherapy, without additional adverse effects. Combination Therapies are a safe and effective alternative for individuals with Cystitis bladder conditions. Combining different target therapy strategies is the best approach to relieving patients of Hemorrhagic Cystitis. Oral medication and behavioral therapy should be considered for the patients' refractory treatment. Various advanced target therapies are available such as sacral neuromodulation, intradetrusor injection of a botulinum toxin A, and percutaneous tibial nerve stimulation. These are advanced treatments and more effective as compared to oral agents which are aiding in market growth.
In addition to this, the growing need for advanced healthcare services, backed by growing concern for the prevalence of chronic diseases amongst individuals is also anticipated to drive the growth of the market. Moreover, the numerous opportunities generated by the surge in the price of medical goods and services in the healthcare industry in various nations are also projected to contribute to the growth of the market during the forecast period.
The challenges in diagnosing the disease and the cost of the treatments and diagnostics are high due to the procedure of various checkpoints along with the high-tech technologies and modalities to perform the procedures.
The cost of the procedure generally gets raised because of the high cost of the advanced technological devices used in the treatment, which is anticipated to restrain the market growth.

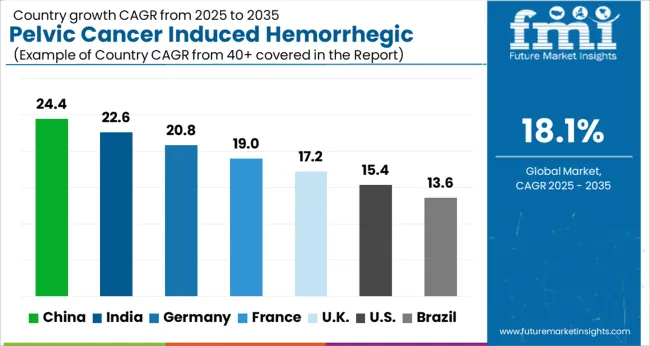
The USA held the dominant share in the pelvic cancer-induced hemorrhagic cystitis market in this region. The market in this region is expected to be valued at USD 2.9 Million in 2025, and it will reach USD 3.6 Billion by end of the forecast period while growing at a CAGR of 14.87%. Factors such as the presence of a large target population, rising adoption of novel therapeutics, and multiple product launches are anticipated to boost the growth of the market over the forecast period.
With the increasing burden of bladder and pelvic cancer, the burden of Hemorrhagic Cystitis is also expected to increase. This in turn is likely to increase the demand for its treatment thereby propelling the market growth over the forecast period.
Additionally, several strategies adopted by the key market players are also assisting in market growth. For instance, in June 2024, Pfizer received the United States Food and Drug Administration approval for BAVENCIO. It has been approved as a first-line maintenance treatment among patients suffering from advanced/metastatic urothelial carcinoma. Furthermore, in April 2024, UroGen Pharma received the United States Food and Drug Administration approval for mitomycin gel (Jelmyto), which has been designated for the treatment of low-grade upper tract urothelial cancer. Therefore, increasing approvals from the United States Food and Drug Administration and product launches by key players are anticipated to boost market growth.
APAC is anticipated to experience a high growth rate in the hemorrhagic Cystitis treatment drugs market in the next few years due to a rise in Pelvic cancer cases, a growing need for improved bladder cancer treatments and therapies, increasing awareness about cancer diagnosis, an increase in health care expenditure, and developing health care infrastructure in the region. The market in this region will grow at a CAGR of 15.1% and will reach a valuation of USD 3400 million by end of the forecast period.
Growth in pelvic cancer cases, technological advancements, drug innovations regarding the treatment of pelvic cancer, government initiatives, a rise in the aging population, and advanced healthcare services is expected to propel the market for pelvic cancer-induced hemorrhagic cystitis treatment drugs.
China offers strong avenues for market expansion. Factors such as high unmet clinical needs and the presence of a large target population are anticipated to propel the market in this region. Several local players are currently evaluating products as second/third-line treatments in Phase II trials and are well-positioned to be launched in the China market in the upcoming years which will support growth in this region.
Treatment by Chemotherapy accounts for almost 2/3rd the share in treating hemorrhagic cystitis. Various chemotherapeutic agents, including ifosfamide, cyclophosphamide, busulfan, doxorubicin, dacarbazine, fludarabine, and cabazitaxel, can cause either non-hemorrhagic or hemorrhagic cystitis. The high approval rate of Ifosfamide and cyclophosphamide for use in a variety of malignancies, both in children and adults driving the market for Hemorrhagic Cystitis.
Cyclophosphamide is also used as a component of conditioning regimens prior to hematopoietic cell transplantation and as an immunosuppressant in a variety of rheumatologic (eg, autoimmune disease, vasculitis), nephrology (eg, minimal change nephrotic syndrome), dermatologic (eg, refractory pemphigus), and neurologic (eg, relapsing/remitting multiple sclerosis) conditions.
The radiation therapy for the treatment of Pelvic Cancer induced Hemorrhagic Cystitis Market is expected to account for around 25% segment share by end of the forecast period.

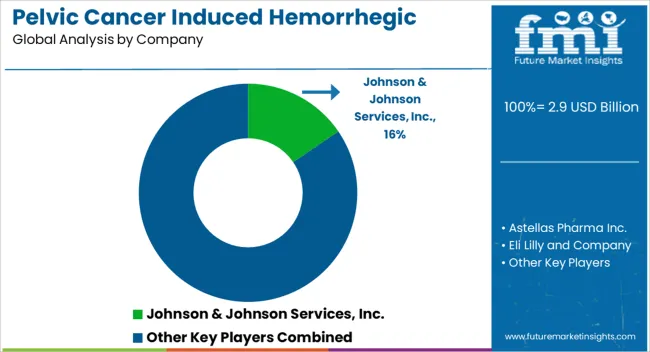
Key players in Pelvic cancer induced hemorrhagic Cystitis Market are Johnson & Johnson Services, Inc, Astellas Pharma Inc, Eli Lilly and Company, Sanofi, Ipsen Pharma, Bayer AG, AstraZeneca, Valeant Pharmaceuticals International, Inc, Merck & Co., Inc., Pfizer Inc.
| Report Attribute | Details |
|---|---|
| Market Value in 2025 | USD 2.9 billion |
| Market Value in 2035 | USD 15.5 billion |
| Growth Rate | CAGR of 18.01% from 2025 to 2035 |
| Base Year for Estimation | 2025 |
| Historical Data | 2020 to 2025 |
| Forecast Period | 2025 to 2035 |
| Quantitative Units | Revenue in USD Billion and CAGR from 2025 to 2035 |
| Report Coverage | Revenue Forecast, Volume Forecast, Company Ranking, Competitive Landscape, Growth Factors, Trends, and Pricing Analysis |
| Segments Covered | Treatment, Region |
| Regions Covered | North America; Latin America; Europe; Asia Pacific; Middle East & Africa (MEA) |
| Key Countries Profiled | The USA, Canada, Brazil, Mexico, Germany, The UK, France, Spain, Russia, Italy, India, China, Japan, South Korea, Saudi Arabia, Australia, UAE, South Africa, Israel |
| Key Companies Profiled | Johnson & Johnson Services, Inc.; Astellas Pharma Inc.; Eli Lily and Company; Sanofi; Ipsen Pharma; Bayer AG; AstraZeneca; Valeant Pharmaceuticals International, Inc.; Merck & Co., Inc.; Pfizer Inc. |
| Customization | Available Upon Request |
The global pelvic cancer induced hemorrhegic cystitis market is estimated to be valued at USD 2.9 billion in 2025.
The market size for the pelvic cancer induced hemorrhegic cystitis market is projected to reach USD 15.5 billion by 2035.
The pelvic cancer induced hemorrhegic cystitis market is expected to grow at a 18.1% CAGR between 2025 and 2035.
The key product types in pelvic cancer induced hemorrhegic cystitis market are radiation therapy, bone marrow transplant, chemotherapy, _cyclophosphamide, _ifosfamide and other treatments.
In terms of , segment to command 0.0% share in the pelvic cancer induced hemorrhegic cystitis market in 2025.


Our Research Products

The "Full Research Suite" delivers actionable market intel, deep dives on markets or technologies, so clients act faster, cut risk, and unlock growth.

The Leaderboard benchmarks and ranks top vendors, classifying them as Established Leaders, Leading Challengers, or Disruptors & Challengers.

Locates where complements amplify value and substitutes erode it, forecasting net impact by horizon

We deliver granular, decision-grade intel: market sizing, 5-year forecasts, pricing, adoption, usage, revenue, and operational KPIs—plus competitor tracking, regulation, and value chains—across 60 countries broadly.

Spot the shifts before they hit your P&L. We track inflection points, adoption curves, pricing moves, and ecosystem plays to show where demand is heading, why it is changing, and what to do next across high-growth markets and disruptive tech

Real-time reads of user behavior. We track shifting priorities, perceptions of today’s and next-gen services, and provider experience, then pace how fast tech moves from trial to adoption, blending buyer, consumer, and channel inputs with social signals (#WhySwitch, #UX).

Partner with our analyst team to build a custom report designed around your business priorities. From analysing market trends to assessing competitors or crafting bespoke datasets, we tailor insights to your needs.
Supplier Intelligence
Discovery & Profiling
Capacity & Footprint
Performance & Risk
Compliance & Governance
Commercial Readiness
Who Supplies Whom
Scorecards & Shortlists
Playbooks & Docs
Category Intelligence
Definition & Scope
Demand & Use Cases
Cost Drivers
Market Structure
Supply Chain Map
Trade & Policy
Operating Norms
Deliverables
Buyer Intelligence
Account Basics
Spend & Scope
Procurement Model
Vendor Requirements
Terms & Policies
Entry Strategy
Pain Points & Triggers
Outputs
Pricing Analysis
Benchmarks
Trends
Should-Cost
Indexation
Landed Cost
Commercial Terms
Deliverables
Brand Analysis
Positioning & Value Prop
Share & Presence
Customer Evidence
Go-to-Market
Digital & Reputation
Compliance & Trust
KPIs & Gaps
Outputs
Full Research Suite comprises of:
Market outlook & trends analysis
Interviews & case studies
Strategic recommendations
Vendor profiles & capabilities analysis
5-year forecasts
8 regions and 60+ country-level data splits
Market segment data splits
12 months of continuous data updates
DELIVERED AS:
PDF EXCEL ONLINE
Cancer Registry Software Market Size and Share Forecast Outlook 2025 to 2035
Cancer Biological Therapy Market Size and Share Forecast Outlook 2025 to 2035
Induced Pluripotent Stem Cells Production Market Size and Share Forecast Outlook 2025 to 2035
Cancer Diagnostics Market Analysis - Size, Share and Forecast 2025 to 2035
Cancer Biopsy Market - Growth & Technological Innovations 2025 to 2035
Pelvic Floor Diagnostics Market - Demand & Forecast 2025 to 2035
Pelvic Reconstruction Market - Growth & Demand 2025 to 2035
Pelvic Floor Stimulators Market – Trends & Forecast 2025 to 2035
Cancer Vaccines Market Analysis by Technology, Treatment Method, Application and Region from 2025 to 2035
Cancer Gene Therapy Market Overview – Trends & Future Outlook 2024-2034
Cancer-focused Genetic Testing Service Market Analysis – Growth & Industry Insights 2024-2034
Cancer Tissue Diagnostic Market Trends – Growth & Industry Forecast 2024-2034
Cancer Supportive Care Products Market Trends – Growth & Forecast 2020-2030
Cancer Antigens Market
Pelvic Inflammatory Disease Therapeutics Market
Pelvic Floor Diagnostic Testing Market
Pet Cancer Therapeutics Market Insights - Growth & Forecast 2024 to 2034
Skin Cancer Detection Devices Market Size and Share Forecast Outlook 2025 to 2035
Lung Cancer Diagnostics Market Size and Share Forecast Outlook 2025 to 2035
Lung Cancer Surgery Market - Size, Share, and Forecast 2025 to 2035

Thank you!
You will receive an email from our Business Development Manager. Please be sure to check your SPAM/JUNK folder too.
Chat With
MaRIA