Radiation-Induced Myelosuppression Treatment Market Size and Share Forecast Outlook 2025 to 2035

The Radiation-Induced Myelosuppression Treatment Market is estimated to be valued at USD 3.2 billion in 2025 and is projected to reach USD 4.3 billion by 2035, registering a compound annual growth rate (CAGR) of 3.1% over the forecast period.
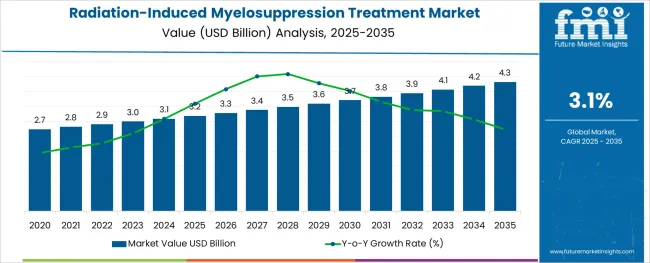
Quick Stats for Radiation-Induced Myelosuppression Treatment Market

  • Radiation-Induced Myelosuppression Treatment Market Industry Value (2025): USD 3.2 billion
  • Radiation-Induced Myelosuppression Treatment Market Forecast Value (2035): USD 4.3 billion
  • Radiation-Induced Myelosuppression Treatment Market Forecast CAGR: 3.1%
  • Leading Segment in Radiation-Induced Myelosuppression Treatment Market in 2025: Neutropenia (45.3%)
  • Key Growth Region in Radiation-Induced Myelosuppression Treatment Market: North America, Asia-Pacific, Europe
  • Top Key Players in Radiation-Induced Myelosuppression Treatment Market: Amgen Inc., Novartis AG, Teva Pharmaceutical Industries Ltd, Mylan N.V., Pfizer Inc., Janssen Global Services, LLC (Johnson & Johnson), Partner Therapeutics, Inc., Mission Pharmacal Company, Myelo Therapeutics GmbH, Pluristem Therapeutics Inc.

Radiation Induced Myelosuppression Treatment Market

Rationale for Segmental Growth in the Radiation-Induced Myelosuppression Treatment Market

Market Overview

The radiation-induced myelosuppression treatment market is expanding as the incidence of radiation therapy increases in cancer care. Management of side effects like neutropenia has become critical to ensure patients can safely complete treatment regimens. Medical insights emphasize the importance of supportive care to reduce infection risk and improve patient outcomes during therapy.

Growth in oncology treatments and rising awareness about radiation-induced complications have driven demand for effective management solutions. Advances in drug formulations and administration techniques have improved patient adherence and comfort.

Healthcare systems are also prioritizing early intervention to prevent severe myelosuppression and related hospitalizations. Looking forward, the market is expected to grow further due to ongoing clinical developments and expanding radiation therapy applications. Segmental growth is anticipated to be led by neutropenia as the primary indication, growth factors as the preferred drug class, and injectable routes of administration for their rapid and targeted therapeutic effect.

Segmental Analysis

The market is segmented by Indication, Drug Class, Route of Administration, and Distribution Channel and region. By Indication, the market is divided into Neutropenia, Anemia, and Thrombocytopenia. In terms of Drug Class, the market is classified into Growth factors, Erythropoietin stimulating agents, Thrombopoietic agents, and Iron supplements. Based on Route of Administration, the market is segmented into Injectable and Oral. By Distribution Channel, the market is divided into Hospital pharmacies, Retail pharmacies, Online pharmacies, and Drug stores. Regionally, the market is classified into North America, Latin America, Western Europe, Eastern Europe, Balkan & Baltic Countries, Russia & Belarus, Central Asia, East Asia, South Asia & Pacific, and the Middle East & Africa.
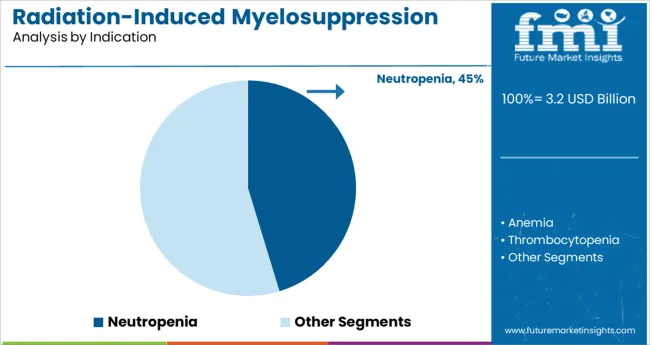
Insights into the Indication Segment: Neutropenia

Radiation Induced Myelosuppression Treatment Market Analysis By Indication

The neutropenia segment is projected to represent 45.3% of the market revenue in 2025, establishing itself as the leading indication. This segment’s growth is driven by the high incidence of neutropenia as a common dose-limiting toxicity in radiation therapy. Healthcare providers prioritize managing neutropenia to reduce infection risks and treatment interruptions.

The segment benefits from standardized clinical protocols focusing on neutrophil count restoration and immune support. Early diagnosis and proactive management have increased demand for targeted treatments within this indication.

As radiation therapies expand in scope, neutropenia management remains a crucial clinical focus, ensuring this segment’s sustained growth.
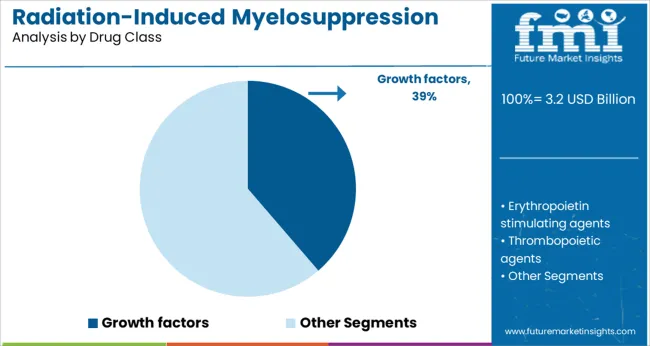
Insights into the Drug Class Segment: Growth Factors

Radiation Induced Myelosuppression Treatment Market Analysis By Drug Class

Growth factors are expected to account for 38.7% of the market revenue in 2025, maintaining their position as the dominant drug class. Their role in stimulating bone marrow recovery and enhancing neutrophil production makes them central to managing radiation-induced myelosuppression.

These drugs have been widely adopted due to their efficacy in reducing the duration and severity of neutropenia. Treatment protocols often incorporate growth factors as standard supportive care to minimize infection risk and improve patient resilience.

Ongoing research into optimized dosing and new formulations continues to reinforce the importance of this drug class. As the demand for effective myelosuppression management grows, growth factors are anticipated to retain their leading role.
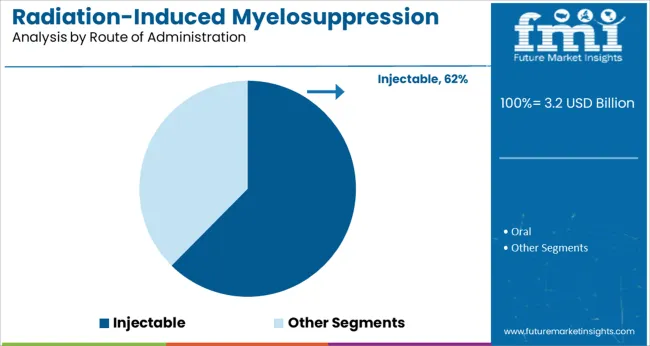
Insights into the Route of Administration Segment: Injectable

Radiation Induced Myelosuppression Treatment Market Analysis By Route Of Administration

The injectable segment is projected to hold 62.4% of the market revenue in 2025, positioning it as the preferred route of administration. The injectable form allows for rapid delivery and precise dosing, which is critical in managing acute myelosuppressive conditions.

Clinicians favor this route for its ability to provide immediate therapeutic effects and enable controlled administration in clinical settings. Patient adherence is also enhanced through supervised injections, particularly in hospital or outpatient care environments.

Injectable therapies have been developed with improved safety profiles to minimize adverse effects. Given the need for effective and timely intervention in radiation-induced myelosuppression, the injectable route is expected to remain the dominant choice for drug delivery.

How The Market Progressed Till June 2022?

Particulars Details
H1, 2024 3.42%
H1, 2025 Projected 3.12%
H1, 2025 Outlook 2.62%
BPS Change - H1, 2025 (O) - H1, 2025 (P) (-) 50 ↓
BPS Change - H1, 2025 (O) - H1, 2024 (-) 80 ↓

Future Market Insights presents a comparative analysis about the market growth rates and development prospects in the global market. According to FMI analysis, the radiation-induced myelosuppression treatment market is expected to drop by 80 Basis Point Share (BPS) in H1- 2025 compared to H1-2024.

However, BPS change of only 50 BPS was observed when comparing H1-2025 Outlook and H1-2025 Projected growth. Key reason for this dip in BPS is attributed to the factor such as stringent government regulations and approval process for pipeline products, which impacted the growth of the market.

However, some positive factors which will influence the market growth in future include new developments and introduction of novel therapeutics for treatment of radiation induced myelosuppression. For instance, on Feb 2024, FDA approved trilaciclib (Cosela, G1 Therapeutics) for lowering the rate of chemotherapy-induced myelosuppression (CIM) in adult patients suffering from extensive-stage small-cell lung cancer (ES-SCLC).

2013 to 2021 Radiation-Induced Myelosuppression Treatment Market Outlook in Comparison to 2022 to 2028 Growth Forecast

Demand in the radiation-induced myelosuppression treatment market is projected to increase at a 3.1% CAGR, in comparison to the 3.4% CAGR registered between 2013 to 2035.

The availability of various growth factors and favorable treatment guidelines have made the management of neutropenia easier. However, thrombocytopenia and anemia are still posing a burden on the healthcare system.

Thrombocytopenia can be managed with the help of available growth factors, but most of them are off-label. The management of anemia remains a challenge for cancer patients who receive radiation therapy for cancer treatment.

Due to changes in reimbursement and labeling of medications for anemia, the use of off-label indication erythropoietin-stimulating agents has decreased to an extent. This has resulted in growing need for blood transfusion, which is associated with various risk factors.

This, in turn, is underscoring the significance of myelosuppression treatment therapeutics and drugs, which is expected to boost the market over the assessment period.

How is the Introduction of Novel Therapeutics for Myelosuppression Treatment Fueling Sales?

Anemia is a common consequence of chronic kidney diseases (CKD) and radiation-induced myelosuppression. Due to the insufficiency of erythropoietin synthesis, patients suffer from anemia. However, the combination of erythropoiesis-stimulating agents (ESA) and iron has become a standard treatment for anemia.

ESAs effectively increase the hemoglobin (Hb) levels in patients. However, their use has been associated with increased cardiovascular risk, especially due to high dose intake in inflamed and hyporesponsive patients.

Iron deficiency is another consequence of anemia. This has resulted in the introduction of intravenous iron therapy which is beneficial for anemic patients, CKD patients, and patients dealing with heart failure.

A new class of drugs, namely prolyl hydroxylase domain (PHD) inhibitors is now available for the treatment of anemia. These drugs effectively stimulate the synthesis of endogenous erythropoietin and increase iron availability.

In addition to this, in February, the USA Food and Drug Administration (FDA)approved Cosela (Trilaciclib) as the first line of treatment in its class to reduce the frequency of bone marrow suppression in adults, which is caused by chemotherapy for the extensive stage.

Such developments are expected to provide impetus to the growth of the market over the assessment period, opines FMI.
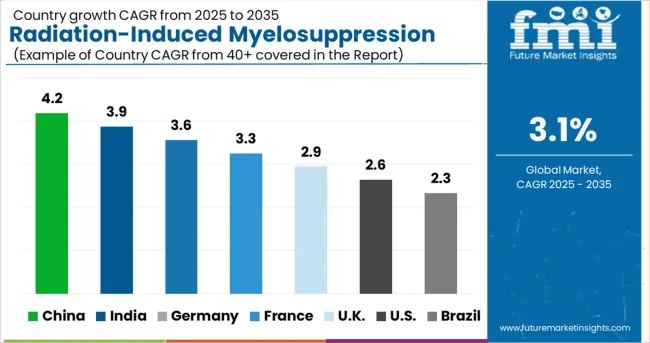
Country-wise Insights

Radiation Induced Myelosuppression Treatment Market Cagr Analysis By Country

What Will be the USA Radiation-Induced Myelosuppression Treatment Market Outlook?

High Prevalence of Chemotherapy Induced Myelosuppression Will Spur Demand in the USA

The USA is expected to dominate the North America radiation-induced myelosuppression treatment market owing to growing incidence of cancer, chronic kidney diseases (CKD), and patients dealing with heart failure.

The presence of leading market players and fast-tracked approvals by the FDA are expected to augment the growth of the USA market. In addition to this, the USA is home to a vast healthcare sector, which is expected to provide opportunities for growth to market players over the assessment period.

What is Driving the China Radiation-Induced Myelosuppression Treatment Market?

Healthcare Providers are Prescribing Myelosuppressive Chemotherapy Drugs To improve Bone Marrow Function

China is expected to account for a lion’s share of the East Asia radiation-induced myelosuppression treatment market. Increasing geriatric population in the country, along with high incidence of cancer and heart failure are spurring the demand for myelosuppression treatment drugs.

Further, increasing research and development activities for the development of iron deficiency treatment is expected to augment the growth of the market. Iron deficiency is a consequence of anemia caused by chemotherapy radiation.

Growing preference for erythropoiesis-stimulating agents (ESAs) for iron deficiency in the country is anticipated to boost the market in the forthcoming years.

How Will the UK Radiation-Induced Myelosuppression Treatment Market Fare?

Surging Trend of Medical Tourism Will Boost Sales of Myelosuppression Chemotherapy Drugs

The UK is expected to emerge as a lucrative pocket in the Europe radiation-induced myelosuppression treatment market owing to the influx of medical tourists in the country, along with the availability of superior healthcare facilities.

Increasing adoption of technologically advanced medical equipment for the treatment of various chronic disorders such and cancer and kidney failure in the country is expected to augment the growth of the market in the forthcoming years.

Further, rising awareness regarding adjuvant treatment for cancer in the UK will continue boosting the market over the assessment period.

Category-wise Insights

Which Indication Segment is Most Lucrative?

Surging Incidence of Neutropenia to Drive Preference for Myelosuppression Treatment Regimen

Based on indication, sales in the neutropenia segment are projected to account for 43.3% of the total market share in 2025. Neutropenia is a condition where an individual deals with abnormally low counts of white blood cells.

Bone marrow malfunction caused by chemotherapy radiations is a chief factor driving sales in this segment. Lack of white blood cells in patients weakens the immune system and their ability to fight infections, which makes it imperative to seek treatment for the same.

Owing to the aforementioned factors, sales in this segment are projected to increase at a considerable pace over the assessment period.

Why is the Demand for Erythropoietin Stimulating Agents (ESAs) High?

Rising Awareness Regarding New Erythropoietin Stimulating Agents Will Bolster Sales

In terms of drug class, demand in the erythropoietin stimulating agents (ESA) segment is projected to remain high over the assessment period. ESAs effectively improve the efficacy of iron therapy in anemic patients after chemotherapy radiations, which is expected to continue pushing sales in the market.

Besides this, growing preference for intravenous iron therapy with a combination of ESAs is expected to complement the growth of the market in the forthcoming years. The combination of ESAs and IV iron therapy improve the red blood cells count as compared to other treatment using ESAs alone.

Which is the Leading Distribution Channel and Route of Administration?

Sales of Myelosuppression Chemotherapy Drugs to Remain High Via Hospital Pharmacies

Based on the sales channel, sales in the hospital pharmacies segment are projected to increase at a considerable pace owing to the wide availability of therapeutic drugs in these shops. However, high convenience and timely delivery offered by online pharmacies will place them as a lucrative segment over the assessment period.

Which is the Preferred Route of Administration?

Oral Route of Administration for Myelosuppression Chemotherapy Medication to Gain Traction

In terms of route of administration, the oral route is expected to be preferred by both healthcare professionals and patients owing to ease of administration and high efficacy. Growing preference for non-invasive treatment options will also provide impetus to sales in this segment.
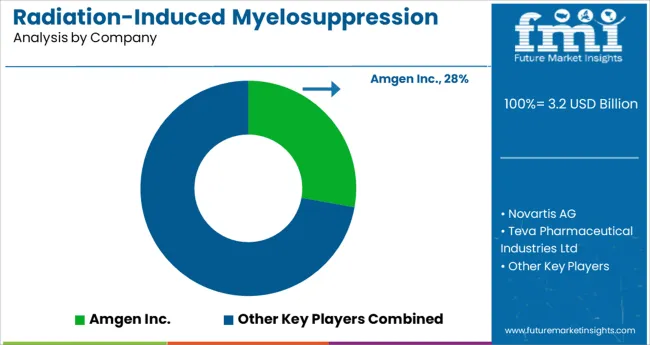
Competition Landscape

Radiation Induced Myelosuppression Treatment Market Analysis By Company

Leading players operating in the global radiation-induced myelosuppression treatment market are investing in research and development to improve lines of treatment for myelosuppression treatment. In addition to this, players are investing in mergers and acquisitions to strengthen their distribution channels.

Scope of Report

Attribute Details
Forecast Period 2025 to 2035
Historical Data Available for 2013 to 2024
Market Analysis Units for Volume and million for Value
Key Regions Covered North America; Latin America; Europe; East Asia; South Asia; Oceania, and MEA
Key Countries Covered United States, Canada, Brazil, Mexico, Germany, UK, France, Italy, Spain, Nordic, Russia, Poland, China, India, Thailand, Indonesia, Australia and New Zealand, Japan, GCC countries, North Africa, South Africa, others.
Key Market Segments Covered Indication, Drug Class, Route of Administration, Distribution Channel, and Region
Key Companies Profiled Amgen Inc.; Novartis AG; Teva Pharmaceutical Industries Ltd; Mylan N.V.; Pfizer Inc.; Janssen Global Services, LLC (Johnson & Johnson); Partner Therapeutics, Inc.; Mission Pharmacal Company; Myelo Therapeutics GmbH; Pluristem Therapeutics Inc.
Pricing Available upon Request

Radiation-Induced Myelosuppression Treatment Market by Category

Indication:

  • Neutropenia
  • Anemia
  • Thrombocytopenia

Drug Class:

  • Growth factors
  • Erythropoietin stimulating agents
  • Thrombopoietic agents
  • Iron supplements

Route of Administration:

  • Oral
  • Injectable

Distribution Channel:

  • Hospital pharmacies
  • Retail pharmacies
  • Online pharmacies
  • Drug stores

Region:

  • North America
  • Latin America
  • Europe
  • East Asia
  • South Asia
  • Oceania
  • Middle East & Africa

Table of Content

  1. Executive Summary
    • Global Market Outlook
    • Demand-side Trends
    • Supply-side Trends
    • Technology Roadmap Analysis
    • Analysis and Recommendations
  2. Market Overview
    • Market Coverage / Taxonomy
    • Market Definition / Scope / Limitations
  3. Market Background
    • Market Dynamics
      • Drivers
      • Restraints
      • Opportunity
      • Trends
    • Scenario Forecast
      • Demand in Optimistic Scenario
      • Demand in Likely Scenario
      • Demand in Conservative Scenario
    • Opportunity Map Analysis
    • Product Life Cycle Analysis
    • Supply Chain Analysis
    • Investment Feasibility Matrix
    • Value Chain Analysis
    • PESTLE and Porter’s Analysis
    • Regulatory Landscape
    • Regional Parent Market Outlook
    • Production and Consumption Statistics
    • Import and Export Statistics
  4. Global Market Analysis 2020-2024 and Forecast, 2025-2035
    • Historical Market Size Value (USD Million) Analysis, 2020-2024
    • Current and Future Market Size Value (USD Million) Projections, 2025-2035
      • Y-o-Y Growth Trend Analysis
      • Absolute $ Opportunity Analysis
  5. Global Market Pricing Analysis 2020-2024 and Forecast 2025-2035
  6. Global Market Analysis 2020-2024 and Forecast 2025-2035, By Indication
    • Introduction / Key Findings
    • Historical Market Size Value (USD Million) Analysis By Indication , 2020-2024
    • Current and Future Market Size Value (USD Million) Analysis and Forecast By Indication , 2025-2035
      • Neutropenia
      • Anemia
      • Thrombocytopenia
    • Y-o-Y Growth Trend Analysis By Indication , 2020-2024
    • Absolute $ Opportunity Analysis By Indication , 2025-2035
  7. Global Market Analysis 2020-2024 and Forecast 2025-2035, By Drug Class
    • Introduction / Key Findings
    • Historical Market Size Value (USD Million) Analysis By Drug Class, 2020-2024
    • Current and Future Market Size Value (USD Million) Analysis and Forecast By Drug Class, 2025-2035
      • Growth factors
      • Erythropoietin stimulating agents
      • Thrombopoietic agents
      • Iron supplements
    • Y-o-Y Growth Trend Analysis By Drug Class, 2020-2024
    • Absolute $ Opportunity Analysis By Drug Class, 2025-2035
  8. Global Market Analysis 2020-2024 and Forecast 2025-2035, By Route of Administration
    • Introduction / Key Findings
    • Historical Market Size Value (USD Million) Analysis By Route of Administration, 2020-2024
    • Current and Future Market Size Value (USD Million) Analysis and Forecast By Route of Administration, 2025-2035
      • Injectable
      • Oral
    • Y-o-Y Growth Trend Analysis By Route of Administration, 2020-2024
    • Absolute $ Opportunity Analysis By Route of Administration, 2025-2035
  9. Global Market Analysis 2020-2024 and Forecast 2025-2035, By Distribution Channel
    • Introduction / Key Findings
    • Historical Market Size Value (USD Million) Analysis By Distribution Channel, 2020-2024
    • Current and Future Market Size Value (USD Million) Analysis and Forecast By Distribution Channel, 2025-2035
      • Hospital pharmacies
      • Retail pharmacies
      • Online pharmacies
      • Drug stores
    • Y-o-Y Growth Trend Analysis By Distribution Channel, 2020-2024
    • Absolute $ Opportunity Analysis By Distribution Channel, 2025-2035
  10. Global Market Analysis 2020-2024 and Forecast 2025-2035, By Region
    • Introduction
    • Historical Market Size Value (USD Million) Analysis By Region, 2020-2024
    • Current Market Size Value (USD Million) Analysis and Forecast By Region, 2025-2035
      • North America
      • Latin America
      • Western Europe
      • Eastern Europe
      • East Asia
      • South Asia and Pacific
      • Middle East & Africa
    • Market Attractiveness Analysis By Region
  11. North America Market Analysis 2020-2024 and Forecast 2025-2035, By Country
    • Historical Market Size Value (USD Million) Trend Analysis By Market Taxonomy, 2020-2024
    • Market Size Value (USD Million) Forecast By Market Taxonomy, 2025-2035
      • By Country
        • U.S.
        • Canada
        • Mexico
      • By Indication
      • By Drug Class
      • By Route of Administration
      • By Distribution Channel
    • Market Attractiveness Analysis
      • By Country
      • By Indication
      • By Drug Class
      • By Route of Administration
      • By Distribution Channel
    • Key Takeaways
  12. Latin America Market Analysis 2020-2024 and Forecast 2025-2035, By Country
    • Historical Market Size Value (USD Million) Trend Analysis By Market Taxonomy, 2020-2024
    • Market Size Value (USD Million) Forecast By Market Taxonomy, 2025-2035
      • By Country
        • Brazil
        • Chile
        • Rest of Latin America
      • By Indication
      • By Drug Class
      • By Route of Administration
      • By Distribution Channel
    • Market Attractiveness Analysis
      • By Country
      • By Indication
      • By Drug Class
      • By Route of Administration
      • By Distribution Channel
    • Key Takeaways
  13. Western Europe Market Analysis 2020-2024 and Forecast 2025-2035, By Country
    • Historical Market Size Value (USD Million) Trend Analysis By Market Taxonomy, 2020-2024
    • Market Size Value (USD Million) Forecast By Market Taxonomy, 2025-2035
      • By Country
        • Germany
        • U.K.
        • Italy
        • Spain
        • France
        • Nordic
        • BENELUX
        • Rest of Western Europe
      • By Indication
      • By Drug Class
      • By Route of Administration
      • By Distribution Channel
    • Market Attractiveness Analysis
      • By Country
      • By Indication
      • By Drug Class
      • By Route of Administration
      • By Distribution Channel
    • Key Takeaways
  14. Eastern Europe Market Analysis 2020-2024 and Forecast 2025-2035, By Country
    • Historical Market Size Value (USD Million) Trend Analysis By Market Taxonomy, 2020-2024
    • Market Size Value (USD Million) Forecast By Market Taxonomy, 2025-2035
      • By Country
        • Russia
        • Poland
        • Hungary
        • Balkan & Baltic
        • Rest of Eastern Europe
      • By Indication
      • By Drug Class
      • By Route of Administration
      • By Distribution Channel
    • Market Attractiveness Analysis
      • By Country
      • By Indication
      • By Drug Class
      • By Route of Administration
      • By Distribution Channel
    • Key Takeaways
  15. East Asia Market Analysis 2020-2024 and Forecast 2025-2035, By Country
    • Historical Market Size Value (USD Million) Trend Analysis By Market Taxonomy, 2020-2024
    • Market Size Value (USD Million) Forecast By Market Taxonomy, 2025-2035
      • By Country
        • China
        • Japan
        • South Korea
      • By Indication
      • By Drug Class
      • By Route of Administration
      • By Distribution Channel
    • Market Attractiveness Analysis
      • By Country
      • By Indication
      • By Drug Class
      • By Route of Administration
      • By Distribution Channel
    • Key Takeaways
  16. South Asia and Pacific Market Analysis 2020-2024 and Forecast 2025-2035, By Country
    • Historical Market Size Value (USD Million) Trend Analysis By Market Taxonomy, 2020-2024
    • Market Size Value (USD Million) Forecast By Market Taxonomy, 2025-2035
      • By Country
        • India
        • ASEAN
        • Australia & New Zealand
        • Rest of South Asia and Pacific
      • By Indication
      • By Drug Class
      • By Route of Administration
      • By Distribution Channel
    • Market Attractiveness Analysis
      • By Country
      • By Indication
      • By Drug Class
      • By Route of Administration
      • By Distribution Channel
    • Key Takeaways
  17. Middle East & Africa Market Analysis 2020-2024 and Forecast 2025-2035, By Country
    • Historical Market Size Value (USD Million) Trend Analysis By Market Taxonomy, 2020-2024
    • Market Size Value (USD Million) Forecast By Market Taxonomy, 2025-2035
      • By Country
        • Kingdom of Saudi Arabia
        • Other GCC Countries
        • Turkiye
        • South Africa
        • Other African Union
        • Rest of Middle East & Africa
      • By Indication
      • By Drug Class
      • By Route of Administration
      • By Distribution Channel
    • Market Attractiveness Analysis
      • By Country
      • By Indication
      • By Drug Class
      • By Route of Administration
      • By Distribution Channel
    • Key Takeaways
  18. Key Countries Market Analysis
    • U.S.
      • Pricing Analysis
      • Market Share Analysis, 2024
        • By Indication
        • By Drug Class
        • By Route of Administration
        • By Distribution Channel
    • Canada
      • Pricing Analysis
      • Market Share Analysis, 2024
        • By Indication
        • By Drug Class
        • By Route of Administration
        • By Distribution Channel
    • Mexico
      • Pricing Analysis
      • Market Share Analysis, 2024
        • By Indication
        • By Drug Class
        • By Route of Administration
        • By Distribution Channel
    • Brazil
      • Pricing Analysis
      • Market Share Analysis, 2024
        • By Indication
        • By Drug Class
        • By Route of Administration
        • By Distribution Channel
    • Chile
      • Pricing Analysis
      • Market Share Analysis, 2024
        • By Indication
        • By Drug Class
        • By Route of Administration
        • By Distribution Channel
    • Germany
      • Pricing Analysis
      • Market Share Analysis, 2024
        • By Indication
        • By Drug Class
        • By Route of Administration
        • By Distribution Channel
    • U.K.
      • Pricing Analysis
      • Market Share Analysis, 2024
        • By Indication
        • By Drug Class
        • By Route of Administration
        • By Distribution Channel
    • Italy
      • Pricing Analysis
      • Market Share Analysis, 2024
        • By Indication
        • By Drug Class
        • By Route of Administration
        • By Distribution Channel
    • Spain
      • Pricing Analysis
      • Market Share Analysis, 2024
        • By Indication
        • By Drug Class
        • By Route of Administration
        • By Distribution Channel
    • France
      • Pricing Analysis
      • Market Share Analysis, 2024
        • By Indication
        • By Drug Class
        • By Route of Administration
        • By Distribution Channel
    • India
      • Pricing Analysis
      • Market Share Analysis, 2024
        • By Indication
        • By Drug Class
        • By Route of Administration
        • By Distribution Channel
    • ASEAN
      • Pricing Analysis
      • Market Share Analysis, 2024
        • By Indication
        • By Drug Class
        • By Route of Administration
        • By Distribution Channel
    • Australia & New Zealand
      • Pricing Analysis
      • Market Share Analysis, 2024
        • By Indication
        • By Drug Class
        • By Route of Administration
        • By Distribution Channel
    • China
      • Pricing Analysis
      • Market Share Analysis, 2024
        • By Indication
        • By Drug Class
        • By Route of Administration
        • By Distribution Channel
    • Japan
      • Pricing Analysis
      • Market Share Analysis, 2024
        • By Indication
        • By Drug Class
        • By Route of Administration
        • By Distribution Channel
    • South Korea
      • Pricing Analysis
      • Market Share Analysis, 2024
        • By Indication
        • By Drug Class
        • By Route of Administration
        • By Distribution Channel
    • Russia
      • Pricing Analysis
      • Market Share Analysis, 2024
        • By Indication
        • By Drug Class
        • By Route of Administration
        • By Distribution Channel
    • Poland
      • Pricing Analysis
      • Market Share Analysis, 2024
        • By Indication
        • By Drug Class
        • By Route of Administration
        • By Distribution Channel
    • Hungary
      • Pricing Analysis
      • Market Share Analysis, 2024
        • By Indication
        • By Drug Class
        • By Route of Administration
        • By Distribution Channel
    • Kingdom of Saudi Arabia
      • Pricing Analysis
      • Market Share Analysis, 2024
        • By Indication
        • By Drug Class
        • By Route of Administration
        • By Distribution Channel
    • Turkiye
      • Pricing Analysis
      • Market Share Analysis, 2024
        • By Indication
        • By Drug Class
        • By Route of Administration
        • By Distribution Channel
    • South Africa
      • Pricing Analysis
      • Market Share Analysis, 2024
        • By Indication
        • By Drug Class
        • By Route of Administration
        • By Distribution Channel
  19. Market Structure Analysis
    • Competition Dashboard
    • Competition Benchmarking
    • Market Share Analysis of Top Players
      • By Regional
      • By Indication
      • By Drug Class
      • By Route of Administration
      • By Distribution Channel
  20. Competition Analysis
    • Competition Deep Dive
      • Amgen Inc.
        • Overview
        • Product Portfolio
        • Profitability by Market Segments (Product/Age /Sales Channel/Region)
        • Sales Footprint
        • Strategy Overview
          • Marketing Strategy
          • Product Strategy
          • Channel Strategy
      • Novartis AG
      • Teva Pharmaceutical Industries Ltd
      • Mylan N.V.
      • Pfizer Inc.
      • Janssen Global Services, LLC (Johnson & Johnson)
      • Partner Therapeutics, Inc.
      • Mission Pharmacal Company
      • Myelo Therapeutics GmbH
      • Pluristem Therapeutics Inc.
  21. Assumptions & Acronyms Used
  22. Research Methodology

List of Tables

  • Table 1: Global Market Value (USD Million) Forecast by Region, 2020-2035
  • Table 2: North America Market Value (USD Million) Forecast by Country, 2020-2035
  • Table 3: Latin America Market Value (USD Million) Forecast by Country, 2020-2035
  • Table 4: Western Europe Market Value (USD Million) Forecast by Country, 2020-2035
  • Table 5: Eastern Europe Market Value (USD Million) Forecast by Country, 2020-2035
  • Table 6: East Asia Market Value (USD Million) Forecast by Country, 2020-2035
  • Table 7: South Asia and Pacific Market Value (USD Million) Forecast by Country, 2020-2035
  • Table 8: Middle East & Africa Market Value (USD Million) Forecast by Country, 2020-2035

List of Figures

  • Figure 1: Global Market Pricing Analysis
  • Figure 2: Global Market Value (USD Million) Forecast 2020-2035
  • Figure 3: Global Market Value (USD Million) Share and BPS Analysis by Region, 2025 and 2035
  • Figure 4: Global Market Y-o-Y Growth Comparison by Region, 2025-2035
  • Figure 5: Global Market Attractiveness Analysis by Region
  • Figure 6: North America Market Incremental $ Opportunity, 2025-2035
  • Figure 7: Latin America Market Incremental $ Opportunity, 2025-2035
  • Figure 8: Western Europe Market Incremental $ Opportunity, 2025-2035
  • Figure 9: Eastern Europe Market Incremental $ Opportunity, 2025-2035
  • Figure 10: East Asia Market Incremental $ Opportunity, 2025-2035
  • Figure 11: South Asia and Pacific Market Incremental $ Opportunity, 2025-2035
  • Figure 12: Middle East & Africa Market Incremental $ Opportunity, 2025-2035
  • Figure 13: North America Market Value Share and BPS Analysis by Country, 2025 and 2035
  • Figure 14: Latin America Market Value Share and BPS Analysis by Country, 2025 and 2035
  • Figure 15: Western Europe Market Value Share and BPS Analysis by Country, 2025 and 2035
  • Figure 16: Eastern Europe Market Value Share and BPS Analysis by Country, 2025 and 2035
  • Figure 17: East Asia Market Value Share and BPS Analysis by Country, 2025 and 2035
  • Figure 18: South Asia and Pacific Market Value Share and BPS Analysis by Country, 2025 and 2035
  • Figure 19: Middle East & Africa Market Value Share and BPS Analysis by Country, 2025 and 2035
  • Figure 20: Global Market - Tier Structure Analysis
  • Figure 21: Global Market - Company Share Analysis

Frequently Asked Questions

How big is the radiation-induced myelosuppression treatment market in 2025?

The global radiation-induced myelosuppression treatment market is estimated to be valued at USD 3.2 billion in 2025.

What will be the market size for the radiation-induced myelosuppression treatment market in 2035?

It is projected to reach USD 4.3 billion by 2035.

How much will be the CAGR of the radiation-induced myelosuppression treatment market between 2025 and 2035?

The market is expected to grow at a 3.1% CAGR between 2025 and 2035.

What are the key product types in the radiation-induced myelosuppression treatment market?

The key product types are neutropenia, anemia and thrombocytopenia.

Which growth factors segment is expected to dominate the radiation-induced myelosuppression treatment market in 2025?

growth factors segment is expected to dominate with a 38.7% industry share in 2025.

Explore Similar Insights

Future Market Insights

Radiation-Induced Myelosuppression Treatment Market