Dialysis Induced Anemia Treatment Market Size, Share, and Forecast Outlook 2025 to 2035

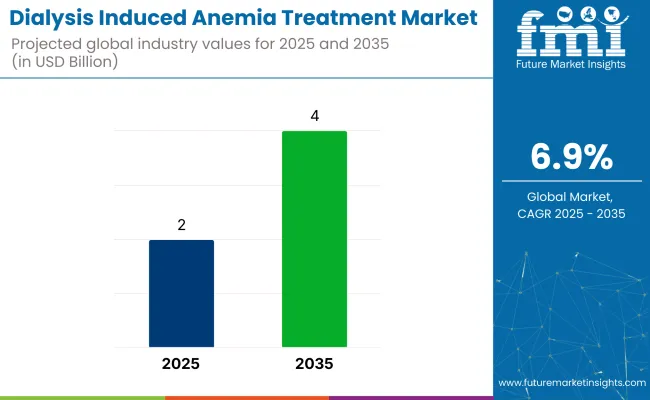
The global dialysis induced anemia treatment market is expected to reach USD 2 billion in 2025 and grow to USD 4.5 billion by 2035, registering a CAGR of 6.9%. Rising prevalence of chronic kidney disease (CKD), particularly end-stage renal disease (ESRD), is driving the need for effective anemia management in dialysis patients. Iron deficiency remains a primary concern in this population due to poor dietary absorption, frequent blood draws, and dialysis-related blood loss.
Quick Stats of the Dialysis Induced Anemia Treatment Market

  • Market Value (2025): USD 2 billion
  • Forecast Value (2035): USD 4 billion
  • Forecast CAGR (2025 to 2035): 6.9%
  • Leading Segment: Injectable (61.9% share)
  • Key Growth Region: Asia Pacific (India)
  • Key Players: Amgen, Johnson & Johnson, Novartis, Roche, Teva Pharmaceuticals, Biocon, CSL Vifor, Akebia Therapeutics, GSK Plc

Dialysis Induced Anemia Treatment Market

According to the National Kidney Foundation, patients on dialysis are at high risk of iron deficiency due to several contributing factors such as limited consumption of iron-rich foods, blood loss during hemodialysis sessions, and the use of erythropoiesis-stimulating agents (ESAs) that further deplete iron levels.

The foundation emphasizes that even small amounts of blood lost during dialysis procedures can accumulate, exacerbating iron deficiency and anemia. It highlights the need for routine monitoring and patient-specific iron supplementation strategies to maintain hemoglobin levels and ensure optimal anemia control.

The industry holds a specialized but significant share within its parent markets. Within the anemia treatment market, it accounts for approximately 10-12%, as dialysis-induced anemia represents a specific type of anemia with targeted treatments. In the renal care market, its share is around 7-9%, driven by the increasing need for specialized anemia treatments in dialysis patients.

Within the pharmaceuticals market, its share is about 2-3%, as treatments like erythropoiesis-stimulating agents and iron supplements are part of the larger pharmaceutical landscape. In the healthcare and hospital supplies market, the share is approximately 3-5%, as these treatments are critical for dialysis patients in hospital settings. Within the chronic kidney disease market, it holds about 5-7%, as anemia management is closely linked to CKD treatment and care.

Analyzing Dialysis Induced Anemia Treatment Market by Top Investment Segments

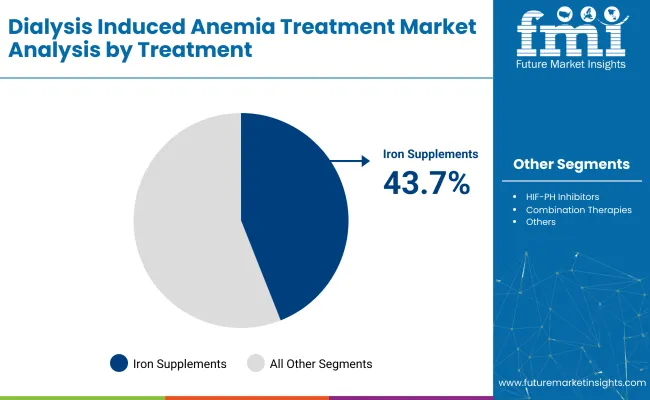
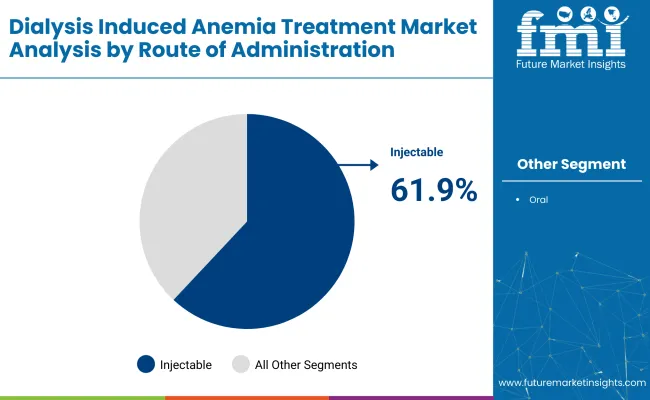
The industry is projected to be led by iron supplements, injectable routes, and hospital pharmacies in 2025. Iron supplements are expected to capture 43.7%, injectable routes 61.9%, and hospital pharmacies will dominate the sales channel segment with 56%.

Iron supplements lead the treatment segment with 43.7% industry share

Iron supplements are expected to dominate the industry with 43.7% of the industry share in 2025. These supplements are critical for restoring iron levels and supporting erythropoiesis in dialysis patients, particularly those with chronic kidney disease (CKD). Intravenous iron formulations, with superior bioavailability and quicker response compared to oral forms, are increasingly preferred, especially for hemodialysis patients with poor iron absorption.

The growth of this segment is supported by the rising prevalence of ESRD, cost-effectiveness in reducing ESA dependency, and innovations like ferric carboxymaltose, iron sucrose, and newer iron complexes, which offer reduced dosing frequency and fewer side effects.
  • Intravenous formulations offer better bioavailability and rapid response
  • Ongoing product innovations focus on improved safety and tolerability
  • Rising ESRD cases and demand for cost-effective anemia management drive growth

Dialysis Induced Anemia Treatment Market Analysis By Treatment

Injectable route dominates the administration segment with 61.9% share

Injectable formulations are projected to dominate the route of administration segment, holding a 61.9% industry share in 2025. These formulations are the preferred choice for managing moderate-to-severe anemia in CKD patients, particularly during dialysis. Intravenous administration ensures effective treatment due to better absorption and precise dosing control, which is crucial in hemodialysis procedures.

The segment’s growth is further supported by advancements in long-acting injectable formulations, which offer sustained release and reduced dosing frequency. The rise in pre-filled syringes and safety-engineered injectable systems is increasing provider convenience and minimizing administration errors and contamination risks.
  • Intravenous formulations ensure effective treatment with precise dosing control
  • Long-acting injectables reduce dosing frequency and improve clinical efficiency
  • Pre-filled syringes and safety-engineered systems enhance convenience and minimize risks

Dialysis Induced Anemia Treatment Market Analysis By Route Of Administration

Hospital pharmacies lead the sales channel segment with 56% industry share

Hospital pharmacies are expected to capture 56% of the industry share in 2025, making them the leading channel for anti-anemia treatments. These pharmacies play a crucial role in administering iron therapies and erythropoiesis-stimulating agents (ESAs) in inpatient and dialysis settings. Hospital pharmacies offer secure storage, clinical oversight, and reimbursement alignment, ensuring safe and effective medication management.

The integration of electronic medical records (EMRs) and automated dispensing systems streamlines anemia management by improving inventory tracking, patient compliance monitoring, and workflow efficiency. With centralized treatment protocols, hospitals remain the most trusted and reliable channel for administering anti-D immunoglobulin.

  • Provide secure storage and clinical oversight for injectable medications
  • Integration of EMRs and automated systems improves workflow and patient compliance
  • Centralized hospital treatment model enhances efficiency and patient safety

Top Dialysis Induced Anemia Treatment Market Dynamics

The industry is evolving with innovations such as biosimilar erythropoiesis-stimulating agents (ESAs) and personalized intravenous iron therapies. These advancements aim to improve patient care, reduce treatment costs, and optimize individualized anemia management, particularly in renal care.

Emerging Erythropoiesis-Stimulating Agents & Biosimilars

New erythropoiesis-stimulating agents (ESAs) and biosimilars are improving anemia management in renal care by providing cost-effective alternatives to original ESAs. Darbepoetin alpha biosimilars, for example, are gaining approvals and being utilized for less frequent dosing, reducing the injection burden on hemodialysis patients.

Value-based contracts between payers and providers are facilitating biosimilar use in dialysis units, while updated guidelines encourage earlier anemia intervention. These changes help standardize care, improve access, and reduce therapy costs across nephrology practices.

  • Biosimilars like darbepoetin alpha offer cost-effective alternatives to original ESAs.
  • Long-acting ESAs are favored for less frequent dosing, reducing patient injection burden.
  • Value-based contracts and guideline updates are improving access to biosimilars and standardizing care.

Integration of Intravenous Iron Therapies and Personalized Regimens

The adoption of intravenous iron therapies, such as ferric carboxymaltose and iron sucrose, is growing in the treatment of dialysis-induced anemia. Protocols are becoming more personalized, with dosing adjusted based on patient response and hepcidin levels. Point-of-care monitoring systems for hemoglobin and iron levels are guiding real-time dosing to optimize treatment efficacy.

Personalized regimens are reducing the risk of iron overload and improving hemoglobin stability. This data-driven approach, implemented by dialysis clinics in collaboration with nephrologists, is enhancing patient outcomes and minimizing transfusion requirements.
  • Personalized intravenous iron regimens are reducing iron overload risks and improving hemoglobin stability.
  • Point-of-care monitoring systems are enabling real-time treatment adjustments.
  • Data-driven, personalized approaches are improving patient outcomes and minimizing transfusion needs.

Top Countries Developing, Approving, Supplying, and Utilizing Dialysis Anemia Therapies

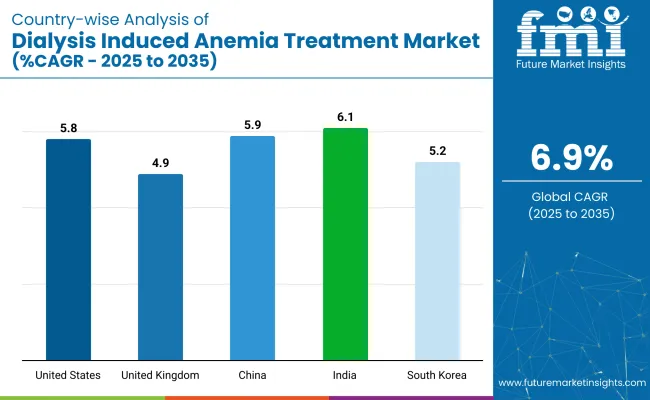
Country Wise Analysis Of Dialysis Induced Anemia Treatment Market Cagr 2025 To 2035

Countries CAGR (2025 to 2035)
United States 5.8%
United Kingdom 4.9%
China 5.9%
India 6.1%
South Korea 5.2%

The global industry is projected to grow at a CAGR of 6.9% from 2025 to 2035. The United States, with a CAGR of 5.8%, shows steady growth, driven by increasing awareness and advancements in anemia treatments related to dialysis, as well as a large patient population requiring ongoing dialysis care. The United Kingdom, at 4.9%, experiences more moderate growth, influenced by the country's well-established healthcare system and consistent demand for dialysis treatments.

China, with a CAGR of 5.9%, demonstrates solid growth, reflecting its expanding healthcare infrastructure and growing number of patients undergoing dialysis due to an increasing incidence of chronic kidney disease. India, at 6.1%, shows stronger growth, supported by rapid healthcare improvements, a rising patient base, and increased access to dialysis treatment.

South Korea, with a CAGR of 5.2%, experiences steady growth due to advancements in treatment protocols and a well-developed healthcare system. While OECD countries show steady growth, India stands out with its higher growth rate, highlighting the shift toward emerging economies as key players in the future expansion of the industry.

The report covers in-depth analysis of 40+ countries; five top-performing OECD and BRICS countries are highlighted below.

In-depth Analysis of United States Dialysis Induced Anemia Treatment Market

The industry in the United States is set to record a CAGR of 5.8% through 2035. Medicare bundle payments have preserved coverage for erythropoiesis-stimulating agents (ESAs) and intravenous iron, encouraging guideline-aligned dosing. FDA Breakthrough and Fast-Track programmes have accelerated hypoxia-inducible-factor (HIF) stabiliser reviews, widening therapeutic choice.

Dialysis centers operated by DaVita and Fresenius have embedded point-of-care hemoglobin analytics and medication prompts, improving adherence. Integrated pharmacy networks have secured favorable purchase terms, keeping ESA supply stable despite input volatility. Continuous data feeds support anemia-management analytics.

  • HIF stabilizers have reached phase-3 completion, positioning oral agents as ESA complements in high-inflammation cohorts.
  • AI-driven iron-dosing platforms have been deployed across major chains, and inventory control has been streamlined, reducing transfusion incidents.
  • CMS Star-Ratings metrics have been updated to include hemoglobin variability, incentivizing clinics to boost anemia outcome scores.

United Kingdom Dialysis Induced Anemia Treatment Market Overview

Sales of dialysis-induced anemia therapies in the United Kingdom are projected to grow at a CAGR of 4.9% through 2035. NHS framework deals have locked ESA pricing, enabling predictable budgeting. NICE guidelines have standardized ferritin and transferrin saturation thresholds, facilitating algorithm-based dose titration across hospital and community units.

Real-world outcome registries under the UK Renal Registry feed dashboards visible to clinicians, fostering peer benchmarking. Biosimilar epoetin alfa and darbepoetin alfa have been embraced, releasing capacity for novel long-acting formulations. Community nurses have broadened home-dialysis coverage, enabling decentralized anemia-management visits.

  • Biosimilar tender rounds have cut ESA acquisition costs by nearly one-third, freeing NHS funds for HIF-stabilizer pilots.
  • Home-dialysis programs have been expanded, and ESA administrations have been scheduled during nurse visits, lowering outpatient burden.
  • Renal Registry dashboards have flagged outlier units, triggering targeted anemia quality-improvement plans and centralized audits.

China Dialysis Induced Anemia Treatment Market Growth

Demand for dialysis-induced anemia therapies in China is estimated to grow at a CAGR of 5.9% through 2035.Centralized volume-based procurement has compressed ESA prices, expanding access in provincial hemodialysis centers. The Healthy China 2030 blueprint has mandated anemia screening within National Basic Public Health Services, boosting early identification of low hemoglobin.

Domestic biosimilar epoetin and darbepoetin have secured priority listing, while HIF prolyl-hydroxylase inhibitors are undergoing Phase-III bridging studies under NMPA fast review. Cloud-linked dialysis machines now upload real-time hemoglobin data to hospital exchanges, allowing automated dose suggestions that reduce workload and variability.

  • Volume-based procurement rounds have reduced median ESA price by over 60%, enabling broader provincial uptake.
  • Domestic HIF inhibitors have received priority evaluation, and conditional approvals are expected pending cardiovascular-safety endpoints.
  • Tele-nephrology platforms now integrate anemia dashboards, facilitating remote dose adjustments for rural hemodialysis cohorts.

India Dialysis Induced Anemia Treatment Market Expansion

The industry in India is set to record a CAGR of 6.1% through 2035. The Pradhan Mantri National Dialysis Program has expanded hemodialysis capacity across district hospitals, embedding ESAs and intravenous iron within subsidized care bundles.

Local firms such as Bharat Serums and Biological E have ramped biosimilar ESA output under revised GMP norms, trimming import reliance. Ayushman Bharat insurance claims now capture hemoglobin metrics, linking reimbursement to guideline adherence. Telemedicine networks operated by nephrology specialists have guided dose optimization in peripheral centers, while blended AYUSH-allopathic protocols remain trialed under ethics oversight.

  • District warehouses have adopted solar-powered cold storage, sustaining ESA potency across high-temperature transit corridors.
  • Local heme-analytics devices have been distributed to primary health centers, permitting on-site anemia monitoring before dialysis referrals.
  • Clinical-pharmacy training modules have been rolled out in nursing colleges, reinforcing correct reconstitution and administration of biosimilar ESAs.

South Korea Dialysis Induced Anemia Treatment Market Analysis

The industry in South Korea is set to record a CAGR of 5.2% through 2035. National Health Insurance coverage has ensured reimbursement for ESAs and intravenous iron across hemodialysis and peritoneal facilities. Smart nephrology platforms integrating wearable hemoglobin sensors stream real-time values to cloud dashboards, triggering automated dose recalculation within electronic prescribing software.

Domestic biologic producers and global innovators have collaborated on long-acting ESA formulations and combination anti-inflammatory products, proceeding under MFDS fast review. Hospital-biotech consortia are prototyping microneedle patches and drug-eluting implants that target erythropoietin release in outpatient settings.

  • Wearable hemoglobin trackers have been linked to insurance billing, incentivizing continuous patient data uploads.
  • Combination ESA-anti-inflammatory trials have reached phase-2 status, aiming to lessen injection frequency and improve fatigue scores.
  • Clinical-decision-support algorithms have been embedded within smart hospital networks, guiding anemia dose adjustments in real time.

Leading Dialysis Induced Anemia Treatment Market Suppliers

Leading Company - Amgen Industry Share - 14%
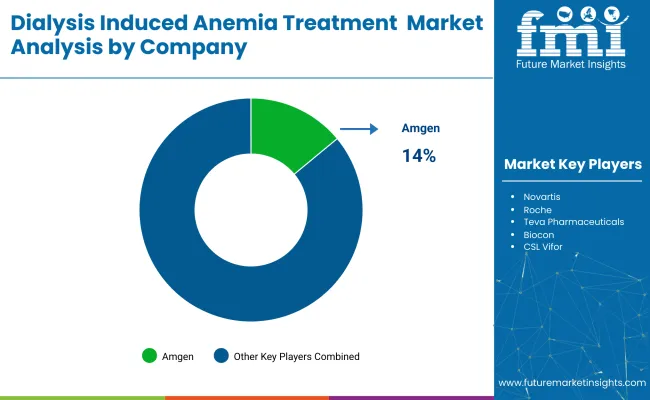
Dialysis Induced Anemia Treatment Market Analysis By Company

The industry is shaped by dominant players such as Amgen, Johnson & Johnson, Roche, and Novartis, who lead with patented biologics, advanced erythropoiesis-stimulating agents (ESAs), and global distribution networks. Key players including Teva, Biocon, CSL Vifor, and GSK focus on biosimilar ESAs, regional licensing agreements, and renal-specific commercialization strategies.

Emerging players like Akebia Therapeutics are driving innovation through novel oral HIF-PH inhibitors and strategic partnerships within the dialysis ecosystem. These companies are expanding patient access and treatment options, backed by clinical research, regulatory approvals, and industry-specific drug delivery technologies.

Recent Industry News

  • FDA Approves Akebia’s Oral Vafseo (vadadustat) for Dialysis AnemiaOn March 27, 2024, the USA Food and Drug Administration approved Vafseo(vadadustat)-an oral hypoxiainducible factor prolylhydroxylase inhibitor-for the treatment of anemia in adult chronic kidney disease patients undergoing dialysis
  • FDA Greenlights Rockwell Medical’s IV Triferic AVNU for Dialysis-Induced AnemiaOn March 27, 2020, the FDA approved Triferic AVNU (ferric pyrophosphate citrate)-an intravenous iron maintenance therapy designed to replenish iron and maintain hemoglobin during hemodialysis sessions

Report Scope - Dialysis Induced Anemia Treatment Market

Report Attributes Details
Industry Size (2025) USD 2 billion
Projected Industry Size (2035) USD 4 billion
CAGR (2025 to 2035) 6.9%
Base Year for Estimation 2024
Historical Period 2020 to 2024
Projections Period 2025 to 2035
Quantitative Units USD billion for value and million patients treated for volume
Treatment Types Analyzed (Segment 1) Erythropoiesis-Stimulating Agents, Iron Supplements, HIF-PH Inhibitors, Combination Therapies
Routes of Administration Analyzed (Segment 2) Injectable, Oral
Sales Channels Analyzed (Segment 3) Hospital Pharmacies, Dialysis Centers, Retail Pharmacy Chains, Mail Order Pharmacies
Countries Covered United States, Canada, Brazil, Mexico, Germany, United Kingdom, France, Italy, Spain, China, India, Japan, South Korea, Australia, Saudi Arabia, UAE, South Africa
Key Players influencing the Industry Amgen, Johnson & Johnson, Novartis, Roche, Teva Pharmaceuticals, Biocon, CSL Vifor, Akebia Therapeutics, GSK Plc
Additional Attributes Dollar sales, share by treatment class and route, ESA biosimilar uptake, impact of HIF-PH inhibitors in Asia and Europe, Medicare reimbursement impact, oral iron therapy adoption in outpatient dialysis

Key Dialysis Induced Anemia Treatment Market Players

  • Amgen
  • Johnson & Johnson (J&J)
  • Novartis
  • Roche
  • Teva Pharmaceuticals
  • Biocon
  • CSL Vifor
  • Akebia Therapeutics
  • GSK plc

Key Segments Studied in the Dialysis Induced Anemia Treatment Market

By Treatment:

By treatment, the industry is segmented into Erythropoiesis-stimulating Agents, Iron Supplements, HIF-PH Inhibitors, and Combination Therapies.

By Route of Administration:

By route of Administration, the industry includes Injectable and Oral Formulations.

By Sales Channel:

By sales channel, the industry comprises Hospital Pharmacies, Dialysis Centers, Retail Pharmacy Chains, and Mail Order Pharmacies.

By Region:

By region, the industry is categorized into North America, Latin America, Europe, Asia-Pacific, and Middle East & Africa.

Table of Content

  1. Executive Summary
    • Global Market Outlook
    • Demand-side Trends
    • Supply-side Trends
    • Technology Roadmap Analysis
    • Analysis and Recommendations
  2. Market Overview
    • Market Coverage / Taxonomy
    • Market Definition / Scope / Limitations
  3. Market Background
    • Market Dynamics
      • Drivers
      • Restraints
      • Opportunity
      • Trends
    • Scenario Forecast
      • Demand in Optimistic Scenario
      • Demand in Likely Scenario
      • Demand in Conservative Scenario
    • Opportunity Map Analysis
    • Product Life Cycle Analysis
    • Supply Chain Analysis
      • Supply Side Participants and their Roles
        • Producers
        • Mid-Level Participants (Traders/ Agents/ Brokers)
        • Wholesalers and Distributors
      • Value Added and Value Created at Node in the Supply Chain
      • List of Raw Material Suppliers
      • List of Existing and Potential Buyer’s
    • Investment Feasibility Matrix
    • Value Chain Analysis
      • Profit Margin Analysis
      • Wholesalers and Distributors
      • Retailers
    • PESTLE and Porter’s Analysis
    • Regulatory Landscape
      • By Key Regions
      • By Key Countries
    • Regional Parent Market Outlook
    • Production and Consumption Statistics
    • Import and Export Statistics
  4. Global Market Analysis 2020 to 2024 and Forecast, 2025 to 2035
    • Historical Market Size Value (USD Billion) & Volume (Million Patients Treated) Analysis, 2020 to 2024
    • Current and Future Market Size Value (USD Billion) & Volume (Million Patients Treated) Projections, 2025 to 2035
      • Y-o-Y Growth Trend Analysis
      • Absolute $ Opportunity Analysis
  5. Global Market Pricing Analysis 2020 to 2024 and Forecast 2025 to 2035
  6. Global Market Analysis 2020 to 2024 and Forecast 2025 to 2035, By Treatment
    • Introduction / Key Findings
    • Historical Market Size Value (USD Billion) & Volume (Million Patients Treated) Analysis By Treatment, 2020 to 2024
    • Current and Future Market Size Value (USD Billion) & Volume (Million Patients Treated) Analysis and Forecast By Treatment, 2025 to 2035
      • Erythropoiesis-stimulating Agents
      • Iron Supplements
      • HIF-PH Inhibitors
      • Combination Therapies
    • Y-o-Y Growth Trend Analysis By Treatment, 2020 to 2024
    • Absolute $ Opportunity Analysis By Treatment, 2025 to 2035
  7. Global Market Analysis 2020 to 2024 and Forecast 2025 to 2035, By Route of Administration
    • Introduction / Key Findings
    • Historical Market Size Value (USD Billion) & Volume (Million Patients Treated) Analysis By Route of Administration, 2020 to 2024
    • Current and Future Market Size Value (USD Billion) & Volume (Million Patients Treated) Analysis and Forecast By Route of Administration, 2025 to 2035
      • Administration
      • Injectable
      • Oral Formulations
    • Y-o-Y Growth Trend Analysis By Route of Administration, 2020 to 2024
    • Absolute $ Opportunity Analysis By Route of Administration, 2025 to 2035
  8. Global Market Analysis 2020 to 2024 and Forecast 2025 to 2035, By Sales Channel
    • Introduction / Key Findings
    • Historical Market Size Value (USD Billion) & Volume (Million Patients Treated) Analysis By Sales Channel, 2020 to 2024
    • Current and Future Market Size Value (USD Billion) & Volume (Million Patients Treated) Analysis and Forecast By Sales Channel, 2025 to 2035
      • Hospital Pharmacies
      • Dialysis Centers
      • Retail Pharmacy Chains
      • Mail Order Pharmacies
    • Y-o-Y Growth Trend Analysis By Sales Channel, 2020 to 2024
    • Absolute $ Opportunity Analysis By Sales Channel, 2025 to 2035
  9. Global Market Analysis 2020 to 2024 and Forecast 2025 to 2035, By Region
    • Introduction
    • Historical Market Size Value (USD Billion) & Volume (Million Patients Treated) Analysis By Region, 2020 to 2024
    • Current Market Size Value (USD Billion) & Volume (Million Patients Treated) Analysis and Forecast By Region, 2025 to 2035
      • North America
      • Latin America
      • Western Europe
      • Eastern Europe
      • East Asia
      • South Asia & Pacific
      • Middle East and Africa
    • Market Attractiveness Analysis By Region
  10. North America Market Analysis 2020 to 2024 and Forecast 2025 to 2035, By Country
    • Historical Market Size Value (USD Billion) & Volume (Million Patients Treated) Trend Analysis By Market Taxonomy, 2020 to 2024
    • Market Size Value (USD Billion) & Volume (Million Patients Treated) Forecast By Market Taxonomy, 2025 to 2035
      • By Country
        • USA
        • Canada
        • Mexico
      • By Treatment
      • By Route of Administration
      • By Sales Channel
    • Market Attractiveness Analysis
      • By Country
      • By Treatment
      • By Route of Administration
      • By Sales Channel
    • Key Takeaways
  11. Latin America Market Analysis 2020 to 2024 and Forecast 2025 to 2035, By Country
    • Historical Market Size Value (USD Billion) & Volume (Million Patients Treated) Trend Analysis By Market Taxonomy, 2020 to 2024
    • Market Size Value (USD Billion) & Volume (Million Patients Treated) Forecast By Market Taxonomy, 2025 to 2035
      • By Country
        • Brazil
        • Argentina
        • Rest of LATAM
      • By Treatment
      • By Route of Administration
      • By Sales Channel
    • Market Attractiveness Analysis
      • By Country
      • By Treatment
      • By Route of Administration
      • By Sales Channel
    • Key Takeaways
  12. Western Europe Market Analysis 2020 to 2024 and Forecast 2025 to 2035, By Country
    • Historical Market Size Value (USD Billion) & Volume (Million Patients Treated) Trend Analysis By Market Taxonomy, 2020 to 2024
    • Market Size Value (USD Billion) & Volume (Million Patients Treated) Forecast By Market Taxonomy, 2025 to 2035
      • By Country
        • Germany
        • Italy
        • France
        • UK
        • Spain
        • BENELUX
        • Nordic
        • Rest of W. Europe
      • By Treatment
      • By Route of Administration
      • By Sales Channel
    • Market Attractiveness Analysis
      • By Country
      • By Treatment
      • By Route of Administration
      • By Sales Channel
    • Key Takeaways
  13. Eastern Europe Market Analysis 2020 to 2024 and Forecast 2025 to 2035, By Country
    • Historical Market Size Value (USD Billion) & Volume (Million Patients Treated) Trend Analysis By Market Taxonomy, 2020 to 2024
    • Market Size Value (USD Billion) & Volume (Million Patients Treated) Forecast By Market Taxonomy, 2025 to 2035
      • By Country
        • Russia
        • Hungary
        • Poland
        • Balkan & Baltics
        • Rest of E. Europe
      • By Treatment
      • By Route of Administration
      • By Sales Channel
    • Market Attractiveness Analysis
      • By Country
      • By Treatment
      • By Route of Administration
      • By Sales Channel
    • Key Takeaways
  14. East Asia Market Analysis 2020 to 2024 and Forecast 2025 to 2035, By Country
    • Historical Market Size Value (USD Billion) & Volume (Million Patients Treated) Trend Analysis By Market Taxonomy, 2020 to 2024
    • Market Size Value (USD Billion) & Volume (Million Patients Treated) Forecast By Market Taxonomy, 2025 to 2035
      • By Country
        • China
        • Japan
        • South Korea
      • By Treatment
      • By Route of Administration
      • By Sales Channel
    • Market Attractiveness Analysis
      • By Country
      • By Treatment
      • By Route of Administration
      • By Sales Channel
    • Key Takeaways
  15. South Asia & Pacific Market Analysis 2020 to 2024 and Forecast 2025 to 2035, By Country
    • Historical Market Size Value (USD Billion) & Volume (Million Patients Treated) Trend Analysis By Market Taxonomy, 2020 to 2024
    • Market Size Value (USD Billion) & Volume (Million Patients Treated) Forecast By Market Taxonomy, 2025 to 2035
      • By Country
        • India
        • Australia & New Zealand
        • ASEAN
        • Rest of SAP
      • By Treatment
      • By Route of Administration
      • By Sales Channel
    • Market Attractiveness Analysis
      • By Country
      • By Treatment
      • By Route of Administration
      • By Sales Channel
    • Key Takeaways
  16. Middle East and Africa Market Analysis 2020 to 2024 and Forecast 2025 to 2035, By Country
    • Historical Market Size Value (USD Billion) & Volume (Million Patients Treated) Trend Analysis By Market Taxonomy, 2020 to 2024
    • Market Size Value (USD Billion) & Volume (Million Patients Treated) Forecast By Market Taxonomy, 2025 to 2035
      • By Country
        • GCC Countries
        • Northern Africa
        • South Africa
        • Turkiye
        • Rest of MEA
      • By Treatment
      • By Route of Administration
      • By Sales Channel
    • Market Attractiveness Analysis
      • By Country
      • By Treatment
      • By Route of Administration
      • By Sales Channel
    • Key Takeaways
  17. Key Countries Market Analysis
    • USA
      • Pricing Analysis
      • Market Share Analysis, 2024
        • By Treatment
        • By Route of Administration
        • By Sales Channel
    • Canada
      • Pricing Analysis
      • Market Share Analysis, 2024
        • By Treatment
        • By Route of Administration
        • By Sales Channel
    • Brazil
      • Pricing Analysis
      • Market Share Analysis, 2024
        • By Treatment
        • By Route of Administration
        • By Sales Channel
    • Mexico
      • Pricing Analysis
      • Market Share Analysis, 2024
        • By Treatment
        • By Route of Administration
        • By Sales Channel
    • Argentina
      • Pricing Analysis
      • Market Share Analysis, 2024
        • By Treatment
        • By Route of Administration
        • By Sales Channel
  18. Market Structure Analysis
    • Competition Dashboard
    • Competition Benchmarking
    • Market Share Analysis of Top Players
      • By Regional
      • By Treatment
      • By Route of Administration
      • By Sales Channel
  19. Competition Analysis
    • Competition Deep Dive
      • Amgen
        • Overview
        • Product Portfolio
        • Profitability by Market Segments (Product/Age /Sales Channel/Region)
        • Sales Footprint
        • Strategy Overview
          • Marketing Strategy
          • Product Strategy
          • Channel Strategy
      • Johnson & Johnson (J&J)
        • Overview
        • Product Portfolio
        • Profitability by Market Segments (Product/Age /Sales Channel/Region)
        • Sales Footprint
        • Strategy Overview
          • Marketing Strategy
          • Product Strategy
          • Channel Strategy
      • Novartis
        • Overview
        • Product Portfolio
        • Profitability by Market Segments (Product/Age /Sales Channel/Region)
        • Sales Footprint
        • Strategy Overview
          • Marketing Strategy
          • Product Strategy
          • Channel Strategy
      • Roche
        • Overview
        • Product Portfolio
        • Profitability by Market Segments (Product/Age /Sales Channel/Region)
        • Sales Footprint
        • Strategy Overview
          • Marketing Strategy
          • Product Strategy
          • Channel Strategy
      • Teva Pharmaceuticals
        • Overview
        • Product Portfolio
        • Profitability by Market Segments (Product/Age /Sales Channel/Region)
        • Sales Footprint
        • Strategy Overview
          • Marketing Strategy
          • Product Strategy
          • Channel Strategy
      • Biocon
        • Overview
        • Product Portfolio
        • Profitability by Market Segments (Product/Age /Sales Channel/Region)
        • Sales Footprint
        • Strategy Overview
          • Marketing Strategy
          • Product Strategy
          • Channel Strategy
      • CSL Vifor
        • Overview
        • Product Portfolio
        • Profitability by Market Segments (Product/Age /Sales Channel/Region)
        • Sales Footprint
        • Strategy Overview
          • Marketing Strategy
          • Product Strategy
          • Channel Strategy
      • Akebia Therapeutics
        • Overview
        • Product Portfolio
        • Profitability by Market Segments (Product/Age /Sales Channel/Region)
        • Sales Footprint
        • Strategy Overview
          • Marketing Strategy
          • Product Strategy
          • Channel Strategy
      • GSK plc
        • Overview
        • Product Portfolio
        • Profitability by Market Segments (Product/Age /Sales Channel/Region)
        • Sales Footprint
        • Strategy Overview
          • Marketing Strategy
          • Product Strategy
          • Channel Strategy
  20. Assumptions & Acronyms Used
  21. Research Methodology

List of Tables

  • Table 1: Global Market Value (USD Billion) Forecast by Region, 2020 to 2035
  • Table 2: Global Market Volume (Million Patients Treated) Forecast by Region, 2020 to 2035
  • Table 3: Global Market Value (USD Billion) Forecast by Treatment, 2020 to 2035
  • Table 4: Global Market Volume (Million Patients Treated) Forecast by Treatment, 2020 to 2035
  • Table 5: Global Market Value (USD Billion) Forecast by Route of Administration, 2020 to 2035
  • Table 6: Global Market Volume (Million Patients Treated) Forecast by Route of Administration, 2020 to 2035
  • Table 7: Global Market Value (USD Billion) Forecast by Sales Channel, 2020 to 2035
  • Table 8: Global Market Volume (Million Patients Treated) Forecast by Sales Channel, 2020 to 2035
  • Table 9: North America Market Value (USD Billion) Forecast by Country, 2020 to 2035
  • Table 10: North America Market Volume (Million Patients Treated) Forecast by Country, 2020 to 2035
  • Table 11: North America Market Value (USD Billion) Forecast by Treatment, 2020 to 2035
  • Table 12: North America Market Volume (Million Patients Treated) Forecast by Treatment, 2020 to 2035
  • Table 13: North America Market Value (USD Billion) Forecast by Route of Administration, 2020 to 2035
  • Table 14: North America Market Volume (Million Patients Treated) Forecast by Route of Administration, 2020 to 2035
  • Table 15: North America Market Value (USD Billion) Forecast by Sales Channel, 2020 to 2035
  • Table 16: North America Market Volume (Million Patients Treated) Forecast by Sales Channel, 2020 to 2035
  • Table 17: Latin America Market Value (USD Billion) Forecast by Country, 2020 to 2035
  • Table 18: Latin America Market Volume (Million Patients Treated) Forecast by Country, 2020 to 2035
  • Table 19: Latin America Market Value (USD Billion) Forecast by Treatment, 2020 to 2035
  • Table 20: Latin America Market Volume (Million Patients Treated) Forecast by Treatment, 2020 to 2035
  • Table 21: Latin America Market Value (USD Billion) Forecast by Route of Administration, 2020 to 2035
  • Table 22: Latin America Market Volume (Million Patients Treated) Forecast by Route of Administration, 2020 to 2035
  • Table 23: Latin America Market Value (USD Billion) Forecast by Sales Channel, 2020 to 2035
  • Table 24: Latin America Market Volume (Million Patients Treated) Forecast by Sales Channel, 2020 to 2035
  • Table 25: Western Europe Market Value (USD Billion) Forecast by Country, 2020 to 2035
  • Table 26: Western Europe Market Volume (Million Patients Treated) Forecast by Country, 2020 to 2035
  • Table 27: Western Europe Market Value (USD Billion) Forecast by Treatment, 2020 to 2035
  • Table 28: Western Europe Market Volume (Million Patients Treated) Forecast by Treatment, 2020 to 2035
  • Table 29: Western Europe Market Value (USD Billion) Forecast by Route of Administration, 2020 to 2035
  • Table 30: Western Europe Market Volume (Million Patients Treated) Forecast by Route of Administration, 2020 to 2035
  • Table 31: Western Europe Market Value (USD Billion) Forecast by Sales Channel, 2020 to 2035
  • Table 32: Western Europe Market Volume (Million Patients Treated) Forecast by Sales Channel, 2020 to 2035
  • Table 33: Eastern Europe Market Value (USD Billion) Forecast by Country, 2020 to 2035
  • Table 34: Eastern Europe Market Volume (Million Patients Treated) Forecast by Country, 2020 to 2035
  • Table 35: Eastern Europe Market Value (USD Billion) Forecast by Treatment, 2020 to 2035
  • Table 36: Eastern Europe Market Volume (Million Patients Treated) Forecast by Treatment, 2020 to 2035
  • Table 37: Eastern Europe Market Value (USD Billion) Forecast by Route of Administration, 2020 to 2035
  • Table 38: Eastern Europe Market Volume (Million Patients Treated) Forecast by Route of Administration, 2020 to 2035
  • Table 39: Eastern Europe Market Value (USD Billion) Forecast by Sales Channel, 2020 to 2035
  • Table 40: Eastern Europe Market Volume (Million Patients Treated) Forecast by Sales Channel, 2020 to 2035
  • Table 41: East Asia Market Value (USD Billion) Forecast by Country, 2020 to 2035
  • Table 42: East Asia Market Volume (Million Patients Treated) Forecast by Country, 2020 to 2035
  • Table 43: East Asia Market Value (USD Billion) Forecast by Treatment, 2020 to 2035
  • Table 44: East Asia Market Volume (Million Patients Treated) Forecast by Treatment, 2020 to 2035
  • Table 45: East Asia Market Value (USD Billion) Forecast by Route of Administration, 2020 to 2035
  • Table 46: East Asia Market Volume (Million Patients Treated) Forecast by Route of Administration, 2020 to 2035
  • Table 47: East Asia Market Value (USD Billion) Forecast by Sales Channel, 2020 to 2035
  • Table 48: East Asia Market Volume (Million Patients Treated) Forecast by Sales Channel, 2020 to 2035
  • Table 49: South Asia & Pacific Market Value (USD Billion) Forecast by Country, 2020 to 2035
  • Table 50: South Asia & Pacific Market Volume (Million Patients Treated) Forecast by Country, 2020 to 2035
  • Table 51: South Asia & Pacific Market Value (USD Billion) Forecast by Treatment, 2020 to 2035
  • Table 52: South Asia & Pacific Market Volume (Million Patients Treated) Forecast by Treatment, 2020 to 2035
  • Table 53: South Asia & Pacific Market Value (USD Billion) Forecast by Route of Administration, 2020 to 2035
  • Table 54: South Asia & Pacific Market Volume (Million Patients Treated) Forecast by Route of Administration, 2020 to 2035
  • Table 55: South Asia & Pacific Market Value (USD Billion) Forecast by Sales Channel, 2020 to 2035
  • Table 56: South Asia & Pacific Market Volume (Million Patients Treated) Forecast by Sales Channel, 2020 to 2035
  • Table 57: Middle East and Africa Market Value (USD Billion) Forecast by Country, 2020 to 2035
  • Table 58: Middle East and Africa Market Volume (Million Patients Treated) Forecast by Country, 2020 to 2035
  • Table 59: Middle East and Africa Market Value (USD Billion) Forecast by Treatment, 2020 to 2035
  • Table 60: Middle East and Africa Market Volume (Million Patients Treated) Forecast by Treatment, 2020 to 2035
  • Table 61: Middle East and Africa Market Value (USD Billion) Forecast by Route of Administration, 2020 to 2035
  • Table 62: Middle East and Africa Market Volume (Million Patients Treated) Forecast by Route of Administration, 2020 to 2035
  • Table 63: Middle East and Africa Market Value (USD Billion) Forecast by Sales Channel, 2020 to 2035
  • Table 64: Middle East and Africa Market Volume (Million Patients Treated) Forecast by Sales Channel, 2020 to 2035

List of Figures

  • Figure 1: Global Market Volume (Million Patients Treated) Forecast 2020 to 2035
  • Figure 2: Global Market Pricing Analysis
  • Figure 3: Global Market Value (USD Billion) Forecast 2020 to 2035
  • Figure 4: Global Market Value Share and BPS Analysis by Treatment, 2025 and 2035
  • Figure 5: Global Market Y-o-Y Growth Comparison by Treatment, 2025 to 2035
  • Figure 6: Global Market Attractiveness Analysis by Treatment
  • Figure 7: Global Market Value Share and BPS Analysis by Route of Administration, 2025 and 2035
  • Figure 8: Global Market Y-o-Y Growth Comparison by Route of Administration, 2025 to 2035
  • Figure 9: Global Market Attractiveness Analysis by Route of Administration
  • Figure 10: Global Market Value Share and BPS Analysis by Sales Channel, 2025 and 2035
  • Figure 11: Global Market Y-o-Y Growth Comparison by Sales Channel, 2025 to 2035
  • Figure 12: Global Market Attractiveness Analysis by Sales Channel
  • Figure 13: Global Market Value (USD Billion) Share and BPS Analysis by Region, 2025 and 2035
  • Figure 14: Global Market Y-o-Y Growth Comparison by Region, 2025 to 2035
  • Figure 15: Global Market Attractiveness Analysis by Region
  • Figure 16: North America Market Incremental $ Opportunity, 2025 to 2035
  • Figure 17: Latin America Market Incremental $ Opportunity, 2025 to 2035
  • Figure 18: Western Europe Market Incremental $ Opportunity, 2025 to 2035
  • Figure 19: Eastern Europe Market Incremental $ Opportunity, 2025 to 2035
  • Figure 20: East Asia Market Incremental $ Opportunity, 2025 to 2035
  • Figure 21: South Asia & Pacific Market Incremental $ Opportunity, 2025 to 2035
  • Figure 22: Middle East and Africa Market Incremental $ Opportunity, 2025 to 2035
  • Figure 23: North America Market Value Share and BPS Analysis by Country, 2025 and 2035
  • Figure 24: North America Market Value Share and BPS Analysis by Treatment, 2025 and 2035
  • Figure 25: North America Market Y-o-Y Growth Comparison by Treatment, 2025 to 2035
  • Figure 26: North America Market Attractiveness Analysis by Treatment
  • Figure 27: North America Market Value Share and BPS Analysis by Route of Administration, 2025 and 2035
  • Figure 28: North America Market Y-o-Y Growth Comparison by Route of Administration, 2025 to 2035
  • Figure 29: North America Market Attractiveness Analysis by Route of Administration
  • Figure 30: North America Market Value Share and BPS Analysis by Sales Channel, 2025 and 2035
  • Figure 31: North America Market Y-o-Y Growth Comparison by Sales Channel, 2025 to 2035
  • Figure 32: North America Market Attractiveness Analysis by Sales Channel
  • Figure 33: Latin America Market Value Share and BPS Analysis by Country, 2025 and 2035
  • Figure 34: Latin America Market Value Share and BPS Analysis by Treatment, 2025 and 2035
  • Figure 35: Latin America Market Y-o-Y Growth Comparison by Treatment, 2025 to 2035
  • Figure 36: Latin America Market Attractiveness Analysis by Treatment
  • Figure 37: Latin America Market Value Share and BPS Analysis by Route of Administration, 2025 and 2035
  • Figure 38: Latin America Market Y-o-Y Growth Comparison by Route of Administration, 2025 to 2035
  • Figure 39: Latin America Market Attractiveness Analysis by Route of Administration
  • Figure 40: Latin America Market Value Share and BPS Analysis by Sales Channel, 2025 and 2035
  • Figure 41: Latin America Market Y-o-Y Growth Comparison by Sales Channel, 2025 to 2035
  • Figure 42: Latin America Market Attractiveness Analysis by Sales Channel
  • Figure 43: Western Europe Market Value Share and BPS Analysis by Country, 2025 and 2035
  • Figure 44: Western Europe Market Value Share and BPS Analysis by Treatment, 2025 and 2035
  • Figure 45: Western Europe Market Y-o-Y Growth Comparison by Treatment, 2025 to 2035
  • Figure 46: Western Europe Market Attractiveness Analysis by Treatment
  • Figure 47: Western Europe Market Value Share and BPS Analysis by Route of Administration, 2025 and 2035
  • Figure 48: Western Europe Market Y-o-Y Growth Comparison by Route of Administration, 2025 to 2035
  • Figure 49: Western Europe Market Attractiveness Analysis by Route of Administration
  • Figure 50: Western Europe Market Value Share and BPS Analysis by Sales Channel, 2025 and 2035
  • Figure 51: Western Europe Market Y-o-Y Growth Comparison by Sales Channel, 2025 to 2035
  • Figure 52: Western Europe Market Attractiveness Analysis by Sales Channel
  • Figure 53: Eastern Europe Market Value Share and BPS Analysis by Country, 2025 and 2035
  • Figure 54: Eastern Europe Market Value Share and BPS Analysis by Treatment, 2025 and 2035
  • Figure 55: Eastern Europe Market Y-o-Y Growth Comparison by Treatment, 2025 to 2035
  • Figure 56: Eastern Europe Market Attractiveness Analysis by Treatment
  • Figure 57: Eastern Europe Market Value Share and BPS Analysis by Route of Administration, 2025 and 2035
  • Figure 58: Eastern Europe Market Y-o-Y Growth Comparison by Route of Administration, 2025 to 2035
  • Figure 59: Eastern Europe Market Attractiveness Analysis by Route of Administration
  • Figure 60: Eastern Europe Market Value Share and BPS Analysis by Sales Channel, 2025 and 2035
  • Figure 61: Eastern Europe Market Y-o-Y Growth Comparison by Sales Channel, 2025 to 2035
  • Figure 62: Eastern Europe Market Attractiveness Analysis by Sales Channel
  • Figure 63: East Asia Market Value Share and BPS Analysis by Country, 2025 and 2035
  • Figure 64: East Asia Market Value Share and BPS Analysis by Treatment, 2025 and 2035
  • Figure 65: East Asia Market Y-o-Y Growth Comparison by Treatment, 2025 to 2035
  • Figure 66: East Asia Market Attractiveness Analysis by Treatment
  • Figure 67: East Asia Market Value Share and BPS Analysis by Route of Administration, 2025 and 2035
  • Figure 68: East Asia Market Y-o-Y Growth Comparison by Route of Administration, 2025 to 2035
  • Figure 69: East Asia Market Attractiveness Analysis by Route of Administration
  • Figure 70: East Asia Market Value Share and BPS Analysis by Sales Channel, 2025 and 2035
  • Figure 71: East Asia Market Y-o-Y Growth Comparison by Sales Channel, 2025 to 2035
  • Figure 72: East Asia Market Attractiveness Analysis by Sales Channel
  • Figure 73: South Asia & Pacific Market Value Share and BPS Analysis by Country, 2025 and 2035
  • Figure 74: South Asia & Pacific Market Value Share and BPS Analysis by Treatment, 2025 and 2035
  • Figure 75: South Asia & Pacific Market Y-o-Y Growth Comparison by Treatment, 2025 to 2035
  • Figure 76: South Asia & Pacific Market Attractiveness Analysis by Treatment
  • Figure 77: South Asia & Pacific Market Value Share and BPS Analysis by Route of Administration, 2025 and 2035
  • Figure 78: South Asia & Pacific Market Y-o-Y Growth Comparison by Route of Administration, 2025 to 2035
  • Figure 79: South Asia & Pacific Market Attractiveness Analysis by Route of Administration
  • Figure 80: South Asia & Pacific Market Value Share and BPS Analysis by Sales Channel, 2025 and 2035
  • Figure 81: South Asia & Pacific Market Y-o-Y Growth Comparison by Sales Channel, 2025 to 2035
  • Figure 82: South Asia & Pacific Market Attractiveness Analysis by Sales Channel
  • Figure 83: Middle East and Africa Market Value Share and BPS Analysis by Country, 2025 and 2035
  • Figure 84: Middle East and Africa Market Value Share and BPS Analysis by Treatment, 2025 and 2035
  • Figure 85: Middle East and Africa Market Y-o-Y Growth Comparison by Treatment, 2025 to 2035
  • Figure 86: Middle East and Africa Market Attractiveness Analysis by Treatment
  • Figure 87: Middle East and Africa Market Value Share and BPS Analysis by Route of Administration, 2025 and 2035
  • Figure 88: Middle East and Africa Market Y-o-Y Growth Comparison by Route of Administration, 2025 to 2035
  • Figure 89: Middle East and Africa Market Attractiveness Analysis by Route of Administration
  • Figure 90: Middle East and Africa Market Value Share and BPS Analysis by Sales Channel, 2025 and 2035
  • Figure 91: Middle East and Africa Market Y-o-Y Growth Comparison by Sales Channel, 2025 to 2035
  • Figure 92: Middle East and Africa Market Attractiveness Analysis by Sales Channel
  • Figure 93: Global Market - Tier Structure Analysis
  • Figure 94: Global Market - Company Share Analysis

Frequently Asked Questions

What is the estimated size of the dialysis induced anemia treatment market in 2025?

The industry is valued at USD 2 billion in 2025.

How large is the dialysis induced anemia treatment market expected to be by 2035?

It is projected to reach USD 4 billion by 2035.

What is the forecast CAGR for the dialysis induced anemia treatment market from 2025 to 2035?

The industry is anticipated to grow at a CAGR of 6.9% during this period.

Which treatment type dominates the dialysis induced anemia treatment market in 2025?

Injectable lead the treatment segment with a 61.9% industry share.

Who is the leading company in the dialysis induced anemia treatment market?

Amgen is the leading player with a 14% industry share.

Explore Similar Insights

Future Market Insights

Dialysis Induced Anemia Treatment Market