Home Dialysis Systems Market
Market Insights on Home Dialysis Systems covering sales outlook, demand forecast & up-to-date key trends
Home Dialysis Systems Market by Type, Product, Treatment & Region - Forecast 2022 - 2032
Home Dialysis Systems Market Outlook (2022-2032)
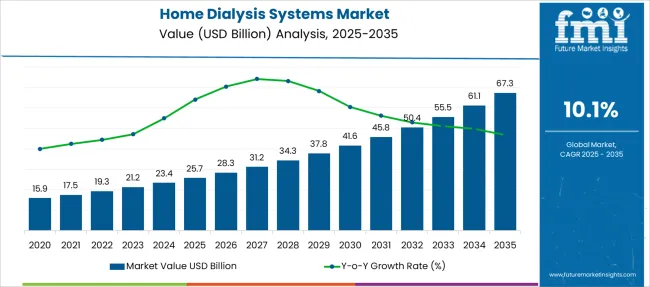
[342 Pages Report] The global home dialysis systems market is strengthening its hold on the global market at a promising CAGR of 10.1% between 2022 and 2032. The market is set to reach USD 45.81 Billion by 2032, while it holds a market value of USD 19.27 Billion in 2022.
“Growing number of diabetic and hypertension patients, increasing geriatric population coupled with government initiatives investing huge amounts of capital to the development of new products are fueling the sales of the home dialysis system.”
Global study on home dialysis systems has explained that the rising geriatric population is leading to an increasing number of people with kidney diseases along with end-stage renal disease (ESRD), where the procedure of dialysis comes into play. Dialysis helps in kidney transplantation while increasing the sales of home dialysis systems in new marketplaces. The government increasing health expenditure has also affected manufacturing.
Expanding home dialysis systems market size is attributed to the increasing disposable income, healthcare expenditure, and growing chronic diseases fueling the demand for home dialysis systems. The rising traffic in hospitals and patients preferring home care is pushing the end users to adopt these home dialysis systems. This increases the demand for home dialysis systems.
The rising concern around the risks associated with transplants coupled with a shortage of organ donors are adding to the traction, new innovative healthcare companies are making new and advanced home dialysis systems that cover most of the transplant processes. This fuels the demand for home dialysis systems.
Attributes |
Value |
Home dialysis systems Market Size (2022) |
US$ 19.27 Billion |
Home dialysis systems Market Projected Size (2032) |
US$ 45.81 Billion |
Home dialysis systems Market Value CAGR (2022-2032) |
10.1% |
Let us know your requirement to get
100% FREE customization
What are the Major Driving Factors for the Home dialysis systems Market?
“Covid-19 and its spread have fueled the growth for the home dialysis systems as the hospitals and healthcare were indulged with the high frequency of covid-19 patients while fueling the sales of home dialysis systems.”
As the covid-19 has triggered the need for home dialysis systems as there was a huge number of patients with failing body organs. The frequently expanding healthcare market is also attributed to the growth of home dialysis systems. According to the home dialysis systems market survey, the clinical treatment centers, chronic diseases, and hospitals consume the most of the home dialysis systems market. With the advent of the COVID-19 outbreak, home hemodialysis has gotten a lot of traction since it allows patients to do their dialysis at home in a home environment.
According to Physidia, COVID contamination is 50% lower in-home dialysis patients than in in-center facilities, and numerous countries have implemented incentives to encourage more people to use home hemodialysis. This pushes the sales of home dialysis systems.
What are the Possible Limitations for the Home dialysis systems Market Future Trends?
“The high cost associated to the home dialysis systems, manufacturing halt due to lockdowns and logistics ban along with end users preferring healthcare units over these systems are hampering the demand for home dialysis systems.”
The growth outlook of home dialysis systems has been hindered through the course of the pandemic, high capital investments, and transplant alternatives. With the growing demand for home dialysis systems, the growing capital crunch in organizations and individuals is also one reality. This leads to the lower adoption of these systems in the end user’s household.
Another factor that slows down the sales of home dialysis systems is the lower production cycle, especially during the pandemic, and its implications such as lockdowns and logistics bans have affected the availability of raw parts and technology in order to complete production, restricting the demand for home dialysis systems globally.
Find your sweet spots for generating winning opportunities in this market.
Talk to AnalystComparative View of Adjacent Home Dialysis Systems Market
Home Dialysis systems Market:
Attributes |
Home Dialysis systems Market |
CAGR (2022 to 2032) |
10.1% |
Market Value (2022) |
US$ 19.27 Billion |
Growth Factor |
A higher number of chronic diseases like kidney failure or end-stage renal disease are pushing the end user to adapt to home dialysis systems and expand its market size. |
Future Opportunities |
Latest technology like artificial intelligence and other healthcare automation tools along with easy-to-install procedures are creating multiple growth opportunities for the home dialysis market. |
Market Trends |
The spread of coronavirus and halt of emergency services have pushed end users suffering from a condition or transplant to adopt the home dialysis market. |
Blood Glucose Meter Market:
Attributes |
Blood Glucose Meter Market |
CAGR (2022 to 2032) |
9.4% |
Market Value (2022) |
US$ 10.89 Billion |
Growth Factor |
Rising cases of type one and type two diabetes along with the geriatric population and its lifestyle giving birth to two multiple diseases are pushing the demand of blood glucose meter. |
Future Opportunities |
Innovative ideas and their experiment with health tracking device and vital monitoring tools is creating new future prospects for the blood glucose meter market. et. |
Market Trends |
The blood glucose meter market is dynamic as diagnostics kit keeps on changing the formulas and set up new trends for the market. |
Homecare Oxygen Concentrators Market:
Attributes |
Homecare Oxygen Concentrators Market |
CAGR (2022 to 2032) |
7.1% |
Market Value (2022) |
US$ 1.39 Billion |
Growth Factor |
The growing demand for homecare oxygen concentrators has been rising since the advent of coronavirus and its post implications like chest infection and bronchitis. |
Future Opportunities |
The higher adoption rates of these concentrators have led to the experiments and research and developments around the concentrator that enhances its intensity and provides relief to the patient, creating opportunities for the market. |
Market Trends |
The government and its high investments in oxygen production have helped the market gain traction. Especially after the second wave of covid-19 spread, the government has invested almost double what it used to invest in the oxygen market. t. |
The home dialysis systems market report states that patients in critical conditions tend to benefit from these technological advancements and improve their health conditions during an organ transplant. Different dialysis works on different fronts and with specific transplants and stages. These systems are generally used in healthcare units and hospitals. Home dialysis systems come with less hassle and come with easy installation process so that the patient can be cured at home with the utmost care.
The demand for home dialysis systems is in increasing with the geriatric population and the declining average age of patients going through dialysis. In the research at FMI, as per the centers for disease control and prevention (CDC), end-stage renal disease (EKSD) has penetrated in the US at large, affecting more than 785000 of its citizens, requiring dialysis.
Category-wise Insights for Home dialysis systems Market
Which Product Type of Home dialysis systems is Most Preferred in the Global Market?
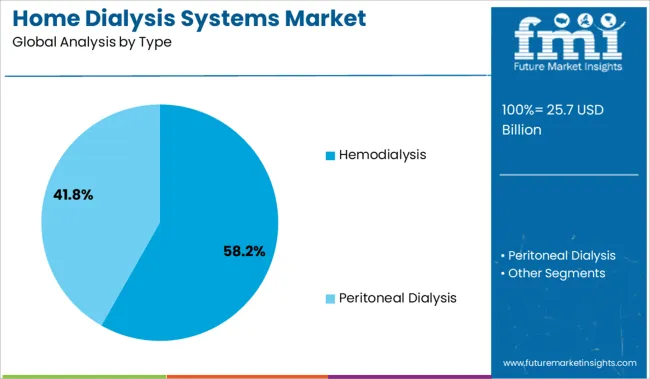
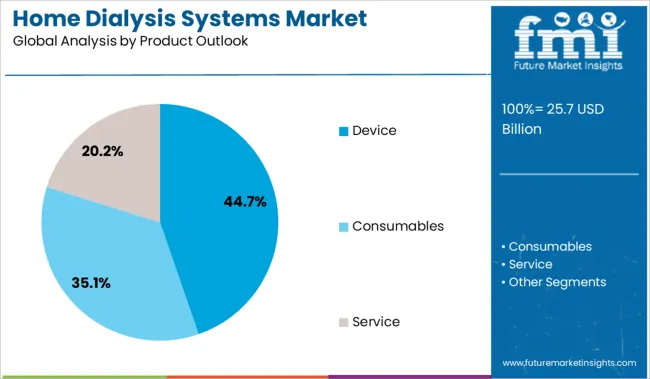
According to the home dialysis systems market analysis, the market is categorized into product, type, and treatment. The product category is distributed into Devices, consumables, and Services. The leading segment in the product category is service as it is easily installed and applicable for patients along with its best applications in emergency conditions, holding 55.44% of the market share.
Higher growth opportunities for this segment are attributed to its prevalent use during the covid-19 and post covid implications. Though consumables segment thrives at the highest CAGR and is likely to cross the market space of services segment by the end of the forecast period in the global market share, flourishing the demand for Home dialysis systems.
What is the Major Treatment Type of the Global Home dialysis systems Market?
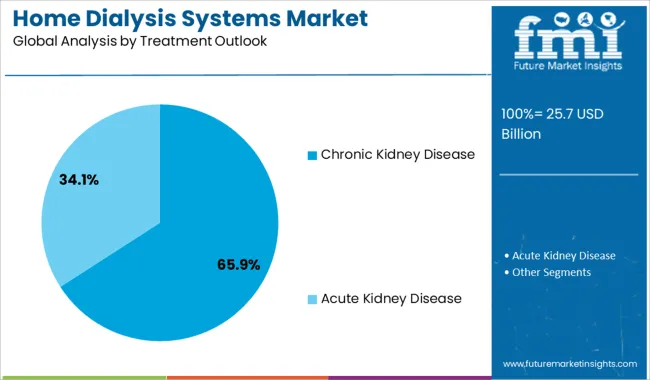
Emerging trends in the home dialysis systems market show that the chronic kidney disease segment is the leading treatment category. The other segment of the treatment category is Acute Kidney Disease.
The chronic kidney disease segment holds 80.22% of the global revenue. The factors contributing to the growth of this segment are rising kidney issues, high blood pressure, and multiple pre-existing illnesses. Other diseases like obesity and diabetes also have their implications, and chronic kidney disease is one of the most common conditions. This increases the sales of home dialysis systems.

A unified Market Research Subscription Platform, built for today's disparate research needs.
Regional Analysis
What is the Growth Outlook for the North American Home Dialysis Systems Market?
North America is anticipated to hold 38.40% of the global share in the home dialysis systems market by the end of 2032.
The rising home dialysis systems market in the North American region is owed to the highest geriatric population, youth suffering from chronic diseases like diabetes and blood pressure. These conditions are born because of lifestyle irregularities. This region has fueled the market as the number of patients suffering from kidney (Remal) based disease are the high and high impact of covid-19 has led a lot of patients to adopt the home dialysis units because of the post covid implications, fueling the demand for home dialysis systems in new regions. Higher investments through government programs have also fueled the sales of home dialysis systems.
How is the Performance of Asia Pacific Home Dialysis Systems Market?
The Asia Pacific region is anticipated to grow in the home dialysis systems market with the highest CAGR as the cases of failing kidney is rising in the region. This happens because of the lower quality of drinking water and unhygienic food.
Government initiatives, increasing healthcare spending, rising awareness campaigns regarding CKD, technologically enhanced products, and the presence of newly-established state-of-the-art healthcare facilities in the region are a few other factors contributing to market growth, fueling the demand for home dialysis systems.
How is the Start-up Ecosystem in the Home dialysis systems Market?
The home dialysis system market size expands and its credit goes to the rising chronic and respiratory diseases. The start-up system vendors are trying to provide the best dialysis solutions with innovative technology and modern-age tools. Especially after the covid-19, startups that deal with home healthcare relief systems have increased, fueling the sales of home dialysis systems.
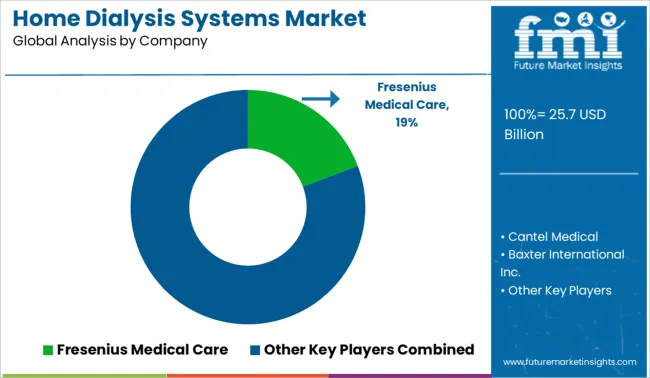
Competitive Landscape for the Home dialysis systems Market
The home dialysis systems market has various key competitors that focus on expanding their supply chain while expanding the sales channel. The key competitors understand and focus on making the devices and services easy to access and operate while making them cost friendly for the end users. This makes the competitive landscape more dynamic and versatile, owing to the expansion of home dialysis systems market.
The key competitors flourishing to the growth of home dialysis systems are B Fresenius Medical Care, Cantel Medical., Baxter International Inc., Europlaz Technologies Ltd., Quanta Dialysis Technologies, Outset Medical, AWAK Technologies and DaVita.
Recent Developments in Global Home dialysis systems Market
- B Fresenius Medical Care has introduced its Peritoneal Dialysis under its home therapies section that provides virtual reality training, fluids for PD, CAPD, and PD support and monitoring. This accelerates the sales of home dialysis systems in new regions.
- Launched in 1960s, Baxter International Inc has restored its Peritoneal Dialysis for End-Stage Renal Disease with remote patient management and RPM technology enabling automated PD. This fuels the demand for home dialysis system globally.
Global Home dialysis systems Market Key Players
- B Fresenius Medical Care
- Cantel Medical.
- Quanta Dialysis Technologies
- Outset Medical
- AWAK Technologies
- DaVita.
- Baxter International Inc.
- Europlaz Technologies Ltd
Home dialysis systems Market by Segmentation
By Type:
- Hemodialysis
- Conventional
- Short Daily Hemodialysis
- Nocturnal Hemodialysis
- Peritoneal Dialysis
- Continuous Ambulatory Peritoneal Dialysis (CAPD)
- Ambulatory Peritoneal Dialysis (APD)
By Product Outlook:
- Device
- Machine
- Dialyzers
- Water Treatment System
- Others
- Consumables
- Bloodlines
- Concentrates
- Catheters
- Others
- Service
By Treatment Outlook:
- Acute Kidney Disease
- Chronic Kidney Disease
By Region:
- North America
- Latin America
- Europe
- East Asia
- South Asia
- Oceania
- Middle East and Africa
Frequently Asked Questions
The home dialysis systems market is expected to grow at 10.1% CAGR over 2022-2032.
The home dialysis systems market is estimated to be around US$ 19.47 Billion in 2022.
The home dialysis systems market is anticipated to reach a revenue of US$ 45.81 Billion by 2032.
The Services segment is forecasted to hold the largest market share by product type in the home dialysis systems market.
North American region is the most dominant region for home dialysis systems market in 2022 with a market share of 38.40% of the global market.
Table of Content
1. Executive Summary
1.1. Global Market Outlook
1.2. Demand-side Trends
1.3. Supply-side Trends
1.4. Technology Roadmap Analysis
1.5. Analysis and Recommendations
2. Market Overview
2.1. Market Coverage / Taxonomy
2.2. Market Definition / Scope / Limitations
3. Market Background
3.1. Market Dynamics
3.1.1. Drivers
3.1.2. Restraints
3.1.3. Opportunity
3.1.4. Trends
3.2. Scenario Forecast
3.2.1. Demand in Optimistic Scenario
3.2.2. Demand in Likely Scenario
3.2.3. Demand in Conservative Scenario
3.3. Opportunity Map Analysis
3.4. Product Life Cycle Analysis
3.5. Supply Chain Analysis
3.5.1. Supply Side Participants and their Roles
3.5.1.1. Producers
3.5.1.2. Mid-Level Participants (Traders/ Agents/ Brokers)
3.5.1.3. Wholesalers and Distributors
3.5.2. Value Added and Value Created at Node in the Supply Chain
3.5.3. List of Raw Material Suppliers
3.5.4. List of Existing and Potential Buyer’s
3.6. Investment Feasibility Matrix
3.7. Value Chain Analysis
3.7.1. Profit Margin Analysis
3.7.2. Wholesalers and Distributors
3.7.3. Retailers
3.8. PESTLE and Porter’s Analysis
3.9. Regulatory Landscape
3.9.1. By Key Regions
3.9.2. By Key Countries
3.10. Regional Parent Market Outlook
3.11. Production and Consumption Statistics
3.12. Import and Export Statistics
4. Global Home Dialysis Systems Market Analysis 2017-2021 and Forecast, 2022-2032
4.1. Historical Market Size Value (US$ Mn) Analysis, 2017-2021
4.2. Current and Future Market Size Value (US$ Mn) Projections, 2022-2032
4.2.1. Y-o-Y Growth Trend Analysis
4.2.2. Absolute $ Opportunity Analysis
5. Global Home Dialysis Systems Market Analysis 2017-2021 and Forecast 2022-2032, By Type
5.1. Introduction / Key Findings
5.2. Historical Market Size Value (US$ Mn) Analysis By Type, 2017-2021
5.3. Current and Future Market Size Value (US$ Mn) Analysis and Forecast By Type, 2022-2032
5.3.1. Hemodialysis
5.3.1.1. Conventional
5.3.1.2. Short Daily Hemodialysis
5.3.1.3. Nocturnal Hemodialysis
5.3.2. Peritoneal Dialysis
5.3.2.1. Continuous Ambulatory Peritoneal Dialysis
5.3.2.2. Ambulatory Peritoneal Dialysis
5.4. Y-o-Y Growth Trend Analysis By Type, 2017-2021
5.5. Absolute $ Opportunity Analysis By Type, 2022-2032
6. Global Home Dialysis Systems Market Analysis 2017-2021 and Forecast 2022-2032, By Product
6.1. Introduction / Key Findings
6.2. Historical Market Size Value (US$ Mn) Analysis By Product, 2017-2021
6.3. Current and Future Market Size Value (US$ Mn) Analysis and Forecast By Product, 2022-2032
6.3.1. Device
6.3.1.1. Machine
6.3.1.2. Dialyzers
6.3.1.3. Water Treatment System
6.3.1.4. Other Devices
6.3.2. Consumables
6.3.2.1. Bloodlines
6.3.2.2. Concentrates
6.3.2.3. Catheters
6.3.2.4. Other Consumables
6.3.3. Service
6.4. Y-o-Y Growth Trend Analysis By Product, 2017-2021
6.5. Absolute $ Opportunity Analysis By Product, 2022-2032
7. Global Home Dialysis Systems Market Analysis 2017-2021 and Forecast 2022-2032, By Treatment
7.1. Introduction / Key Findings
7.2. Historical Market Size Value (US$ Mn) Analysis By Treatment, 2017-2021
7.3. Current and Future Market Size Value (US$ Mn) Analysis and Forecast By Treatment, 2022-2032
7.3.1. Acute Kidney Disease
7.3.2. Chronic Kidney Disease
7.4. Y-o-Y Growth Trend Analysis By Treatment, 2017-2021
7.5. Absolute $ Opportunity Analysis By Treatment, 2022-2032
8. Global Home Dialysis Systems Market Analysis 2017-2021 and Forecast 2022-2032, By Region
8.1. Introduction
8.2. Historical Market Size Value (US$ Mn) Analysis By Region, 2017-2021
8.3. Current Market Size Value (US$ Mn) Analysis and Forecast By Region, 2022-2032
8.3.1. North America
8.3.2. Latin America
8.3.3. Europe
8.3.4. Asia Pacific
8.3.5. MEA
8.4. Market Attractiveness Analysis By Region
9. North America Home Dialysis Systems Market Analysis 2017-2021 and Forecast 2022-2032, By Country
9.1. Historical Market Size Value (US$ Mn) Trend Analysis By Market Taxonomy, 2017-2021
9.2. Market Size Value (US$ Mn) Forecast By Market Taxonomy, 2022-2032
9.2.1. By Country
9.2.1.1. U.S.
9.2.1.2. Canada
9.2.2. By Type
9.2.3. By Product
9.2.4. By Treatment
9.3. Market Attractiveness Analysis
9.3.1. By Country
9.3.2. By Type
9.3.3. By Product
9.3.4. By Treatment
9.4. Key Takeaways
10. Latin America Home Dialysis Systems Market Analysis 2017-2021 and Forecast 2022-2032, By Country
10.1. Historical Market Size Value (US$ Mn) Trend Analysis By Market Taxonomy, 2017-2021
10.2. Market Size Value (US$ Mn) Forecast By Market Taxonomy, 2022-2032
10.2.1. By Country
10.2.1.1. Brazil
10.2.1.2. Mexico
10.2.1.3. Rest of Latin America
10.2.2. By Type
10.2.3. By Product
10.2.4. By Treatment
10.3. Market Attractiveness Analysis
10.3.1. By Country
10.3.2. By Type
10.3.3. By Product
10.3.4. By Treatment
10.4. Key Takeaways
11. Europe Home Dialysis Systems Market Analysis 2017-2021 and Forecast 2022-2032, By Country
11.1. Historical Market Size Value (US$ Mn) Trend Analysis By Market Taxonomy, 2017-2021
11.2. Market Size Value (US$ Mn) Forecast By Market Taxonomy, 2022-2032
11.2.1. By Country
11.2.1.1. Germany
11.2.1.2. U.K.
11.2.1.3. France
11.2.1.4. Spain
11.2.1.5. Italy
11.2.1.6. Rest of Europe
11.2.2. By Type
11.2.3. By Product
11.2.4. By Treatment
11.3. Market Attractiveness Analysis
11.3.1. By Country
11.3.2. By Type
11.3.3. By Product
11.3.4. By Treatment
11.4. Key Takeaways
12. Asia Pacific Home Dialysis Systems Market Analysis 2017-2021 and Forecast 2022-2032, By Country
12.1. Historical Market Size Value (US$ Mn) Trend Analysis By Market Taxonomy, 2017-2021
12.2. Market Size Value (US$ Mn) Forecast By Market Taxonomy, 2022-2032
12.2.1. By Country
12.2.1.1. China
12.2.1.2. Japan
12.2.1.3. South Korea
12.2.1.4. Malaysia
12.2.1.5. Singapore
12.2.1.6. Australia
12.2.1.7. New Zealand
12.2.1.8. Rest of APAC
12.2.2. By Type
12.2.3. By Product
12.2.4. By Treatment
12.3. Market Attractiveness Analysis
12.3.1. By Country
12.3.2. By Type
12.3.3. By Product
12.3.4. By Treatment
12.4. Key Takeaways
13. MEA Home Dialysis Systems Market Analysis 2017-2021 and Forecast 2022-2032, By Country
13.1. Historical Market Size Value (US$ Mn) Trend Analysis By Market Taxonomy, 2017-2021
13.2. Market Size Value (US$ Mn) Forecast By Market Taxonomy, 2022-2032
13.2.1. By Country
13.2.1.1. GCC Countries
13.2.1.2. South Africa
13.2.1.3. Israel
13.2.1.4. Rest of MEA
13.2.2. By Type
13.2.3. By Product
13.2.4. By Treatment
13.3. Market Attractiveness Analysis
13.3.1. By Country
13.3.2. By Type
13.3.3. By Product
13.3.4. By Treatment
13.4. Key Takeaways
14. Key Countries Home Dialysis Systems Market Analysis
14.1. U.S.
14.1.1. Pricing Analysis
14.1.2. Market Share Analysis, 2021
14.1.2.1. By Type
14.1.2.2. By Product
14.1.2.3. By Treatment
14.2. Canada
14.2.1. Pricing Analysis
14.2.2. Market Share Analysis, 2021
14.2.2.1. By Type
14.2.2.2. By Product
14.2.2.3. By Treatment
14.3. Brazil
14.3.1. Pricing Analysis
14.3.2. Market Share Analysis, 2021
14.3.2.1. By Type
14.3.2.2. By Product
14.3.2.3. By Treatment
14.4. Mexico
14.4.1. Pricing Analysis
14.4.2. Market Share Analysis, 2021
14.4.2.1. By Type
14.4.2.2. By Product
14.4.2.3. By Treatment
14.5. Germany
14.5.1. Pricing Analysis
14.5.2. Market Share Analysis, 2021
14.5.2.1. By Type
14.5.2.2. By Product
14.5.2.3. By Treatment
14.6. U.K.
14.6.1. Pricing Analysis
14.6.2. Market Share Analysis, 2021
14.6.2.1. By Type
14.6.2.2. By Product
14.6.2.3. By Treatment
14.7. France
14.7.1. Pricing Analysis
14.7.2. Market Share Analysis, 2021
14.7.2.1. By Type
14.7.2.2. By Product
14.7.2.3. By Treatment
14.8. Spain
14.8.1. Pricing Analysis
14.8.2. Market Share Analysis, 2021
14.8.2.1. By Type
14.8.2.2. By Product
14.8.2.3. By Treatment
14.9. Italy
14.9.1. Pricing Analysis
14.9.2. Market Share Analysis, 2021
14.9.2.1. By Type
14.9.2.2. By Product
14.9.2.3. By Treatment
14.10. China
14.10.1. Pricing Analysis
14.10.2. Market Share Analysis, 2021
14.10.2.1. By Type
14.10.2.2. By Product
14.10.2.3. By Treatment
14.11. Japan
14.11.1. Pricing Analysis
14.11.2. Market Share Analysis, 2021
14.11.2.1. By Type
14.11.2.2. By Product
14.11.2.3. By Treatment
14.12. South Korea
14.12.1. Pricing Analysis
14.12.2. Market Share Analysis, 2021
14.12.2.1. By Type
14.12.2.2. By Product
14.12.2.3. By Treatment
14.13. Malaysia
14.13.1. Pricing Analysis
14.13.2. Market Share Analysis, 2021
14.13.2.1. By Type
14.13.2.2. By Product
14.13.2.3. By Treatment
14.14. Singapore
14.14.1. Pricing Analysis
14.14.2. Market Share Analysis, 2021
14.14.2.1. By Type
14.14.2.2. By Product
14.14.2.3. By Treatment
14.15. Australia
14.15.1. Pricing Analysis
14.15.2. Market Share Analysis, 2021
14.15.2.1. By Type
14.15.2.2. By Product
14.15.2.3. By Treatment
14.16. New Zealand
14.16.1. Pricing Analysis
14.16.2. Market Share Analysis, 2021
14.16.2.1. By Type
14.16.2.2. By Product
14.16.2.3. By Treatment
14.17. GCC Countries
14.17.1. Pricing Analysis
14.17.2. Market Share Analysis, 2021
14.17.2.1. By Type
14.17.2.2. By Product
14.17.2.3. By Treatment
14.18. South Africa
14.18.1. Pricing Analysis
14.18.2. Market Share Analysis, 2021
14.18.2.1. By Type
14.18.2.2. By Product
14.18.2.3. By Treatment
14.19. Israel
14.19.1. Pricing Analysis
14.19.2. Market Share Analysis, 2021
14.19.2.1. By Type
14.19.2.2. By Product
14.19.2.3. By Treatment
15. Market Structure Analysis
15.1. Competition Dashboard
15.2. Competition Benchmarking
15.3. Market Share Analysis of Top Players
15.3.1. By Regional
15.3.2. By Type
15.3.3. By Product
15.3.4. By Treatment
16. Competition Analysis
16.1. Competition Deep Dive
16.1.1. B Fresenius Medical Care
16.1.1.1. Overview
16.1.1.2. Product Portfolio
16.1.1.3. Profitability by Market Segments
16.1.1.4. Sales Footprint
16.1.1.5. Strategy Overview
16.1.1.5.1. Marketing Strategy
16.1.1.5.2. Product Strategy
16.1.1.5.3. Channel Strategy
16.1.2. Cantel Medical.
16.1.2.1. Overview
16.1.2.2. Product Portfolio
16.1.2.3. Profitability by Market Segments
16.1.2.4. Sales Footprint
16.1.2.5. Strategy Overview
16.1.2.5.1. Marketing Strategy
16.1.2.5.2. Product Strategy
16.1.2.5.3. Channel Strategy
16.1.3. Baxter International Inc.
16.1.3.1. Overview
16.1.3.2. Product Portfolio
16.1.3.3. Profitability by Market Segments
16.1.3.4. Sales Footprint
16.1.3.5. Strategy Overview
16.1.3.5.1. Marketing Strategy
16.1.3.5.2. Product Strategy
16.1.3.5.3. Channel Strategy
16.1.4. Europlaz Technologies Ltd
16.1.4.1. Overview
16.1.4.2. Product Portfolio
16.1.4.3. Profitability by Market Segments
16.1.4.4. Sales Footprint
16.1.4.5. Strategy Overview
16.1.4.5.1. Marketing Strategy
16.1.4.5.2. Product Strategy
16.1.4.5.3. Channel Strategy
16.1.5. Quanta Dialysis Technologies
16.1.5.1. Overview
16.1.5.2. Product Portfolio
16.1.5.3. Profitability by Market Segments
16.1.5.4. Sales Footprint
16.1.5.5. Strategy Overview
16.1.5.5.1. Marketing Strategy
16.1.5.5.2. Product Strategy
16.1.5.5.3. Channel Strategy
16.1.6. Outset Medical
16.1.6.1. Overview
16.1.6.2. Product Portfolio
16.1.6.3. Profitability by Market Segments
16.1.6.4. Sales Footprint
16.1.6.5. Strategy Overview
16.1.6.5.1. Marketing Strategy
16.1.6.5.2. Product Strategy
16.1.6.5.3. Channel Strategy
16.1.7. AWAK Technologies
16.1.7.1. Overview
16.1.7.2. Product Portfolio
16.1.7.3. Profitability by Market Segments
16.1.7.4. Sales Footprint
16.1.7.5. Strategy Overview
16.1.7.5.1. Marketing Strategy
16.1.7.5.2. Product Strategy
16.1.7.5.3. Channel Strategy
16.1.8. DaVita
16.1.8.1. Overview
16.1.8.2. Product Portfolio
16.1.8.3. Profitability by Market Segments
16.1.8.4. Sales Footprint
16.1.8.5. Strategy Overview
16.1.8.5.1. Marketing Strategy
16.1.8.5.2. Product Strategy
16.1.8.5.3. Channel Strategy
16.1.9. Becton, Dickinson and Company
16.1.9.1. Overview
16.1.9.2. Product Portfolio
16.1.9.3. Profitability by Market Segments
16.1.9.4. Sales Footprint
16.1.9.5. Strategy Overview
16.1.9.5.1. Marketing Strategy
16.1.9.5.2. Product Strategy
16.1.9.5.3. Channel Strategy
16.1.10. Dialife SA
16.1.10.1. Overview
16.1.10.2. Product Portfolio
16.1.10.3. Profitability by Market Segments
16.1.10.4. Sales Footprint
16.1.10.5. Strategy Overview
16.1.10.5.1. Marketing Strategy
16.1.10.5.2. Product Strategy
16.1.10.5.3. Channel Strategy
16.1.11. Fresenius Medical Care AG & Co. KGaA
16.1.11.1. Overview
16.1.11.2. Product Portfolio
16.1.11.3. Profitability by Market Segments
16.1.11.4. Sales Footprint
16.1.11.5. Strategy Overview
16.1.11.5.1. Marketing Strategy
16.1.11.5.2. Product Strategy
16.1.11.5.3. Channel Strategy
16.1.12. Baxter International Inc.
16.1.12.1. Overview
16.1.12.2. Product Portfolio
16.1.12.3. Profitability by Market Segments
16.1.12.4. Sales Footprint
16.1.12.5. Strategy Overview
16.1.12.5.1. Marketing Strategy
16.1.12.5.2. Product Strategy
16.1.12.5.3. Channel Strategy
17. Assumptions & Acronyms Used
18. Research Methodology
Let us know your requirement to get
100% FREE customization
List of Tables
Table 1: Global Home Dialysis Systems Market Value (US$ Mn) Forecast by Region, 2017-2032
Table 2: Global Home Dialysis Systems Market Forecast by Region, 2017-2032
Table 3: Global Home Dialysis Systems Market Value (US$ Mn) Forecast by Type, 2017-2032
Table 4: Global Home Dialysis Systems Market Forecast by Type, 2017-2032
Table 5: Global Home Dialysis Systems Market Value (US$ Mn) Forecast by Product, 2017-2032
Table 6: Global Home Dialysis Systems Market Forecast by Product, 2017-2032
Table 7: Global Home Dialysis Systems Market Value (US$ Mn) Forecast by Treatment, 2017-2032
Table 8: Global Home Dialysis Systems Market Forecast by Treatment, 2017-2032
Table 9: North America Home Dialysis Systems Market Value (US$ Mn) Forecast by Country, 2017-2032
Table 10: North America Home Dialysis Systems Market Forecast by Country, 2017-2032
Table 11: North America Home Dialysis Systems Market Value (US$ Mn) Forecast by Type, 2017-2032
Table 12: North America Home Dialysis Systems Market Forecast by Type, 2017-2032
Table 13: North America Home Dialysis Systems Market Value (US$ Mn) Forecast by Product, 2017-2032
Table 14: North America Home Dialysis Systems Market Forecast by Product, 2017-2032
Table 15: North America Home Dialysis Systems Market Value (US$ Mn) Forecast by Treatment, 2017-2032
Table 16: North America Home Dialysis Systems Market Forecast by Treatment, 2017-2032
Table 17: Latin America Home Dialysis Systems Market Value (US$ Mn) Forecast by Country, 2017-2032
Table 18: Latin America Home Dialysis Systems Market Forecast by Country, 2017-2032
Table 19: Latin America Home Dialysis Systems Market Value (US$ Mn) Forecast by Type, 2017-2032
Table 20: Latin America Home Dialysis Systems Market Forecast by Type, 2017-2032
Table 21: Latin America Home Dialysis Systems Market Value (US$ Mn) Forecast by Product, 2017-2032
Table 22: Latin America Home Dialysis Systems Market Forecast by Product, 2017-2032
Table 23: Latin America Home Dialysis Systems Market Value (US$ Mn) Forecast by Treatment, 2017-2032
Table 24: Latin America Home Dialysis Systems Market Forecast by Treatment, 2017-2032
Table 25: Europe Home Dialysis Systems Market Value (US$ Mn) Forecast by Country, 2017-2032
Table 26: Europe Home Dialysis Systems Market Forecast by Country, 2017-2032
Table 27: Europe Home Dialysis Systems Market Value (US$ Mn) Forecast by Type, 2017-2032
Table 28: Europe Home Dialysis Systems Market Forecast by Type, 2017-2032
Table 29: Europe Home Dialysis Systems Market Value (US$ Mn) Forecast by Product, 2017-2032
Table 30: Europe Home Dialysis Systems Market Forecast by Product, 2017-2032
Table 31: Europe Home Dialysis Systems Market Value (US$ Mn) Forecast by Treatment, 2017-2032
Table 32: Europe Home Dialysis Systems Market Forecast by Treatment, 2017-2032
Table 33: Asia Pacific Home Dialysis Systems Market Value (US$ Mn) Forecast by Country, 2017-2032
Table 34: Asia Pacific Home Dialysis Systems Market Forecast by Country, 2017-2032
Table 35: Asia Pacific Home Dialysis Systems Market Value (US$ Mn) Forecast by Type, 2017-2032
Table 36: Asia Pacific Home Dialysis Systems Market Forecast by Type, 2017-2032
Table 37: Asia Pacific Home Dialysis Systems Market Value (US$ Mn) Forecast by Product, 2017-2032
Table 38: Asia Pacific Home Dialysis Systems Market Forecast by Product, 2017-2032
Table 39: Asia Pacific Home Dialysis Systems Market Value (US$ Mn) Forecast by Treatment, 2017-2032
Table 40: Asia Pacific Home Dialysis Systems Market Forecast by Treatment, 2017-2032
Table 41: MEA Home Dialysis Systems Market Value (US$ Mn) Forecast by Country, 2017-2032
Table 42: MEA Home Dialysis Systems Market Forecast by Country, 2017-2032
Table 43: MEA Home Dialysis Systems Market Value (US$ Mn) Forecast by Type, 2017-2032
Table 44: MEA Home Dialysis Systems Market Forecast by Type, 2017-2032
Table 45: MEA Home Dialysis Systems Market Value (US$ Mn) Forecast by Product, 2017-2032
Table 46: MEA Home Dialysis Systems Market Forecast by Product, 2017-2032
Table 47: MEA Home Dialysis Systems Market Value (US$ Mn) Forecast by Treatment, 2017-2032
Table 48: MEA Home Dialysis Systems Market Forecast by Treatment, 2017-2032
Find your sweet spots for generating winning opportunities in this market.
Talk to AnalystList of Charts
Figure 1: Global Home Dialysis Systems Market Value (US$ Mn) by Type, 2022-2032
Figure 2: Global Home Dialysis Systems Market Value (US$ Mn) by Product, 2022-2032
Figure 3: Global Home Dialysis Systems Market Value (US$ Mn) by Treatment, 2022-2032
Figure 4: Global Home Dialysis Systems Market Value (US$ Mn) by Region, 2022-2032
Figure 5: Global Home Dialysis Systems Market Value (US$ Mn) Analysis by Region, 2017-2032
Figure 6: Global Home Dialysis Systems Market Analysis by Region, 2017-2032
Figure 7: Global Home Dialysis Systems Market Value Share (%) and BPS Analysis by Region, 2022-2032
Figure 8: Global Home Dialysis Systems Market Y-o-Y Growth (%) Projections by Region, 2022-2032
Figure 9: Global Home Dialysis Systems Market Value (US$ Mn) Analysis by Type, 2017-2032
Figure 10: Global Home Dialysis Systems Market Analysis by Type, 2017-2032
Figure 11: Global Home Dialysis Systems Market Value Share (%) and BPS Analysis by Type, 2022-2032
Figure 12: Global Home Dialysis Systems Market Y-o-Y Growth (%) Projections by Type, 2022-2032
Figure 13: Global Home Dialysis Systems Market Value (US$ Mn) Analysis by Product, 2017-2032
Figure 14: Global Home Dialysis Systems Market Analysis by Product, 2017-2032
Figure 15: Global Home Dialysis Systems Market Value Share (%) and BPS Analysis by Product, 2022-2032
Figure 16: Global Home Dialysis Systems Market Y-o-Y Growth (%) Projections by Product, 2022-2032
Figure 17: Global Home Dialysis Systems Market Value (US$ Mn) Analysis by Treatment, 2017-2032
Figure 18: Global Home Dialysis Systems Market Analysis by Treatment, 2017-2032
Figure 19: Global Home Dialysis Systems Market Value Share (%) and BPS Analysis by Treatment, 2022-2032
Figure 20: Global Home Dialysis Systems Market Y-o-Y Growth (%) Projections by Treatment, 2022-2032
Figure 21: Global Home Dialysis Systems Market Attractiveness by Type, 2022-2032
Figure 22: Global Home Dialysis Systems Market Attractiveness by Product, 2022-2032
Figure 23: Global Home Dialysis Systems Market Attractiveness by Treatment, 2022-2032
Figure 24: Global Home Dialysis Systems Market Attractiveness by Region, 2022-2032
Figure 25: North America Home Dialysis Systems Market Value (US$ Mn) by Type, 2022-2032
Figure 26: North America Home Dialysis Systems Market Value (US$ Mn) by Product, 2022-2032
Figure 27: North America Home Dialysis Systems Market Value (US$ Mn) by Treatment, 2022-2032
Figure 28: North America Home Dialysis Systems Market Value (US$ Mn) by Country, 2022-2032
Figure 29: North America Home Dialysis Systems Market Value (US$ Mn) Analysis by Country, 2017-2032
Figure 30: North America Home Dialysis Systems Market Analysis by Country, 2017-2032
Figure 31: North America Home Dialysis Systems Market Value Share (%) and BPS Analysis by Country, 2022-2032
Figure 32: North America Home Dialysis Systems Market Y-o-Y Growth (%) Projections by Country, 2022-2032
Figure 33: North America Home Dialysis Systems Market Value (US$ Mn) Analysis by Type, 2017-2032
Figure 34: North America Home Dialysis Systems Market Analysis by Type, 2017-2032
Figure 35: North America Home Dialysis Systems Market Value Share (%) and BPS Analysis by Type, 2022-2032
Figure 36: North America Home Dialysis Systems Market Y-o-Y Growth (%) Projections by Type, 2022-2032
Figure 37: North America Home Dialysis Systems Market Value (US$ Mn) Analysis by Product, 2017-2032
Figure 38: North America Home Dialysis Systems Market Analysis by Product, 2017-2032
Figure 39: North America Home Dialysis Systems Market Value Share (%) and BPS Analysis by Product, 2022-2032
Figure 40: North America Home Dialysis Systems Market Y-o-Y Growth (%) Projections by Product, 2022-2032
Figure 41: North America Home Dialysis Systems Market Value (US$ Mn) Analysis by Treatment, 2017-2032
Figure 42: North America Home Dialysis Systems Market Analysis by Treatment, 2017-2032
Figure 43: North America Home Dialysis Systems Market Value Share (%) and BPS Analysis by Treatment, 2022-2032
Figure 44: North America Home Dialysis Systems Market Y-o-Y Growth (%) Projections by Treatment, 2022-2032
Figure 45: North America Home Dialysis Systems Market Attractiveness by Type, 2022-2032
Figure 46: North America Home Dialysis Systems Market Attractiveness by Product, 2022-2032
Figure 47: North America Home Dialysis Systems Market Attractiveness by Treatment, 2022-2032
Figure 48: North America Home Dialysis Systems Market Attractiveness by Country, 2022-2032
Figure 49: Latin America Home Dialysis Systems Market Value (US$ Mn) by Type, 2022-2032
Figure 50: Latin America Home Dialysis Systems Market Value (US$ Mn) by Product, 2022-2032
Figure 51: Latin America Home Dialysis Systems Market Value (US$ Mn) by Treatment, 2022-2032
Figure 52: Latin America Home Dialysis Systems Market Value (US$ Mn) by Country, 2022-2032
Figure 53: Latin America Home Dialysis Systems Market Value (US$ Mn) Analysis by Country, 2017-2032
Figure 54: Latin America Home Dialysis Systems Market Analysis by Country, 2017-2032
Figure 55: Latin America Home Dialysis Systems Market Value Share (%) and BPS Analysis by Country, 2022-2032
Figure 56: Latin America Home Dialysis Systems Market Y-o-Y Growth (%) Projections by Country, 2022-2032
Figure 57: Latin America Home Dialysis Systems Market Value (US$ Mn) Analysis by Type, 2017-2032
Figure 58: Latin America Home Dialysis Systems Market Analysis by Type, 2017-2032
Figure 59: Latin America Home Dialysis Systems Market Value Share (%) and BPS Analysis by Type, 2022-2032
Figure 60: Latin America Home Dialysis Systems Market Y-o-Y Growth (%) Projections by Type, 2022-2032
Figure 61: Latin America Home Dialysis Systems Market Value (US$ Mn) Analysis by Product, 2017-2032
Figure 62: Latin America Home Dialysis Systems Market Analysis by Product, 2017-2032
Figure 63: Latin America Home Dialysis Systems Market Value Share (%) and BPS Analysis by Product, 2022-2032
Figure 64: Latin America Home Dialysis Systems Market Y-o-Y Growth (%) Projections by Product, 2022-2032
Figure 65: Latin America Home Dialysis Systems Market Value (US$ Mn) Analysis by Treatment, 2017-2032
Figure 66: Latin America Home Dialysis Systems Market Analysis by Treatment, 2017-2032
Figure 67: Latin America Home Dialysis Systems Market Value Share (%) and BPS Analysis by Treatment, 2022-2032
Figure 68: Latin America Home Dialysis Systems Market Y-o-Y Growth (%) Projections by Treatment, 2022-2032
Figure 69: Latin America Home Dialysis Systems Market Attractiveness by Type, 2022-2032
Figure 70: Latin America Home Dialysis Systems Market Attractiveness by Product, 2022-2032
Figure 71: Latin America Home Dialysis Systems Market Attractiveness by Treatment, 2022-2032
Figure 72: Latin America Home Dialysis Systems Market Attractiveness by Country, 2022-2032
Figure 73: Europe Home Dialysis Systems Market Value (US$ Mn) by Type, 2022-2032
Figure 74: Europe Home Dialysis Systems Market Value (US$ Mn) by Product, 2022-2032
Figure 75: Europe Home Dialysis Systems Market Value (US$ Mn) by Treatment, 2022-2032
Figure 76: Europe Home Dialysis Systems Market Value (US$ Mn) by Country, 2022-2032
Figure 77: Europe Home Dialysis Systems Market Value (US$ Mn) Analysis by Country, 2017-2032
Figure 78: Europe Home Dialysis Systems Market Analysis by Country, 2017-2032
Figure 79: Europe Home Dialysis Systems Market Value Share (%) and BPS Analysis by Country, 2022-2032
Figure 80: Europe Home Dialysis Systems Market Y-o-Y Growth (%) Projections by Country, 2022-2032
Figure 81: Europe Home Dialysis Systems Market Value (US$ Mn) Analysis by Type, 2017-2032
Figure 82: Europe Home Dialysis Systems Market Analysis by Type, 2017-2032
Figure 83: Europe Home Dialysis Systems Market Value Share (%) and BPS Analysis by Type, 2022-2032
Figure 84: Europe Home Dialysis Systems Market Y-o-Y Growth (%) Projections by Type, 2022-2032
Figure 85: Europe Home Dialysis Systems Market Value (US$ Mn) Analysis by Product, 2017-2032
Figure 86: Europe Home Dialysis Systems Market Analysis by Product, 2017-2032
Figure 87: Europe Home Dialysis Systems Market Value Share (%) and BPS Analysis by Product, 2022-2032
Figure 88: Europe Home Dialysis Systems Market Y-o-Y Growth (%) Projections by Product, 2022-2032
Figure 89: Europe Home Dialysis Systems Market Value (US$ Mn) Analysis by Treatment, 2017-2032
Figure 90: Europe Home Dialysis Systems Market Analysis by Treatment, 2017-2032
Figure 91: Europe Home Dialysis Systems Market Value Share (%) and BPS Analysis by Treatment, 2022-2032
Figure 92: Europe Home Dialysis Systems Market Y-o-Y Growth (%) Projections by Treatment, 2022-2032
Figure 93: Europe Home Dialysis Systems Market Attractiveness by Type, 2022-2032
Figure 94: Europe Home Dialysis Systems Market Attractiveness by Product, 2022-2032
Figure 95: Europe Home Dialysis Systems Market Attractiveness by Treatment, 2022-2032
Figure 96: Europe Home Dialysis Systems Market Attractiveness by Country, 2022-2032
Figure 97: Asia Pacific Home Dialysis Systems Market Value (US$ Mn) by Type, 2022-2032
Figure 98: Asia Pacific Home Dialysis Systems Market Value (US$ Mn) by Product, 2022-2032
Figure 99: Asia Pacific Home Dialysis Systems Market Value (US$ Mn) by Treatment, 2022-2032
Figure 100: Asia Pacific Home Dialysis Systems Market Value (US$ Mn) by Country, 2022-2032
Figure 101: Asia Pacific Home Dialysis Systems Market Value (US$ Mn) Analysis by Country, 2017-2032
Figure 102: Asia Pacific Home Dialysis Systems Market Analysis by Country, 2017-2032
Figure 103: Asia Pacific Home Dialysis Systems Market Value Share (%) and BPS Analysis by Country, 2022-2032
Figure 104: Asia Pacific Home Dialysis Systems Market Y-o-Y Growth (%) Projections by Country, 2022-2032
Figure 105: Asia Pacific Home Dialysis Systems Market Value (US$ Mn) Analysis by Type, 2017-2032
Figure 106: Asia Pacific Home Dialysis Systems Market Analysis by Type, 2017-2032
Figure 107: Asia Pacific Home Dialysis Systems Market Value Share (%) and BPS Analysis by Type, 2022-2032
Figure 108: Asia Pacific Home Dialysis Systems Market Y-o-Y Growth (%) Projections by Type, 2022-2032
Figure 109: Asia Pacific Home Dialysis Systems Market Value (US$ Mn) Analysis by Product, 2017-2032
Figure 110: Asia Pacific Home Dialysis Systems Market Analysis by Product, 2017-2032
Figure 111: Asia Pacific Home Dialysis Systems Market Value Share (%) and BPS Analysis by Product, 2022-2032
Figure 112: Asia Pacific Home Dialysis Systems Market Y-o-Y Growth (%) Projections by Product, 2022-2032
Figure 113: Asia Pacific Home Dialysis Systems Market Value (US$ Mn) Analysis by Treatment, 2017-2032
Figure 114: Asia Pacific Home Dialysis Systems Market Analysis by Treatment, 2017-2032
Figure 115: Asia Pacific Home Dialysis Systems Market Value Share (%) and BPS Analysis by Treatment, 2022-2032
Figure 116: Asia Pacific Home Dialysis Systems Market Y-o-Y Growth (%) Projections by Treatment, 2022-2032
Figure 117: Asia Pacific Home Dialysis Systems Market Attractiveness by Type, 2022-2032
Figure 118: Asia Pacific Home Dialysis Systems Market Attractiveness by Product, 2022-2032
Figure 119: Asia Pacific Home Dialysis Systems Market Attractiveness by Treatment, 2022-2032
Figure 120: Asia Pacific Home Dialysis Systems Market Attractiveness by Country, 2022-2032
Figure 121: MEA Home Dialysis Systems Market Value (US$ Mn) by Type, 2022-2032
Figure 122: MEA Home Dialysis Systems Market Value (US$ Mn) by Product, 2022-2032
Figure 123: MEA Home Dialysis Systems Market Value (US$ Mn) by Treatment, 2022-2032
Figure 124: MEA Home Dialysis Systems Market Value (US$ Mn) by Country, 2022-2032
Figure 125: MEA Home Dialysis Systems Market Value (US$ Mn) Analysis by Country, 2017-2032
Figure 126: MEA Home Dialysis Systems Market Analysis by Country, 2017-2032
Figure 127: MEA Home Dialysis Systems Market Value Share (%) and BPS Analysis by Country, 2022-2032
Figure 128: MEA Home Dialysis Systems Market Y-o-Y Growth (%) Projections by Country, 2022-2032
Figure 129: MEA Home Dialysis Systems Market Value (US$ Mn) Analysis by Type, 2017-2032
Figure 130: MEA Home Dialysis Systems Market Analysis by Type, 2017-2032
Figure 131: MEA Home Dialysis Systems Market Value Share (%) and BPS Analysis by Type, 2022-2032
Figure 132: MEA Home Dialysis Systems Market Y-o-Y Growth (%) Projections by Type, 2022-2032
Figure 133: MEA Home Dialysis Systems Market Value (US$ Mn) Analysis by Product, 2017-2032
Figure 134: MEA Home Dialysis Systems Market Analysis by Product, 2017-2032
Figure 135: MEA Home Dialysis Systems Market Value Share (%) and BPS Analysis by Product, 2022-2032
Figure 136: MEA Home Dialysis Systems Market Y-o-Y Growth (%) Projections by Product, 2022-2032
Figure 137: MEA Home Dialysis Systems Market Value (US$ Mn) Analysis by Treatment, 2017-2032
Figure 138: MEA Home Dialysis Systems Market Analysis by Treatment, 2017-2032
Figure 139: MEA Home Dialysis Systems Market Value Share (%) and BPS Analysis by Treatment, 2022-2032
Figure 140: MEA Home Dialysis Systems Market Y-o-Y Growth (%) Projections by Treatment, 2022-2032
Figure 141: MEA Home Dialysis Systems Market Attractiveness by Type, 2022-2032
Figure 142: MEA Home Dialysis Systems Market Attractiveness by Product, 2022-2032
Figure 143: MEA Home Dialysis Systems Market Attractiveness by Treatment, 2022-2032
Figure 144: MEA Home Dialysis Systems Market Attractiveness by Country, 2022-2032
Need specific information?
Request CustomizationExplore Healthcare Insights
View Reports