Reports

- Global Locations -

Headquarters

Future Market Insights, Inc.

Christiana Corporate, 200
Continental Drive, Suite 401,
Newark, Delaware - 19713,
United States

T: +1-845-579-5705

Americas

Future Market Insights, Inc.

616 Corporate Way, Suite 2-9018,
Valley Cottage, NY 10989, United States

T: +1-347-918-3531

MEA

Future Market Insights

1602-6 Jumeirah Bay X2 Tower, Plot No: JLT-PH2-X2A,
Jumeirah Lakes Towers, Dubai,
United Arab Emirates

Europe

Future Market Insights

3rd Floor, 207 Regent Street,
W1B 3HH London
United Kingdom

T: + 44 (0) 20 8123 9659
D: +44 (0) 20 3287 4268

Asia Pacific

Future Market Insights

IndiaLand Global Tech Park, Unit UG-1, Behind Grand HighStreet, Phase 1, Hinjawadi, MH, Pune – 411057, India

Home Sleep Screening Devices Market Outlook – 2022-2032

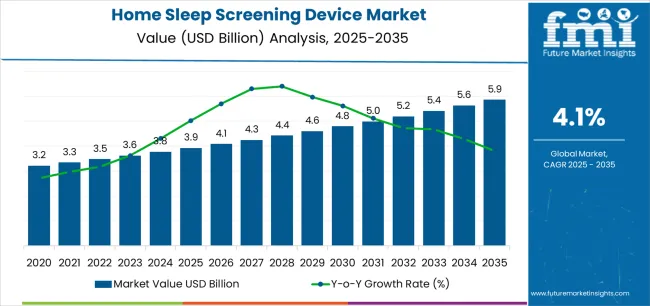
[290 Pages Report] Sales in the global Home Sleep Screening Devices Market are slated to top US$ 3.1 Billion in 2022. Expanding at a healthy 8.5% CAGR, the market is set to exceed US$ 11.4 Billion by 2032.

Attribute Details
Home Sleep Screening Devices Market Estimated Size 2022 US$ 3.1 Billion
Home Sleep Screening Devices Market Value-based CAGR (2022 to 2032) 8.5%
Home Sleep Screening Devices Market Size in Projected 2032 US$ 11.4 Billion

The increasing prevalence of sleep apnea across the globe is projected to drive the sales of various screening devices, such as continuous positive airway pressure (CPAP) machines and sleep monitor rings in the near future. Patients with sleep disorders often suffer from morning headaches, loud snoring, hypersomnia, and insomnia, which requires immediate medical attention.

The rising number of new entrants in the market owing to the surging prevalence of various sleep disorders and high demand for advanced sleep breathing machines are anticipated to propel the market. Coupled with this, the soaring need for wearable sleep monitoring devices for easy usage in home settings is likely to fuel the growth.

Don't pay for what you don't need

Customize your report by selecting specific countries or regions and save 30%!

How The Market Progressed Till June 2022?

Particulars Details
H1, 2021 8.42%
H1, 2022 Projected 8.46%
H1, 2022 Outlook 8.26%
BPS Change - H1, 2022 (O) - H1, 2022 (P) (-) 20 ↓
BPS Change - H1, 2022 (O) - H1, 2021 (-) 16 ↓

The comparative analysis in the growth rate of the home sleep screening devices market has been done by Future Market Insights wherein it was observed that a decrease in Basis Share Point (BPS) in H1-2022 when compared to H1-2021 is predicted by nearly 16 BPS. Furthermore, the H1-2022 outlook and H1- 2022 projected growth rate showed declining variation in the BPS value by 20 BPS.

The declining rate in the BPS value for the home sleep screening devices market is mainly due to the potential for error of devices requiring technical support, as manual troubleshooting is not provided, thus reducing the adoption rate of these devices.

However, the market of the home sleep screening devices market is expected to increase and achieve lucrative growth prospects, especially with the several socioeconomic advantages to the utilization of home sleep screening devices, mainly related to their lower direct cost as compared to lab based diagnosis, increased accessibility, and convenience of testing for patients suspected to have obstructive sleep apnea, resulting in an overall improvement of the diagnostic process.

2013-2021 Home Sleep Screening Devices Market Outlook in Comparison to 2022-2032 Growth Forecast

The home sleep screening devices market is expected to register 8.5% CAGR between 2022 and 2032, up from 7.5% CAGR recorded during 2013-2021, predicts Future Market Insights.

The rising prevalence of jet lag, narcolepsy, sleepwalking, obstructive sleep apnea, and insomnia among people working in shifts is anticipated to spur the demand for sleep monitoring devices in the forthcoming years. The increasing adoption of hectic lifestyles, as well as the consistent use of smartphones and laptops would also contribute to the growth in this market.

As per a report published in June 2020 in the National Center for Biotechnology Information, keeping the mobile phone near the pillow and using them for at least 30 minutes before sleeping even after the lights have been turned off can lead to poor sleep quality. With the ongoing digitization and easy access to the internet, the number of smartphone users is likely to surge in the future, thereby increasing the prevalence of various sleep disorders globally.

Home Sleep Screening Devices Market

Furthermore, the surging number of international passengers owing to the availability of cost-effective flight tickets and government investments in the tourism sector is estimated to accelerate the cases of jet lags. Additionally, the increasing smoking habit and higher consumption of alcohol can trigger the occurrence of sleep disorders and boost the sales of sleep breathing machines.

How are Nightmares and Diabetes Connected with the Usage of Sleep Monitoring Devices?

The rising cases of chronic illnesses, such as diabetes and hypertension are likely to increase the prevalence of various sleep disorders. According to the National Sleep Foundation, about one in two people with type 2 diabetes suffer from sleep problems because of unstable blood sugar levels. Also, the accompanying diabetes-related symptoms, such as hypoglycemia and hyperglycemia during the night can cause next-day fatigue and insomnia.

Often, feeling of stress or depression about the condition may keep the patients awake at night. The number of diabetic patients is projected to surge in the assessment period, stoked by obesity, genetic conditions, and stressful lifestyles, which in turn, is set to propel the demand for sleep breathing machines.

Moreover, the usage of sleep monitoring devices is set to surge among children owing to the increasing cases of night terrors and nightmares. Researchers at the Université de Montréal, for instance, discovered that 10% of 12- to 14-year-olds, 23% of 9- to 11-year-olds, and 28% of 5- to 8-year-olds have nightmares once every 6 months. The peak nightmare prevalence of 41% was observed between 6 and 10 years. These numbers are expected to rise in the evaluation period, which is projected to spur the growth in this market.

Sabyasachi Ghosh
Sabyasachi Ghosh

Principal Consultant

Talk to Analyst

Find your sweet spots for generating winning opportunities in this market.

Country-wise Insights

What is the U.S. Home Sleep Screening Devices Market Outlook?

“Manufacturers are Developing Sleep Connection Wristbands for Patients Suffering from Insomnia”

The presence of various renowned sleep breathing machine manufacturers in the U.S. is anticipated to propel the home sleep screening devices market in North America in the forthcoming years. Most of these manufacturers are striving to keep up with the high demand for these devices from the geriatric as well as working population suffering from insomnia.

In January 2022, for instance, Garmin Ltd., which is a multinational technology company headquartered in Kansas, introduced its latest Garmin Fenix 7 series GPS smartwatches in the U.S. These feature silicone straps, color displays, and touchscreens. The newly developed range is specially designed for users to track their sleep, heart rate, stress, stamina, and respiration. The launch of such state-of-the-art sleep connection wristbands and watches is estimated to accelerate the U.S. market.

Will the India Home Sleep Screening Devices Market Exhibit Steady Growth?

“Increasing Number of Shift Workers to Propel the Usage of CPAP Machines”

The ongoing technological advancements in India in the field of sleep connection wristbands and CPAP machines are anticipated to drive the South Asia home sleep screening devices market. As per the National Medical Journal of India, around 33% of adults in this country suffer from insomnia. This trend is expected to continue throughout the forecast period, thereby augmenting the sales of CPAP machines and similar other sleep tracking devices in the country.

Furthermore, government initiatives undertaken to educate general public regarding the significance of sleep in health and disease by developing a comprehensive plan is likely to drive the market. At the same time, the surging number of shift workers in aviation, law enforcement, surface transport, armed forces, and healthcare industries is projected to spur the market in India.

Why is the U.K. Home Sleep Screening Devices Market Accelerating?

“Start-ups Develop Sleep Monitor Rings and Other At-home Test Kits in the U.K.”

The surging development of novel sleep monitor rings and anti-snoring devices by start-up as well as established companies in the U.K. is set to drive the home sleep screening devices market in Europe. Additionally, the rising patient pool suffering from numerous sleep disorders is likely to spur the demand for sleep monitor rings and other devices in the U.K.

For instance, in April 2021, Sunrise, a healthtech company introduced the world’s first from-home sleep test in the U.K. The product is worth £89 and does not require patients to spend their night at hospitals for diagnosis. It is completely wireless and includes an AI-powered sensor that sits on the user’s chin throughout the night. The rapid development of such types of tracking devices in the U.K. by various firms is anticipated to bolster the market. 

Category-wise Insights

Which is the Top-Selling Home Sleep Screening Device Type?

“Customers are Preferring Wearable Sleep Monitoring Devices owing to their Portability”

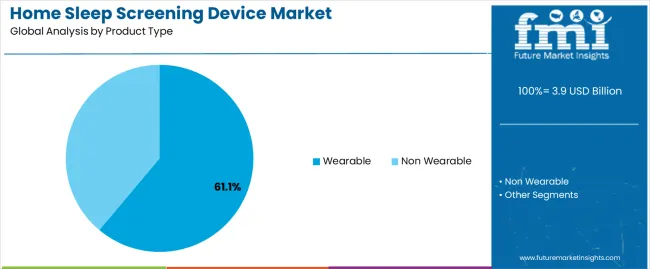
Based on product type, the wearable segment is set to remain at the forefront in the global home sleep screening devices market in the near future. The high portability of wearable sleep monitoring devices, compared to the other types of products is anticipated to bolster their demand across the globe.

Huawei Technologies Co., Ltd., for instance, introduced the Watch D smartwatch in December 2021. It provide various novel features, such as blood pressure, ECG, sleep tracking, and heart rate monitoring. Users need to download the company’s special app to gain access to the tracking results. This new product will help users to find out about their health related conditions. Hence, the easy availability of wearable devices is likely to spur the segment’s growth.

Which is the Leading Application of Home Sleep Screening Devices?

“Surging Prevalence of Sleep Apnea to Bolster the Demand for Sleep Breathing Machines”

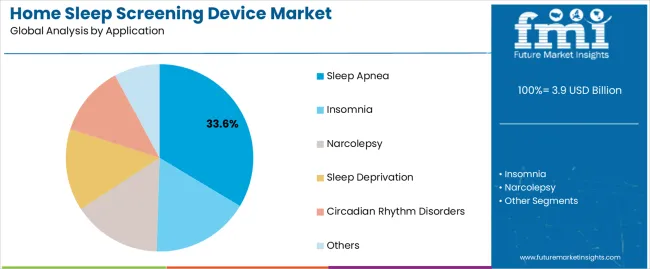
By application, the sleep apnea segment is projected to account for approximately 32.7% of the home sleep screening devices market share in 2022, finds FMI. Structural abnormalities, excessive weight, and diabetes can often lead to the occurrence of sleep apnea in people.

Many research institutes and pharmaceutical companies are conducting research activities to come up with new treatment options for this condition. For instance, in November 2021, Center Hospitalier Universitaire de Reims started recruiting participants to test whether awake obstructive sleep apnea syndrome patients would showcase a cortical activity during the functional Magnetic Resonance Imaging (MRI) procedure. Spurred by such research and development activities, the demand for novel sleep breathing machines is projected to surge.

Which Distribution Channel is Preferred for Home Sleep Screening Devices Sales?

“Customers are Purchasing Anti-snoring Devices from Online Stores”

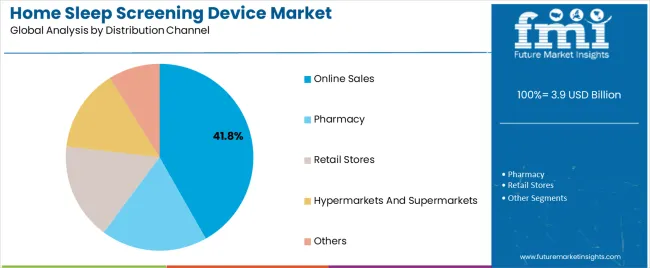
In terms of distribution channel, the online sales segment is estimated to generate the largest home sleep screening devices market share in the near future. The availability of a wide range of products, such as anti-snoring devices in e-commerce stores is likely to fuel the segment’s growth.

On top of that, online sales channels often provide huge discounts, as compared to brick-and-mortar stores. These also provide doorstep delivery to customers and because of this facility, many people are shifting rapidly towards these stores amid the COVID-19 pandemic.  

Get the data you need at a Fraction of the cost

Personalize your report by choosing insights you need
and save 40%!

Competition Landscape

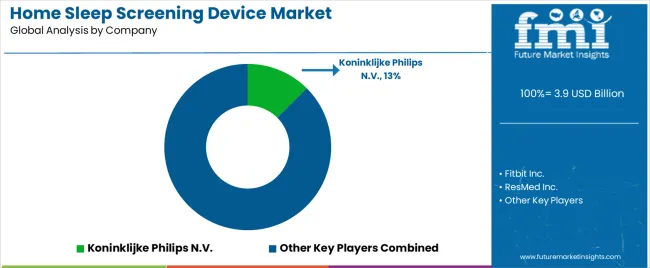
Key players operating in the global home sleep screening devices market are eyeing new growth opportunities by launching innovative anti-snoring devices and sleep connection wristbands. The increasing number of product launches is helping them to generate more shares and gain a large consumer base. Meanwhile, some of the other key players are focusing on partnerships and collaborations to provide access to cost-effective treatment options and telehealth services to patients worldwide.

For instance,

  • In August 2021, Vivos Therapeutics, Inc., a medical technology company based in the U.S., teamed up with Empower Sleep, digital healthcare platform providing online treatment for sleep disorders, to deliver medical and critical diagnostic consultation services to people suffering from obstructive sleep apnea across North America.
  • In February 2021, the U.S. Food and Drug Administration (FDA) approved the marketing of eXciteOSA, a novel prescription only device for reducing mild obstructive sleep apnea and snoring. It is a cutting-edge removable tongue muscle stimulation device that provides neuromuscular stimulation to the tongue in patients who are 18 years and older. However, the device is not recommended for patients with implanted pacing leads or pacemakers.

Scope of Report

Attribute Details
Forecast Period 2013 to 2021
Historical Data Available for 2022 to 2028
Market Analysis Units for Volume and US$ Billion for Value
Key Regions Covered North America, Latin America, Europe, East Asia, South Asia, India, and the Middle East & Africa.
Key Countries Covered United States, Canada, Brazil, Mexico, Germany, UK, France, Italy, Spain, Nordic, Russia, Poland, China, India, Thailand, Indonesia, Australia and New Zealand, Japan, GCC countries, North Africa, South Africa, others.
Key Market Segments Covered Product Type, Application, Distribution Channel, and Region
Key Companies Profiled
  • Koninklijke Philips N.V.
  • Fitbit, Inc.
  • Huami Corporation
  • Garmin Ltd.
  • Fossil Group, Inc.
  • Huawei Technologies Co., Ltd.
  • ResMed Inc.
  • Responsive Surface Technology, LLC
  • Simmons Bedding Company LLC
  • Dreams, Cleveland Medical Devices Inc.
  • NovaSom, Itamar Medical Ltd
  • Ez Sleep
  • ApneaMed
  • SleepWorks, LLC
  • VirtuOx, Inc.
Pricing Available upon Request

Home Sleep Screening Devices Market by Category

By Product Type:

  • Sleep Monitors
  • Wearable
  • Non-wearable
  • Smart Sleep Equipment

By Application:

  • Insomnia
  • Sleep Apnea
  • Narcolepsy
  • Sleep Deprivation
  • Circadian Rhythm Disorders
  • Others

By Distribution Channel:

  • Pharmacy
  • Retail Stores
  • Online Sales
  • Hypermarkets and Supermarkets
  • Others

By Region:

  • North America
  • Latin America
  • Europe
  • India
  • East Asia
  • South Asia
  • Middle East & Africa (MEA)

Frequently Asked Questions

What is the sales forecast for sleep screening devices in the global market until 2032?

The global sleep screening devices market is set to exceed US$ 11.4 Billion by 2032.

Which region is expected to lead the sleep screening devices market?

North America is expected to lead the sleep screening devices market.

Which are some of the renowned manufacturers of sleep screening devices?

Dream Sleep, NovaSom, VirtuOx, Koninklijke Philips, SleepWorks, Itamar Medical (ZOLL Medical), ApneaMed, Garmin, ResMed, and Cleveland Medical Devices are some of the renowned manufacturers of sleep screening devices.

Table of Content

1. Executive Summary

      1.1. Global Market Outlook

      1.2. Demand Side Trends

      1.3. Supply Side Trends

      1.4. Technology Roadmap

      1.5. Analysis and Recommendations

2. Market Overview

      2.1. Market Coverage / Taxonomy

      2.2. Market Definition / Scope / Limitations

3. Key Market Trends

      3.1. Key Trends Impacting the Market

      3.2. Product Innovation & Development Trends

4. Key Success Factors

      4.1. Product Adoption / Usage Analysis

      4.2. Product USPs / Features

      4.3. Key Promotional Strategies, By Manufacturers

      4.4. Disease Epidemiology, By Key Regions

      4.5. Regulatory Scenario

5. Global Market - Pricing Analysis

      5.1. Regional Pricing Analysis By Product Type

      5.2. Pricing Break-up

            5.2.1. Manufacturer Level Pricing

            5.2.2. Distributor Level Pricing

      5.3. Global Average Pricing Analysis Benchmark

6. Global Market Demand (Value US$ Mn) Analysis 2013-2021 and Forecast, 2022-2028

      6.1. Historical Market Value (US$ Mn) Analysis, 2013-2021

      6.2. Current and Future Market Value (US$ Mn) Projections, 2022-2028

            6.2.1. Y-o-Y Growth Trend Analysis

            6.2.2. Absolute $ Opportunity Analysis

7. Market Background

      7.1. Macro-Economic Factors

            7.1.1. Global GDP Growth Outlook

            7.1.2. Global Healthcare Expenditure Outlook

      7.2. Forecast Factors - Relevance & Impact

            7.2.1. High prevalence of obstructive sleep apnea

            7.2.2. Increasing demand for home-based sleep screening

            7.2.3. Technological advancements in home sleep screening devices

            7.2.4. Growing product penetration

            7.2.5. Increase in healthcare expenditure

      7.3. Value Chain

      7.4. Market Dynamics

            7.4.1. Drivers

            7.4.2. Restraints

            7.4.3. Opportunity Analysis

8. Global Market Analysis 2013-2021 and Forecast 2022-2028, by Product Type

      8.1. Introduction / Key Findings

      8.2. Historical Market Size (US$ Mn) & Volume Analysis By Product Type, 2013 - 2021

      8.3. Current and Future Market Size (US$ Mn) & Volume Analysis and Forecast By Product Type, 2022 - 2022

            8.3.1. Sleep Monitors

                  8.3.1.1. Type II

                  8.3.1.2. Type III

                  8.3.1.3. Type IV

                  8.3.1.4. Others

            8.3.2. Wearables

                  8.3.2.1. Ring Devices

                  8.3.2.2. Wrist Devices & Hand Bands Devices

                  8.3.2.3. Headband Devices

                  8.3.2.4. Sleep Mask Tracker Devices

            8.3.3. Non-Wearables

                  8.3.3.1. Under Mattress Non-Wearable Devices

                  8.3.3.2. Bedside Non-Wearable Devices

                  8.3.3.3. Under Sheet Non-Wearable Devices

            8.3.4. Smart Sleep Equipment

                  8.3.4.1. Smart Beds

                  8.3.4.2. Smart Mattresses and Pillows

      8.4. Market Attractiveness Analysis By Product Type

9. Global Market Analysis 2013-2021 and Forecast 2022-2028, by Application

      9.1. Introduction / Key Findings

      9.2. Historical Market Size (US$ Mn) Analysis By Application, 2013 - 2021

      9.3. Current and Future Market Size (US$ Mn) Analysis and Forecast By Application, 2022 - 2022

            9.3.1. Insomnia

            9.3.2. Sleep Apnea

            9.3.3. Narcolepsy

            9.3.4. Sleep Deprivation

            9.3.5. Circadian Rhythm Disorders

            9.3.6. Others

      9.4. Market Attractiveness Analysis By Application

10. Global Market Analysis 2013-2021 and Forecast 2022-2028, by Distribution Channel

      10.1. Introduction / Key Findings

      10.2. Historical Market Size (US$ Mn) Analysis By Distribution Channel, 2013 - 2021

      10.3. Current and Future Market Size (US$ Mn) Analysis and Forecast By Distribution Channel, 2022 - 2022

            10.3.1. Pharmacy

            10.3.2. Retail Stores

            10.3.3. Online Sales

            10.3.4. Hypermarkets and Supermarkets

            10.3.5. Others

      10.4. Market Attractiveness Analysis By Distribution Channel

11. Global Market Analysis 2013-2021 and Forecast 2022-2028, by Region

      11.1. Introduction

      11.2. Historical Market Size (US$ Mn) Analysis By Region, 2013 - 2021

      11.3. Current Market Size (US$ Mn) Analysis and Forecast By Region, 2022 - 2022

            11.3.1. North America

            11.3.2. Latin America

            11.3.3. Europe

            11.3.4. South Asia

            11.3.5. East Asia

            11.3.6. Oceania

            11.3.7. Middle East & Africa (MEA)

            11.3.8. China

            11.3.9. India

            11.3.10. South Korea

      11.4. Market Attractiveness Analysis By Region

12. North America Market Analysis 2013-2021 and Forecast 2022-2028

      12.1. Introduction

      12.2. Pricing Analysis

      12.3. Historical Market Size (US$ Mn) & Volume Trend Analysis By Market Taxonomy, 2013 - 2021

      12.4. Market Size (US$ Mn) & Volume Forecast By Market Taxonomy, 2022 - 2028

            12.4.1. By Country

                  12.4.1.1. U.S.

                  12.4.1.2. Canada

            12.4.2. By Product Type

            12.4.3. By Application

            12.4.4. By Distribution Channel

      12.5. Market Attractiveness Analysis

            12.5.1. By Country

            12.5.2. By Product Type

            12.5.3. By Application

            12.5.4. By Distribution Channel

      12.6. Market Trends

      12.7. Key Market Participants - Intensity Mapping

      12.8. Drivers and Restraints - Impact Analysis

13. Latin America Market Analysis 2013-2021 and Forecast 2022-2028

      13.1. Introduction

      13.2. Pricing Analysis

      13.3. Historical Market Size (US$ Mn) & Volume Trend Analysis By Market Taxonomy, 2013 - 2021

      13.4. Market Size (US$ Mn) & Volume Forecast By Market Taxonomy, 2022 - 2028

            13.4.1. By Country

                  13.4.1.1. Brazil

                  13.4.1.2. Mexico

                  13.4.1.3. Rest of Latin America

            13.4.2. By Product Type

            13.4.3. By Application

            13.4.4. By Distribution Channel

      13.5. Market Attractiveness Analysis

            13.5.1. By Country

            13.5.2. By Product Type

            13.5.3. By Application

            13.5.4. By Distribution Channel

      13.6. Market Trends

      13.7. Key Market Participants - Intensity Mapping

      13.8. Drivers and Restraints - Impact Analysis

14. Europe Market Analysis 2013-2021 and Forecast 2022-2028

      14.1. Introduction

      14.2. Pricing Analysis

      14.3. Historical Market Size (US$ Mn) & Volume Trend Analysis By Market Taxonomy, 2013 - 2021

      14.4. Market Size (US$ Mn) & Volume Forecast By Market Taxonomy, 2022 - 2028

            14.4.1. By Country

                  14.4.1.1. Germany

                  14.4.1.2. Italy

                  14.4.1.3. France

                  14.4.1.4. U.K.

                  14.4.1.5. Spain

                  14.4.1.6. Russia

                  14.4.1.7. BENELUX

                  14.4.1.8. Rest of Europe

            14.4.2. By Product Type

            14.4.3. By Application

            14.4.4. By Distribution Channel

      14.5. Market Attractiveness Analysis

            14.5.1. By Country

            14.5.2. By Product Type

            14.5.3. By Application

            14.5.4. By Distribution Channel

      14.6.Market Trends

      14.7. Key Market Participants - Intensity Mapping

      14.8. Drivers and Restraints - Impact Analysis

15. South Asia Market Analysis 2013-2021 and Forecast 2022-2028

      15.1. Introduction

      15.2. Pricing Analysis

      15.3. Historical Market Size (US$ Mn) & Volume Trend Analysis By Market Taxonomy, 2013 - 2021

      15.4. Market Size (US$ Mn) & Volume Forecast By Market Taxonomy, 2022 - 2028

            15.4.1. By Country

                  15.4.1.1. India

                  15.4.1.2. Thailand

                  15.4.1.3. Indonesia

                  15.4.1.4. Malaysia

                  15.4.1.5. Rest of South Asia

            15.4.2. By Product Type

            15.4.3. By Application

            15.4.4. By Distribution Channel

      15.5. Market Attractiveness Analysis

            15.5.1. By Country

            15.5.2. By Product Type

            15.5.3. By Application

            15.5.4. By Distribution Channel

      15.6. Market Trends

      15.7. Key Market Participants - Intensity Mapping

      15.8. Drivers and Restraints - Impact Analysis

16. East Asia Market Analysis 2013-2021 and Forecast 2022-2028

      16.1. Introduction

      16.2. Pricing Analysis

      16.3. Historical Market Size (US$ Mn) & Volume Trend Analysis By Market Taxonomy, 2013 - 2021

      16.4. Market Size (US$ Mn) & Volume Forecast By Market Taxonomy, 2022 - 2028

            16.4.1. By Country

                  16.4.1.1. China

                  16.4.1.2. Japan

                  16.4.1.3. South Korea

            16.4.2. By Product Type

            16.4.3. By Application

            16.4.4. By Distribution Channel

      16.5. Market Attractiveness Analysis

            16.5.1. By Country

            16.5.2. By Product Type

            16.5.3. By Application

            16.5.4. By Distribution Channel

      16.6. Market Trends

      16.7. Key Market Participants - Intensity Mapping

      16.8. Drivers and Restraints - Impact Analysis

17. Oceania Market Analysis 2013-2021 and Forecast 2022-2028

      17.1. Introduction

      17.2. Pricing Analysis

      17.3. Historical Market Size (US$ Mn) & Volume Trend Analysis By Market Taxonomy, 2013 - 2021

      17.4. Market Size (US$ Mn) & Volume Forecast By Market Taxonomy, 2022 - 2028

            17.4.1. By Country

                  17.4.1.1. Australia

                  17.4.1.2. New Zealand

            17.4.2. By Product Type

            17.4.3. By Application

            17.4.4. By Distribution Channel

      17.5. Market Attractiveness Analysis

            17.5.1. By Country

            17.5.2. By Product Type

            17.5.3. By Application

            17.5.4. By Distribution Channel

      17.6. Market Trends

      17.7. Key Market Participants - Intensity Mapping

      17.8. Drivers and Restraints - Impact Analysis

18. Middle East and Africa Market Analysis 2013-2021 and Forecast 2022-2028

      18.1. Introduction

      18.2. Pricing Analysis

      18.3. Historical Market Size (US$ Mn) & Volume Trend Analysis By Market Taxonomy, 2013 - 2021

      18.4. Market Size (US$ Mn) & Volume Forecast By Market Taxonomy, 2022 - 2028

            18.4.1. By Country

                  18.4.1.1. GCC Countries

                  18.4.1.2. South Africa

                  18.4.1.3. Turkey

                  18.4.1.4. Northern Africa

                  18.4.1.5. Rest of Middle East and Africa

            18.4.2. By Product Type

            18.4.3. By Application

            18.4.4. By Distribution Channel

      18.5. Market Attractiveness Analysis

            18.5.1. By Country

            18.5.2. By Product Type

            18.5.3. By Application

            18.5.4. By Distribution Channel

      18.6. Market Trends

      18.7. Key Market Participants - Intensity Mapping

      18.8. Drivers and Restraints - Impact Analysis

19. Emerging Countries Market Analysis 2013-2021 and Forecast 2022-2028

      19.1. Introduction

            19.1.1. Market Value Proportion Analysis, By Key Countries

            19.1.2. Global Vs. Country Growth Comparison

      19.2. China Market Analysis

            19.2.1. Introduction

            19.2.2. Pricing Analysis

            19.2.3. PEST Analysis

            19.2.4. Market Value Proportion Analysis by Market Taxonomy

            19.2.5. Market Value (US$ Mn) & Volume Analysis and Forecast by Market Taxonomy

                  19.2.5.1. By Product Type

                  19.2.5.2. By Application

                  19.2.5.3. By Distribution Channel

            19.2.6. China Market - Competition Landscape

      19.3. India Market Analysis

            19.3.1. Introduction

            19.3.2. Pricing Analysis

            19.3.3. PEST Analysis

            19.3.4. Market Value Proportion & Volume Analysis by Market Taxonomy

            19.3.5. Market Value (US$ Mn) Analysis and Forecast by Market Taxonomy

                  19.3.5.1. By Product Type

                  19.3.5.2. By Application

                  19.3.5.3. By Distribution Channel

            19.3.6. India Market - Competition Landscape

      19.4. South Korea Market Analysis

            19.4.1. Introduction

            19.4.2. Pricing Analysis

            19.4.3. PEST Analysis

            19.4.4. Market Value Proportion & Volume Analysis by Market Taxonomy

            19.4.5. Market Value (US$ Mn) Analysis and Forecast by Market Taxonomy

                  19.4.5.1. By Product Type

                  19.4.5.2. By Application

                  19.4.5.3. By Distribution Channel

            19.4.6. South Korea Market - Competition Landscape

20. Market Structure Analysis

      20.1. Market Analysis by Tier of Companies (Home Sleep Screening Devices)

      20.2. Market Concentration

      20.3. Market Share Analysis of Top Players

      20.4. Market Presence Analysis

            20.4.1. By Regional footprint of Players

            20.4.2. Product foot print by Players

            20.4.3. Channel Foot Print by Players

21. Competition Analysis

      21.1. Competition Dashboard

      21.2. Pricing Analysis by Competition

      21.3. Competition Benchmarking

      21.4. Competition Deep Dive

            21.4.1. Koninklijke Philips N.V.

                  21.4.1.1. Overview

                  21.4.1.2. Product Portfolio

                  21.4.1.3. Profitability by Market Segments (Product/Channel/Region)

                  21.4.1.4. Sales Footprint

                  21.4.1.5. Strategy Overview

                           21.4.1.5.1. Marketing Strategy

                           21.4.1.5.2. Product Strategy

                           21.4.1.5.3. Channel Strategy

            21.4.2. Fitbit, Inc.

            21.4.3. Huami Corporation

            21.4.4. Garmin Ltd.

            21.4.5. Fossil Group, Inc.

            21.4.6. Huawei Technologies Co., Ltd.

            21.4.7. ResMed Inc.

            21.4.8. Responsive Surface Technology, LLC

            21.4.9. Simmons Bedding Company LLC

            21.4.10. Dreams

            21.4.11. Cleveland Medical Devices Inc.

            21.4.12. NovaSom

            21.4.13. Itamar Medical Ltd.

            21.4.14. Ez Sleep

            21.4.15. ApneaMed

            21.4.16. SleepWorks, LLC

            21.4.17. VirtuOx, Inc.

22. Assumptions and Acronyms Used

23. Research Methodology

Don't pay for what you don't need

Customize your report by selecting specific countries or regions and save 30%!

List of Tables

Table 01: Expenditure on Health, (% of GDP), by Country, 2016 - 2021

Table 02: Expenditure on Health, (% of GDP), by Country, 2016 - 2021

Table 03: Global Market Size Value (US$ Mn) Analysis 2013–2021 and Forecast 2022–2028 , By Product Type

Table 04: Global Market Size Value (US$ Mn) Analysis 2013–2021 and Forecast 2022–2028 , By Application

Table 05: Global Market size (US$ Mn) Analysis 2013–2021 and Forecast 2022–2028, By Distribution Channel

Table 06: Global Market Size (US$ Mn) Forecast By Region, 2013-2028

Table 07: North America Market size (US$ Mn)Analysis-2013–2021 and Forecast 2022-2028  By Country

Table 08: North America Market size (US$ Mn) Analysis-2013–2021 and Forecast 2022-2028  By Product Type

Table 09: North America Market size (US$ Mn) Analysis-2013–2021 and Forecast 2022-2028  By Product Type

Table 10: North America Market size (US$ Mn) Analysis-2013–2021 and Forecast 2022-2028  By Application

Table 11: North America Market size (US$ Mn) Analysis-2013–2021 and Forecast 2022-2028  By Distribution Channel

Table 12: Latin America Market size (US$ Mn)Analysis-2013–2021 and Forecast 2022-2028  By Country

Table 13: Latin America Market size (US$ Mn) Analysis-2013–2021 and Forecast 2022-2028  By Product Type

Table 14: Latin America Market size (US$ Mn) Analysis-2013–2021 and Forecast 2022-2028  By Product Type

Table 15: Latin America Market size (US$ Mn) Analysis-2013–2021 and Forecast 2022-2028  By Application

Table 16: Latin America Market size (US$ Mn) Analysis-2013–2021 and Forecast 2022-2028  By Distribution Channel

Table 17: Europe Market size (US$ Mn)Analysis-2013–2021 and Forecast 2022-2028  By Country

Table 18: Europe Market size (US$ Mn) Analysis-2013–2021 and Forecast 2022-2028  By Product Type

Table 19: Europe Market size (US$ Mn) Analysis-2013–2021 and Forecast 2022-2028  By Product Type

Table 20: Europe Market size (US$ Mn) Analysis-2013–2021 and Forecast 2022-2028  By Application

Table 21: Europe Market size (US$ Mn) Analysis-2013–2021 and Forecast 2022-2028  By Distribution Channel

Table 22: East Asia Market size (US$ Mn)Analysis-2013–2021 and Forecast 2022-2028  By Country

Table 23: East Asia Market size (US$ Mn) Analysis-2013–2021 and Forecast 2022-2028  By Product Type

Table 24: East Asia Market size (US$ Mn) Analysis-2013–2021 and Forecast 2022-2028  By Product Type

Table 25: East Asia Market size (US$ Mn) Analysis-2013–2021 and Forecast 2022-2028  By Application

Table 26: East Asia Market size (US$ Mn) Analysis-2013–2021 and Forecast 2022-2028  By Distribution Channel

Table 27: South Asia Market size (US$ Mn)Analysis-2013–2021 and Forecast 2022-2028  By Country

Table 28: South Asia Market size (US$ Mn) Analysis-2013–2021 and Forecast 2022-2028  By Product Type

Table 29: South Asia Market size (US$ Mn) Analysis-2013–2021 and Forecast 2022-2028  By Product Type

Table 30: South Asia Market size (US$ Mn) Analysis-2013–2021 and Forecast 2022-2028  By Application

Table 31: South Asia Market size (US$ Mn) Analysis-2013–2021 and Forecast 2022-2028  By Distribution Channel

Table 32: Oceania Market size (US$ Mn)Analysis-2013–2021 and Forecast 2022-2028  By Country

Table 33: Oceania Market size (US$ Mn) Analysis-2013–2021 and Forecast 2022-2028  By Product Type

Table 34: Oceania Market size (US$ Mn) Analysis-2013–2021 and Forecast 2022-2028  By Product Type

Table 35: Oceania Market size (US$ Mn) Analysis-2013–2021 and Forecast 2022-2028  By Application

Table 36: Oceania Market size (US$ Mn) Analysis-2013–2021 and Forecast 2022-2028  By Distribution Channel

Table 37: Middle East and Africa Market size (US$ Mn)Analysis-2013–2021 and Forecast 2022-2028  By Country

Table 38: Middle East and Africa Market size (US$ Mn) Analysis-2013–2021 and Forecast 2022-2028  By Product Type

Table 39: Middle East and Africa Market size (US$ Mn) Analysis-2013–2021 and Forecast 2022-2028  By Product Type

Table 40: Middle East and Africa Market size (US$ Mn) Analysis-2013–2021 and Forecast 2022-2028  By Application

Table 41: Middle East and Africa Market size (US$ Mn) Analysis-2013–2021 and Forecast 2022-2028  By Distribution Channel

Table 42: China Market size (US$ Mn) Analysis-2013–2021 and Forecast 2022-2028  By Product Type

Table 43: China Market size (US$ Mn) Analysis-2013–2021 and Forecast 2022-2028  By Product Type

Table 44: China Market size (US$ Mn) Analysis-2013–2021 and Forecast 2022-2028  By Application

Table 45: China Market size (US$ Mn) Analysis-2013–2021 and Forecast 2022-2028  By Distribution Channel

Table 46: India Market size (US$ Mn) Analysis-2013–2021 and Forecast 2022-2028  By Product Type

Table 47: India Market size (US$ Mn) Analysis-2013–2021 and Forecast 2022-2028  By Product Type

Table 48: India Market size (US$ Mn) Analysis-2013–2021 and Forecast 2022-2028  By Application

Table 49: India Market size (US$ Mn) Analysis-2013–2021 and Forecast 2022-2028  By Distribution Channel

Table 50: South Korea Market size (US$ Mn) Analysis-2013–2021 and Forecast 2022-2028  By Product Type

Table 51: South Korea Market size (US$ Mn) Analysis-2013–2021 and Forecast 2022-2028  By Product Type

Table 52: South Korea Market size (US$ Mn) Analysis-2013–2021 and Forecast 2022-2028  By Application

Table 53: South Korea Market size (US$ Mn) Analysis-2013–2021 and Forecast 2022-2028  By Distribution Channel
Sabyasachi Ghosh
Sabyasachi Ghosh

Principal Consultant

Talk to Analyst

Find your sweet spots for generating winning opportunities in this market.

List of Charts

Figure 01: Global Market Value Share 2018E, By Region

Figure 02: Global Market Value Share, By Product Type

Figure 03: Regional Average Pricing Analysis (US$) of Wearable Ring Devices  (2017A)

Figure 04: Regional Average Pricing Analysis (US$) of Wearable Wristband and Hand band Devices (2017A)

Figure 05: Regional Average Pricing Analysis (US$) of Wearable Ring Devices  (2017A)

Figure 06: Regional Average Pricing Analysis (US$) of Wearable Wristband and Hand band Devices (2017A)

Figure 07: Global Market Value (US$ Mn), 2013–2021

Figure 08: Global Absolute $ Opportunity (US$ Mn), 2021–2028

Figure 09: Global Market Value Analysis and Forecast, 2016–2028 (US$ Mn)

Figure 10: Global Market Share Analysis (%) By Product Type, 2022 & 2028

Figure 11: Global Market Y-o-Y Growth (%) By Product Type, 2022–2028

Figure 12: Global Market Attractiveness Analysis By Product Type, 2022–2028 

Figure 13: Global Market Share Analysis (%) By Application, 2022 & 2028

Figure 14: Global Market Y-o-Y Growth (%) By Application, 2022–2028

Figure 15: , Market Forecast & Y-o-Y Growth (%), 2022-2028

Figure 16: Global Market Attractiveness Analysis By Application, 2022–2028 

Figure 17: Global Market Share Analysis (%) By Distribution Channel, 2022 & 2028

Figure 18: Global Market Y-o-Y Growth (%) By Distribution Channel, 2022–2028

Figure 19: Global Market Attractiveness Analysis By Distribution Channel, 2022–2028 

Figure 20: Global Market Share Analysis (%) By Region, 2022 & 2028

Figure 21: Global Market Y-o-Y Growth (%) By Region, 2022–2028

Figure 22: Global Market Attractiveness Analysis By Region, 2022–2028 

Figure 23: North America Market Value Share, By Country (2021 A)

Figure 24: North America Market Value Share, By Product Type (2021 A)

Figure 25: North America Market Value Share, By Application (2021 A)

Figure 26: North America Market Value Share, By Distribution Channel (2021 A)

Figure 27: North America Market Size Analysis, 2013–2021

Figure 28: North America Market Forecast & Y-o-Y growth, 2022–2028

Figure 29: U.S. , Market Size (US$ Mn) Analysis, 2013–2021 

Figure 30: Canada , Market Size (US$ Mn) Analysis, 2013–2021 

Figure 31: Canada , Market Forecast & Y-o-Y Growth (%), 2022-2028

Figure 32: North America Market Size (US$ Mn) Analysis, 2013–2021, By Sleep Monitors

Figure 33: North America Market Forecast & Y-o-Y Growth (%), 2022-2028, By Sleep Monitors

Figure 34: North America Market Size (US$ Mn) Analysis, 2013–2021, By Wearables

Figure 35: North America Market Forecast & Y-o-Y Growth (%), 2022-2028, By Wearables

Figure 36: North America Market Size (US$ Mn) Analysis, 2013–2021, By Non-Wearables

Figure 37: North America Market Forecast & Y-o-Y Growth (%), 2022-2028, By Non-Wearables

Figure 38: North America Market Size (US$ Mn) Analysis, 2013–2021, By Smart Sleep Equipment

Figure 39: North America Market Forecast & Y-o-Y Growth (%), 2022-2028, By Smart Sleep Equipment

Figure 40: North America Market Attractiveness Analysis By Country, 2022-2028

Figure 41: North America Market Attractiveness Analysis By Product Type, 2022-2028 

Figure 42: North America Market Attractiveness Analysis By Application, 2022-2028

Figure 43: North America Market Attractiveness Analysis By Distribution Channel, 2022-2028 

Figure 44: Latin America Market Value Share, By Country (2021 A)

Figure 45: Latin America Market Value Share, By Product Type (2021 A)

Figure 46: Latin America Market Value Share, By Application (2021 A)

Figure 47: Latin America Market Value Share, By Distribution Channel (2021 A)

Figure 48: Latin America Market Size Analysis, 2013–2021

Figure 49: Latin America Market Forecast & Y-o-Y growth, 2022–2028

Figure 50: Brazil , Market Size (US$ Mn) Analysis, 2013–2021 

Figure 51: Brazil , Market Forecast & Y-o-Y Growth (%), 2022-2028

Figure 52: Mexico , Market Size (US$ Mn) Analysis, 2013–2021 

Figure 53: Mexico , Market Forecast & Y-o-Y Growth (%), 2022-2028

Figure 54: Rest of Latin America , Market Size (US$ Mn) Analysis, 2013–2021 

Figure 55: Rest of Latin America , Market Forecast & Y-o-Y Growth (%), 2022-2028

Figure 56: Latin America Market Size (US$ Mn) Analysis, 2013–2021, By Sleep Monitors

Figure 57: Latin America Market Forecast & Y-o-Y Growth (%), 2022-2028, By Sleep Monitors

Figure 58: Latin America Market Size (US$ Mn) Analysis, 2013–2021, By Wearables

Figure 59: Latin America Market Forecast & Y-o-Y Growth (%), 2022-2028, By Wearables

Figure 60: Latin America Market Size (US$ Mn) Analysis, 2013–2021, By Non-Wearables

Figure 61: Latin America Market Forecast & Y-o-Y Growth (%), 2022-2028, By Non-Wearables

Figure 62: Latin America Market Size (US$ Mn) Analysis, 2013–2021, By Smart Sleep Equipment

Figure 63: Latin America Market Forecast & Y-o-Y Growth (%), 2022-2028, By Smart Sleep Equipment

Figure 64: Latin America Market Attractiveness Analysis By Country, 2022-2028

Figure 65: Latin America Market Attractiveness Analysis By Product Type, 2022-2028 

Figure 66: Latin America Market Attractiveness Analysis By Application, 2022-2028

Figure 67: Latin America Market Attractiveness Analysis By Distribution Channel, 2022-2028 

Figure 68: Europe Market Value Share, By Country (2021 A)

Figure 69: Europe Market Value Share, By Product Type (2021 A)

Figure 70: Europe Market Value Share, By Application (2021 A)

Figure 71: Europe Market Value Share, By Distribution Channel (2021 A)

Figure 72: Europe Market Size Analysis, 2013–2021

Figure 73: Europe Market Forecast & Y-o-Y growth, 2022–2028

Figure 74: Germany , Market Size (US$ Mn) Analysis, 2013–2021 

Figure 75: Germany , Market Forecast & Y-o-Y Growth (%), 2022-2028

Figure 76: Italy , Market Size (US$ Mn) Analysis, 2013–2021 

Figure 77: Italy , Market Forecast & Y-o-Y Growth (%), 2022-2028

Figure 78: France , Market Size (US$ Mn) Analysis, 2013–2021 

Figure 79: France , Market Forecast & Y-o-Y Growth (%), 2022-2028

Figure 80: U.K. , Market Size (US$ Mn) Analysis, 2013–2021 

Figure 81: U.K. , Market Forecast & Y-o-Y Growth (%), 2022-2028

Figure 82: Spain , Market Size (US$ Mn) Analysis, 2013–2021 

Figure 83: Spain , Market Forecast & Y-o-Y Growth (%), 2022-2028

Figure 84: Russia , Market Size (US$ Mn) Analysis, 2013–2021 

Figure 85: Russia , Market Forecast & Y-o-Y Growth (%), 2022-2028

Figure 86: BENELUX , Market Size (US$ Mn) Analysis, 2013–2021 

Figure 87: BENELUX , Market Forecast & Y-o-Y Growth (%), 2022-2028

Figure 88: Rest of Europe , Market Size (US$ Mn) Analysis, 2013–2021 

Figure 89: Rest of Europe , Market Forecast & Y-o-Y Growth (%), 2022-2028

Figure 90: Europe Market Size (US$ Mn) Analysis, 2013–2021, By Sleep Monitors

Figure 91: Europe Market Forecast & Y-o-Y Growth (%), 2022-2028, By Sleep Monitors

Figure 92: Europe Market Size (US$ Mn) Analysis, 2013–2021, By Wearables

Figure 93: Europe Market Forecast & Y-o-Y Growth (%), 2022-2028, By Wearables

Figure 94: Europe Market Size (US$ Mn) Analysis, 2013–2021, By Non-Wearables

Figure 95: Europe Market Forecast & Y-o-Y Growth (%), 2022-2028, By Non-Wearables

Figure 96: Europe Market Size (US$ Mn) Analysis, 2013–2021, By Smart Sleep Equipment

Figure 97: Europe Market Forecast & Y-o-Y Growth (%), 2022-2028, By Smart Sleep Equipment

Figure 98: Europe Market Attractiveness Analysis By Country, 2022-2028

Figure 99: Europe Market Attractiveness Analysis By Product Type, 2022-2028 

Figure 100: Europe Market Attractiveness Analysis By Application, 2022-2028

Figure 101: Europe Market Attractiveness Analysis By Distribution Channel, 2022-2028 

Figure 102: East Asia Market Value Share, By Country (2021 A)

Figure 103: East Asia Market Value Share, By Product Type (2021 A)

Figure 104: East Asia Market Value Share, By Application (2021 A)

Figure 105: East Asia Market Value Share, By Distribution Channel (2021 A)

Figure 106: East Asia Market Size Analysis, 2013–2021

Figure 107: East Asia Market Forecast & Y-o-Y growth, 2022–2028

Figure 108: China , Market Size (US$ Mn) Analysis, 2013–2021 

Figure 109: China , Market Forecast & Y-o-Y Growth (%), 2022-2028

Figure 110: Japan , Market Size (US$ Mn) Analysis, 2013–2021 

Figure 111: Japan , Market Forecast & Y-o-Y Growth (%), 2022-2028

Figure 112: South Korea , Market Size (US$ Mn) Analysis, 2013–2021 

Figure 113: South Korea , Market Forecast & Y-o-Y Growth (%), 2022-2028

Figure 114: East Asia Market Size (US$ Mn) Analysis, 2013–2021, By Sleep Monitors

Figure 115: East Asia Market Forecast & Y-o-Y Growth (%), 2022-2028, By Sleep Monitors

Figure 116: East Asia Market Size (US$ Mn) Analysis, 2013–2021, By Wearables

Figure 117: East Asia Market Forecast & Y-o-Y Growth (%), 2022-2028, By Wearables

Figure 118: East Asia Market Size (US$ Mn) Analysis, 2013–2021, By Non-Wearables

Figure 119: East Asia Market Forecast & Y-o-Y Growth (%), 2022-2028, By Non-Wearables

Figure 120: East Asia Market Size (US$ Mn) Analysis, 2013–2021, By Smart Sleep Equipment

Figure 121: East Asia Market Forecast & Y-o-Y Growth (%), 2022-2028, By Smart Sleep Equipment

Figure 122: East Asia Market Attractiveness Analysis By Country, 2022-2028

Figure 123: East Asia Market Attractiveness Analysis By Product Type, 2022-2028 

Figure 124: East Asia Market Attractiveness Analysis By Application, 2022-2028

Figure 125: East Asia Market Attractiveness Analysis By Distribution Channel, 2022-2028 

Figure 126: South Asia Market Value Share, By Country (2021 A)

Figure 127: South Asia Market Value Share, By Product Type (2021 A)

Figure 128: South Asia Market Value Share, By Application (2021 A)

Figure 129: South Asia Market Value Share, By Distribution Channel (2021 A)

Figure 130: South Asia Market Size Analysis, 2013–2021

Figure 131: South Asia Market Forecast & Y-o-Y growth, 2022–2028

Figure 132: India , Market Size (US$ Mn) Analysis, 2013–2021 

Figure 133: India , Market Forecast & Y-o-Y Growth (%), 2022-2028

Figure 134: Thailand , Market Size (US$ Mn) Analysis, 2013–2021 

Figure 135: Thailand , Market Forecast & Y-o-Y Growth (%), 2022-2028

Figure 136: Indonesia , Market Size (US$ Mn) Analysis, 2013–2021 

Figure 137: Indonesia , Market Forecast & Y-o-Y Growth (%), 2022-2028

Figure 138: Malaysia , Market Size (US$ Mn) Analysis, 2013–2021 

Figure 139: Malaysia , Market Forecast & Y-o-Y Growth (%), 2022-2028

Figure 140: Rest of South Asia , Market Size (US$ Mn) Analysis, 2013–2021 

Figure 141: Rest of South Asia , Market Forecast & Y-o-Y Growth (%), 2022-2028

Figure 142: South Asia Market Size (US$ Mn) Analysis, 2013–2021, By Sleep Monitors

Figure 143: South Asia Market Forecast & Y-o-Y Growth (%), 2022-2028, By Sleep Monitors

Figure 144: South Asia Market Size (US$ Mn) Analysis, 2013–2021, By Wearables

Figure 145: South Asia Market Forecast & Y-o-Y Growth (%), 2022-2028, By Wearables

Figure 146: South Asia Market Size (US$ Mn) Analysis, 2013–2021, By Non-Wearables 

Figure 147: South Asia Market Forecast & Y-o-Y Growth (%), 2022-2028, By Non-Wearables

Figure 148: South Asia Market Size (US$ Mn) Analysis, 2013–2021, By Smart Sleep Equipment

Figure 149: South Asia Market Forecast & Y-o-Y Growth (%), 2022-2028, By Smart Sleep Equipment

Figure 150: South Asia Market Attractiveness Analysis By Country, 2022-2028

Figure 151: South Asia Market Attractiveness Analysis By Product Type, 2022-2028 

Figure 152: South Asia Market Attractiveness Analysis By Application, 2022-2028

Figure 153: South Asia Market Attractiveness Analysis By Distribution Channel, 2022-2028 

Figure 154: Oceania Market Value Share, By Country (2021 A)

Figure 155: Oceania Market Value Share, By Product Type (2021 A)

Figure 156: Oceania Market Value Share, By Application (2021 A)

Figure 157: Oceania Market Value Share, By Distribution Channel (2021 A)

Figure 158: Oceania Market Size Analysis, 2013–2021

Figure 159: Oceania Market Forecast & Y-o-Y growth, 2022–2028

Figure 160: Australia , Market Size (US$ Mn) Analysis, 2013–2021 

Figure 161: Australia , Market Forecast & Y-o-Y Growth (%), 2022-2028

Figure 162: New Zealand , Market Size (US$ Mn) Analysis, 2013–2021 

Figure 163: New Zealand , Market Forecast & Y-o-Y Growth (%), 2022-2028

Figure 164: Oceania Market Size (US$ Mn) Analysis, 2013–2021, By Sleep Monitors

Figure 165: Oceania Market Forecast & Y-o-Y Growth (%), 2022-2028, By Sleep Monitors

Figure 166: Oceania Market Size (US$ Mn) Analysis, 2013–2021, By Wearables

Figure 167: Oceania Market Forecast & Y-o-Y Growth (%), 2022-2028, By Wearables

Figure 168: Oceania Market Size (US$ Mn) Analysis, 2013–2021, By Non-Wearables

Figure 169: Oceania Market Forecast & Y-o-Y Growth (%), 2022-2028, By Non-Wearables

Figure 170: Oceania Market Size (US$ Mn) Analysis, 2013–2021, By Smart Sleep Equipment

Figure 171: Oceania Market Forecast & Y-o-Y Growth (%), 2022-2028, By Smart Sleep Equipment

Figure 172: Oceania Market Attractiveness Analysis By Country, 2022-2028

Figure 173: Oceania Market Attractiveness Analysis By Product Type, 2022-2028 

Figure 174: Oceania Market Attractiveness Analysis By Application, 2022-2028

Figure 175: Oceania Market Attractiveness Analysis By Distribution Channel, 2022-2028 

Figure 176: Middle East and Africa Market Value Share, By Country (2021 A)

Figure 177: Middle East and Africa Market Value Share, By Product Type (2021 A)

Figure 178: Middle East and Africa Market Value Share, By Application (2021 A)

Figure 179: Middle East and Africa Market Value Share, By Distribution Channel (2021 A)

Figure 180: Middle East and Africa Market Size Analysis, 2013–2021

Figure 181: Middle East and Africa Market Forecast & Y-o-Y growth, 2022–2028

Figure 182: GCC Countries , Market Size (US$ Mn) Analysis, 2013–2021 

Figure 183: GCC Countries , Market Forecast & Y-o-Y Growth (%), 2022-2028

Figure 184: South Africa , Market Size (US$ Mn) Analysis, 2013–2021 

Figure 185: South Africa , Market Forecast & Y-o-Y Growth (%), 2022-2028

Figure 186: Turkey , Market Size (US$ Mn) Analysis, 2013–2021 

Figure 187: Turkey , Market Forecast & Y-o-Y Growth (%), 2022-2028

Figure 188: Northern Africa , Market Size (US$ Mn) Analysis, 2013–2021 

Figure 189: Northern Africa , Market Forecast & Y-o-Y Growth (%), 2022-2028

Figure 190: Rest of MEA , Market Size (US$ Mn) Analysis, 2013–2021 

Figure 191: Rest of MEA , Market Forecast & Y-o-Y Growth (%), 2022-2028

Figure 192: Middle East and Africa Market Size (US$ Mn) Analysis, 2013–2021, By Sleep Monitors

Figure 193: Middle East and Africa Market Forecast & Y-o-Y Growth (%), 2022-2028, By Sleep Monitors

Figure 194: Middle East and Africa Market Size (US$ Mn) Analysis, 2013–2021, By Wearables

Figure 195: Middle East and Africa Market Forecast & Y-o-Y Growth (%), 2022-2028, By Wearables

Figure 196: Middle East and Africa Market Size (US$ Mn) Analysis, 2013–2021, By Non-Wearables 

Figure 197: Middle East and Africa Market Forecast & Y-o-Y Growth (%), 2022-2028, By Non-Wearables

Figure 198: Middle East and Africa Market Size (US$ Mn) Analysis, 2013–2021, By Smart Sleep Equipment

Figure 199: Middle East and Africa Market Forecast & Y-o-Y Growth (%), 2022-2028, By Smart Sleep Equipment

Figure 200: Middle East and Africa Market Attractiveness Analysis By Country, 2022-2028

Figure 201: Middle East and Africa Market Attractiveness Analysis By Product Type, 2022-2028 

Figure 202: Middle East and Africa Market Attractiveness Analysis By Application, 2022-2028

Figure 203: Middle East and Africa Market Attractiveness Analysis By Distribution Channel, 2022-2028 

Figure 204: China Market Value Share, By Product Type (2021 A)

Figure 205: China Market Value Share, By Application (2021 A)

Figure 206: China Market Value Share, By Distribution Channel (2021 A)

Figure 207: China Market Size Analysis, 2013–2021

Figure 208: China Market Forecast & Y-o-Y growth, 2022–2028

Figure 209: China Market Size (US$ Mn) Analysis, 2013–2021, By Sleep Monitors

Figure 210: China Market Forecast & Y-o-Y Growth (%), 2022-2028, By Sleep Monitors

Figure 211: China Market Size (US$ Mn) Analysis, 2013–2021, By Wearables

Figure 212: China Market Forecast & Y-o-Y Growth (%), 2022-2028, By Wearables

Figure 213: China Market Size (US$ Mn) Analysis, 2013–2021, By Non-Wearables

Figure 214: China Market Forecast & Y-o-Y Growth (%), 2022-2028, By Non-Wearables

Figure 215: China Market Size (US$ Mn) Analysis, 2013–2021, By Smart Sleep Equipment

Figure 216: China Market Forecast & Y-o-Y Growth (%), 2022-2028, By Smart Sleep Equipment

Figure 217: China Market Attractiveness Analysis By Product Type, 2022-2028 

Figure 218: China Market Attractiveness Analysis By Application, 2022-2028

Figure 219: China Market Attractiveness Analysis By Distribution Channel, 2022-2028 

Figure 220: India Market Value Share, By Product Type (2021 A)

Figure 221: India Market Value Share, By Application (2021 A)

Figure 222: India Market Value Share, By Distribution Channel (2021 A)

Figure 223: India Market Size Analysis, 2013–2021

Figure 224: India Market Forecast & Y-o-Y growth, 2022–2028

Figure 225: India Market Size (US$ Mn) Analysis, 2013–2021, By Sleep Monitors

Figure 226: India Market Forecast & Y-o-Y Growth (%), 2022-2028, By Sleep Monitors

Figure 227: India Market Size (US$ Mn) Analysis, 2013–2021, By Wearables

Figure 228: India Market Forecast & Y-o-Y Growth (%), 2022-2028, By Wearables

Figure 229: India Market Size (US$ Mn) Analysis, 2013–2021, By Non-Wearables

Figure 230: India Market Forecast & Y-o-Y Growth (%), 2022-2028, By Non-Wearables

Figure 231: India Market Size (US$ Mn) Analysis, 2013–2021, By Smart Sleep Equipment

Figure 232: India Market Forecast & Y-o-Y Growth (%), 2022-2028, By Smart Sleep Equipment

Figure 233: India Market Attractiveness Analysis By Product Type, 2022-2028 

Figure 234: India Market Attractiveness Analysis By Application, 2022-2028

Figure 235: India Market Attractiveness Analysis By Distribution Channel, 2022-2028 

Figure 236: South Korea Market Value Share, By Product Type (2021 A)

Figure 237: South Korea Market Value Share, By Application (2021 A)

Figure 238: South Korea Market Value Share, By Distribution Channel (2021 A)

Figure 239: South Korea Market Size Analysis, 2013–2021

Figure 240: South Korea Market Forecast & Y-o-Y growth, 2022–2028

Figure 241: South Korea Market Size (US$ Mn) Analysis, 2013–2021, By Sleep Monitors

Figure 242: South Korea Market Forecast & Y-o-Y Growth (%), 2022-2028, By Sleep Monitors

Figure 243: South Korea Market Size (US$ Mn) Analysis, 2013–2021, By Wearables

Figure 244: South Korea Market Forecast & Y-o-Y Growth (%), 2022-2028, By Wearables

Figure 245: South Korea Market Size (US$ Mn) Analysis, 2013–2021, By Non-Wearables

Figure 246: South Korea Market Forecast & Y-o-Y Growth (%), 2022-2028, By Non-Wearables

Figure 247: South Korea Market Size (US$ Mn) Analysis, 2013–2021, By Smart Sleep Equipment

Figure 248: South Korea Market Forecast & Y-o-Y Growth (%), 2022-2028, By Smart Sleep Equipment

Figure 249: South Korea Market Attractiveness Analysis By Product Type, 2022-2028 

Figure 250: South Korea Market Attractiveness Analysis By Application, 2022-2028

Figure 251: South Korea Market Attractiveness Analysis By Distribution Channel, 2022-2028 

Figure 252: Global Industry Structure 

Figure 253: Global Market Share, By Tier (2021)

Recommendations

Healthcare

On-site Preventive Care Market

Published : March 2024

Healthcare

Sleep Apnea Diagnostic Systems Market

Published : June 2023

Healthcare

High Content Screening Market

Published : May 2023

Healthcare

Cotinine Screening Devices Market

Published : October 2022

Explore Healthcare Insights

View Reports

Home Sleep Screening Devices Market