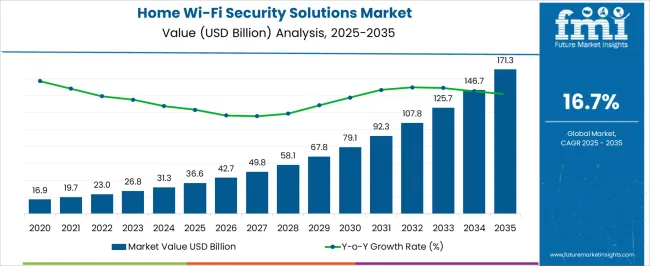
The global home Wi-Fi security solutions market size reached USD 19.9 billion in 2021 and is likely to touch a valuation of USD 23.0 billion in 2022. Furthermore, with the increasing need for securing Wi-Fi to protect devices from getting hacked, the overall demand for home Wi-Fi security solutions is projected to grow at an impressive CAGR of 16.7% between 2022 and 2032, reaching a market valuation of USD 107.6 billion by 2032.
Home WiFi security solutions are smart security devices that can protect connected devices from various virtual intruders such as viruses, malware, and hackers. Home wireless network security solutions include various network architectures including Wi-Fi routers, modems and routers as one device, Wi-Fi range extenders, and others.
Currently, the home Wi-Fi security solutions market accounts for around 34.0% of the global home security solutions market and this number is expected to further increase over the next ten years due to the rising adoption of various wireless security solutions across homes.
Attribute | Key Insights |
---|---|
Home Wi-Fi Security Solutions Market Estimated Size (2022) | USD 23.0 billion |
Projected Market Size (2032) | USD 107.6 billion |
Value-based CAGR% (2022 to 2032) | 16.7% |
Top 5 Vendor Market Share | Around 40% |
Rising internet penetration and increasing usage of IoT devices are encouraging people to install home Wi-Fi security solutions and this trend is likely to continue during the forecast period.
The internet has been such a boon because it offers so many benefits in daily life, from staying in touch to picking up new skills and protecting houses. Around 5 billion individuals worldwide currently have an internet connection. IoT refers to a system where computing devices are linked together across a network utilizing unique identifiers (UIDs) and transfer the data without any human-to-computer or human-to-human interaction.
A router that is connected to the internet and a controller or hub which is connected to the IoT devices or sensors are needed for the deployment of home automation utilizing IoT devices. The most popular IoT connectivity standard is Wi-Fi, which connects wired or wireless IoT devices to a central controller or hub that is connected to a router via an Ethernet cable.
With the aid of a smartphone and the internet, it is convenient to manage and automate numerous IoT devices from a distance. The internet of things (IoT) gadgets will be able to convey information like room temperature, voltage supply, energy usage, live video stream, etc. to the smartphone app and facilitate remote monitoring of homes.
In 2021, there were more than 10 billion IoT devices that were in use. The adoption of these devices allows users to handle and monitor home security from anywhere through Wi-Fi. This in turn necessitates the use of home Wi-Fi security solutions, which will eventually boost the growth of the home Wi-Fi security solutions market over the next ten years.
The home Wi-Fi security solutions market is estimated to rise at 16.7% CAGR between 2022 and 2032 in comparison to the 15.2% CAGR registered during the historical period of 2017 to 2021. Increasing penetration of the internet across the globe, growing usage of IoT devices, and rising adoption of Wi-Fi protection systems are some of the key factors driving the global home wi-fi security solutions market.
Home wi-fi security solutions are being increasingly adopted to secure wireless connections. They keep data hidden and protect communications while blocking hackers from users’ networks.
These security devices are connected to a wireless internet network, making the service available to all customers regardless of wireless or home broadband service provider. They can be managed from home or remotely via smartphone, tablet, or PC with secure login. These home Wi-Fi security solutions offer features such as setting up for internet usage, apps, and internet usage, per device profiles, internet stop button, and weekly usage report.
The increasing incidence of cyberattacks along with the growing adoption of wireless security to prevent unauthorized access or damage to computers or data using wireless networks will continue to boost sales of home Wi-Fi security solutions in the global market.
Similarly, growing awareness about the benefits of using various wi-fi security solutions, especially across emerging economies will bode well for the home wi-fi security solutions market growth during the next ten years.
By network architecture, the modem and router as one device segment is expected to grow at the highest CAGR of 19.4% during the forecasted period. Similarly, by component segment, the software segment is anticipated to grow at the highest CAGR of 18.8% from 2022 to 2032.
Regionally, North America is expected to dominate the global home Wi-Fi security solutions market, reaching around ~USD 31.3 billion by 2032. However, South Asia & Pacific home wi-fi security solutions market is anticipated to grow at the highest CAGR of 21.1% during the forecast period of 2022 to 2032.
Rapid Surge in the Number of Internet Users and Smart Devices to Bolster Demand
One of the key elements fueling the expansion of the smart home market is the use of smart gadgets. The demand for smart devices like Amazon Echo, Alexa, Google Home, smart TVs, home theatres, fitness bands, and other products is increasing at a robust pace and the trend is likely to continue during the upcoming years. Since internet users and smart devices are integrated, as their usage grows, there will likely be a corresponding rise in demand for internet users.
The internet connects smart devices, enabling users to control features like home security access, temperature, lighting, HVAC control, and entertainment. Smart gadgets make it simple to multitask, give users the power to rapidly find information and answers, assist in setting reminders and appointments, and much more.
Thus, with the rising penetration of the internet and smart devices across the globe, the overall home security systems. Is likely to witness a strong growth rate during the forecast period.
The surge in Cyberattacks and Need for Improved Wireless Network Security Driving Demand
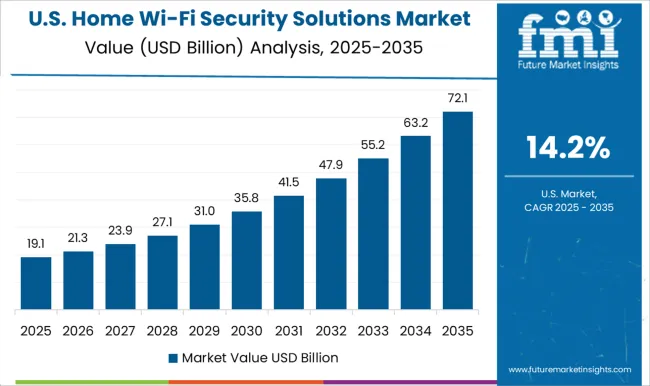
The USA Home Wi-Fi security solutions market is anticipated to exhibit a growth rate of over 13.8% CAGR during the forecast period, reaching a valuation of around USD 6.8 billion in 2022. Growing security concerns due to the rise in cyberattacks and increasing adoption of advanced technologies are some of the key factors driving growth in the USA market.
Similarly, the heavy presence of leading market players and novel product launches in the country will bode well for market growth during the next ten years.
The USA home wi-fi security solutions market will be further strengthened by the expanding research and development within this sector, which is creating a space for the internet of things, home alarm systems & security home automation, and remote monitoring.
Growing Adoption of Advanced Security Solutions to Boost the Sales
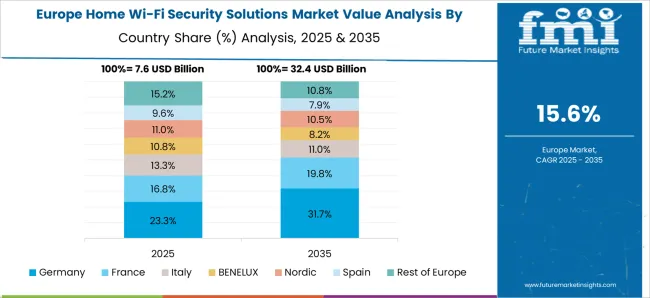
The home wi-fi security solutions market in Germany is anticipated to grow at a prolific CAGR of 18.5% during the forecast period of 2022 and 2032, making it one of the most prominent markets in Europe.
Increasing rates of crime, growing awareness related to security and safety, declining prices of security products and the rising adoption of cloud-based technologies in the country are fueling the demand for home Wi-Fi security solutions.
Similarly, constant developments in security technologies like sensors and smart cameras and the growing adoption of machine learning and artificial intelligence software in the residential security sector will propel the demand for Wi-Fi security solutions in the country during the next ten years.
Rise in Internet Users Propelling Demand for Wi-Fi Security Solutions in China
China is likely to remain one of the most dominating markets for home wi-fi security solutions across East Asia and is expected to grow at an impressive CAGR of 18.5% from 2022 to 2032. This can be attributed to factors such as increasing internet penetration, rising government support, growing IoT market, & increasing awareness about smart home technology.
Similarly, increasing urbanization, the rising need for home monitoring from remote locations, and stringent government rules and regulation are expected to spur the demand for Wi-Fi security solutions in the country during the forecast period.
Demand to Remain High for Software Components in Home Wi-Fi Security Solutions Market
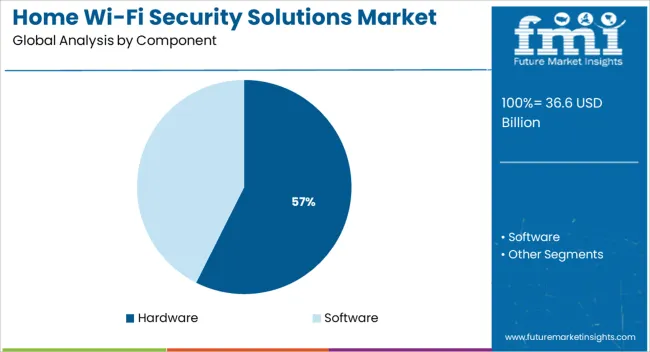
Based on components, the hardware segment will continue to dominate the global home Wi-Fi security solutions market during the forecast period, accounting for the largest share by the end of 2032.
However, the software segment is set to register the highest growth rate of 18.8% CAGR during the forecast period (2022 to 32). This can be attributed to the rising usage of various wireless security software by end users to improve wireless network security and prevent cyberattacks.
Modem and Router as One Device Segment to Generate Highest Revenues Through 2032
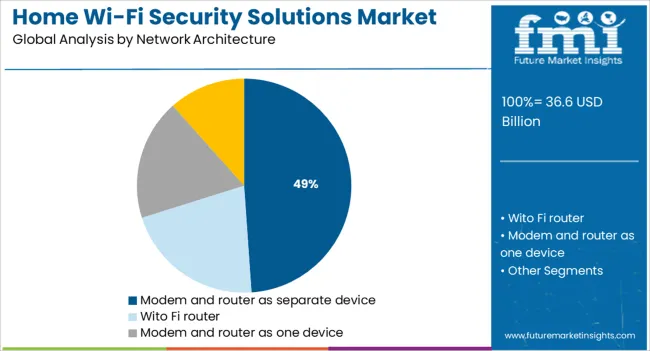
Based on network architecture, the Wi-Fi router segment is anticipated to expand up to 4.3X through 2032. However, the modem and router as one device segment are likely to grow at the highest CAGR of 19.4% during the forecast period (2022 to 2032).
A modem, also known as an ISP, is a device that links home networks to internet service providers. A router is a simple box that lets all wireless and wired devices use that internet connection at once. The router and modem as one device help WiFi security hardware systems to perform better and thus demand modem and router as one device will continue to surge amid the growing need for improving wireless network security.
Demand for Wi-Fi Security Solutions to Remain High Across Independent Homes
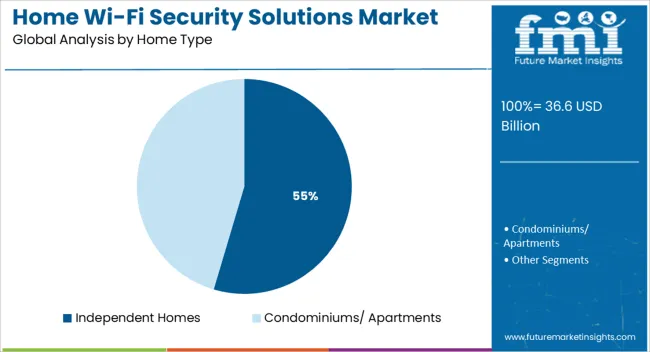
Based on home type, the independent homes segment will continue to retain its dominance in the global home Wi-Fi security solutions market by accounting for the largest market share through 2032. Furthermore, FMI predicts a CAGR of around 17.5% CAGR for the independent homes segment throughout the forecast period. This can be attributed to the rapid urbanization and increasing adoption of home Wi-Fi security solutions across independent homes.
Home WiFi security solutions provide advantages to independent homes including real-time security alerts, remote monitoring & video surveillance, and control of household functions. Besides these, they save money on utility bills. Therefore, the adoption of home WiFi security solutions will continue to remain high in the independent homes segment.
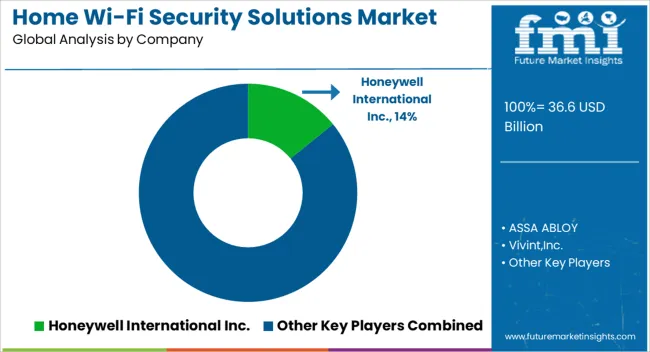
Leading players in the home Wi-Fi security solutions market are concentrating on investing heavily in innovation, research, and development practices. They are also adopting strategies such as launching new security solutions and establishing partnerships and collaborations to gain a competitive edge in the market. For instance,
CUJO AI is the industry pioneer in the creation and use of artificial intelligence to enhance the safety, management, and privacy of connected devices in homes and workplaces. The CUJO AI Engine was developed using billions of actual data points. By discretely monitoring network traffic, it efficiently detects and stops harmful activities. The objective is to protect the overall connected experience while fusing artificial intelligence and machine learning.
The company brings to network, mobile, and public wi-fi operators around the world a complete portfolio of products to provide their customers with a seamlessly integrated suite of digital life protection services. The company recently (September 2021) announced that its security products and services are now available in more than 40 million households.
CUJO AI is continuously striving to provide effective security solutions to end users by launching new products and services, for instance, in October 2020, in order to effectively identify and safeguard devices that employ MAC address randomization, CUJO AI unveiled its recently patented Device Identification function.
Similarly, in September 2020, CUJO AI announced that its Digital Life Protection services are currently being implemented in the networks of five key North American operators at scale.
Another leading provider of home wi-fi security solutions is ASSA ABLOY. The company offers a complete range of access solutions making people feel safe and secure in simple and convenient ways.
ASSA ABLOY’s wireless control solutions can upgrade existing security or build a completely new access system that effectively secures the wireless connection and prevents cyberattacks. The company is increasingly adopting merger and acquisition strategies to expand its global footprint. For instance, in 2021, ASSAT ABLOY acquired B&B Roadway and Security Solutions in the USA.
Paul Judge and Mike Van Bruinisse, who have previously collaborated at cybersecurity companies CipherTrust and Purewire, founded Luma in 2014. The creators' perception of inconsistent Wi-Fi throughout private houses and the necessity for greater security as the Internet of Things (IoT) spreads was the inspiration for the idea.
Luma was an Atlanta, Georgia-based provider of Wi-Fi solutions. The business offers mesh networking-enabled Wi-Fi routers for distributing a steady Wi-Fi signal across individual houses, as well as a related mobile app for parental controls and additional levels of protection. The company (LUMA) was acquired by Mural in March 2022.
Attribute | Details |
---|---|
Estimated Market Value (2022) | USD 23.0 billion |
Projected Market Value (2032) | USD 107.6 billion |
Market CAGR 2022 to 2032 | 16.7% |
Share of top 5 players | Around 40% |
Forecast Period | 2022 to 2032 |
Historical Data Available for | 2017 to 2021 |
Market Analysis | USD Billion for Value |
Key Regions Covered | North America; Latin America; Europe; East Asia; South Asia & Pacific; and the Middle East & Africa |
Key Countries Covered | The USA, Canada, Germany, The United Kingdom, France, Italy, Spain, BENELUX, Russia, China, Japan, South Korea, India, Malaysia, Indonesia, Singapore, Australia & New Zealand, GCC Countries, Turkey, and South Africa |
Key Segments Covered | Component, Network Architecture, Home Type, and Region |
Key Companies Profiled | Honeywell International; ASSA ABLOY; Vivint, Inc.; SimpliSafe, Inc.; Axis Communications AB; NETGEAR Inc.; Hangzhou Hikvision Digital Technology Co. Ltd; Cove Smart, LLC; Bosch Service Solutions GmbH; Metadata; Eero; Securifi |
Report Coverage | Market Forecast, Company Share Analysis, Competition Intelligence, DROT Analysis, Market Dynamics and Challenges, and Strategic Growth Initiatives |
Table 01: Global Market Value (US$ million) Analysis (2017 to 2021) by Component
Table 02: Global Market Value (US$ million) Forecast (2022 to 2032) by Component
Table 03: Global Market Value (US$ million) Analysis (2017 to 2021) by Network Architecture
Table 04: Global Market Value (US$ million) Forecast (2022 to 2032) by Network Architecture
Table 05: Global Market Value (US$ million) Analysis (2017 to 2021) by Type
Table 06: Global Market Value (US$ million) Forecast (2022 to 2032) by Type
Table 07: Global Market Value (US$ million) Analysis (2017 to 2021) by Region
Table 08: Global Market Value (US$ million) Forecast (2022 to 2032) by Region
Table 09: North America Market Value (US$ million) Analysis (2017 to 2021) by Component
Table 10: North America Market Value (US$ million) Forecast (2022 to 2032) by Component
Table 11: North America Market Value (US$ million) Analysis (2017 to 2021) by Network Architecture
Table 12: North America Market Value (US$ million) Forecast (2022 to 2032) by Network Architecture
Table 13: North America Market Value (US$ million) Analysis (2017 to 2021) by Type
Table 14: North America Market Value (US$ million) Forecast (2022 to 2032) by Type
Table 15: North America Market Value (US$ million) Analysis (2017 to 2021) by Country
Table 16: North America Market Value (US$ million) Forecast (2022 to 2032) by Country
Table 17: Latin America Market Value (US$ million) Analysis (2017 to 2021) by Component
Table 18: Latin America Market Value (US$ million) Forecast (2022 to 2032) by Component
Table 19: Latin America Market Value (US$ million) Analysis (2017 to 2021) by Network Architecture
Table 20: Latin America Market Value (US$ million) Forecast (2022 to 2032) by Network Architecture
Table 21: Latin America Market Value (US$ million) Analysis (2017 to 2021) by Type
Table 22: Latin America Market Value (US$ million) Forecast (2022 to 2032) by Type
Table 23: Latin America Market Value (US$ million) Analysis (2017 to 2021) by Country
Table 24: Latin America Market Value (US$ million) Forecast (2022 to 2032) by Country
Table 25: Europe Market Value (US$ million) Analysis (2017 to 2021) by Component
Table 26: Europe Market Value (US$ million) Forecast (2022 to 2032) by Component
Table 27: Europe Market Value (US$ million) Analysis (2017 to 2021) by Network Architecture
Table 28: Europe Market Value (US$ million) Forecast (2022 to 2032) by Network Architecture
Table 29: Europe Market Value (US$ million) Analysis (2017 to 2021) by Type
Table 30: Europe Market Value (US$ million) Forecast (2022 to 2032) by Type
Table 31: Europe Market Value (US$ million) Analysis (2017 to 2021) by Country
Table 32: Italy Market Value (US$ million) Analysis (2017 to 2021) by Network Architecture
Table 33: Europe Market Value (US$ million) Forecast (2022 to 2032) by Country
Table 34: East Asia Market Value (US$ million) Analysis (2017 to 2021) by Component
Table 35: East Asia Market Value (US$ million) Forecast (2022 to 2032) by Component
Table 36: East Asia Market Value (US$ million) Analysis (2017 to 2021) by Network Architecture
Table 37: East Asia Market Value (US$ million) Forecast (2022 to 2032) by Network Architecture
Table 38: East Asia Market Value (US$ million) Analysis (2017 to 2021) by Type
Table 39: East Asia Market Value (US$ million) Forecast (2022 to 2032) by Type
Table 40: East Asia Market Value (US$ million) Analysis (2017 to 2021) by Country
Table 41: East Asia Market Value (US$ million) Forecast (2022 to 2032) by Country
Table 42: South Asia & Pacific Market Value (US$ million) Analysis (2017 to 2021) by Component
Table 43: South Asia & Pacific Market Value (US$ million) Forecast (2022 to 2032) by Component
Table 44: South Asia & Pacific Market Value (US$ million) Analysis (2017 to 2021) by Network Architecture
Table 45: South Asia & Pacific Market Value (US$ million) Forecast (2022 to 2032) by Network Architecture
Table 46: South Asia & Pacific Market Value (US$ million) Analysis (2017 to 2021) by Type
Table 47: South Asia & Pacific Market Value (US$ million) Forecast (2022 to 2032) by Type
Table 48: South Asia & Pacific Market Value (US$ million) Analysis (2017 to 2021) by Country
Table 49: South Asia & Pacific Market Value (US$ million) Forecast (2022 to 2032) by Country
Table 50: Middle East & Africa Market Value (US$ million) Analysis (2017 to 2021) by Component
Table 51: Middle East & Africa Market Value (US$ million) Forecast (2022 to 2032) by Component
Table 52: Middle East & Africa Market Value (US$ million) Analysis (2017 to 2021) by Network Architecture
Table 53: Middle East & Africa Market Value (US$ million) Forecast (2022 to 2032) by Network Architecture
Table 54: Mexico Market Value (US$ million) Forecast (2022 to 2032) by Component
Table 55: Middle East & Africa Market Value (US$ million) Analysis (2017 to 2021) by Type
Table 56: Middle East & Africa Market Value (US$ million) Forecast (2022 to 2032) by Type
Table 57: Middle East & Africa Market Value (US$ million) Analysis (2017 to 2021) by Country
Table 58: Middle East & Africa Market Value (US$ million) Forecast (2022 to 2032) by Country
Table 59: The USA Market Value (US$ million) Analysis (2017 to 2021) by Component
Table 60: The USA Market Value (US$ million) Forecast (2022 to 2032) by Component
Table 61: The USA Market Value (US$ million) Analysis (2017 to 2021) by Network Architecture
Table 62: The USA Market Value (US$ million) Forecast (2022 to 2032) by Network Architecture
Table 63: The USA Market Value (US$ million) Analysis (2017 to 2021) by Type
Table 64: The USA Market Value (US$ million) Forecast (2022 to 2032) by Type
Table 65: Canada Market Value (US$ million) Analysis (2017 to 2021) by Component
Table 66: Canada Market Value (US$ million) Forecast (2022 to 2032) by Component
Table 67: Canada Market Value (US$ million) Analysis (2017 to 2021) by Network Architecture
Table 68: Canada Market Value (US$ million) Forecast (2022 to 2032) by Network Architecture
Table 69: Canada Market Value (US$ million) Analysis (2017 to 2021) by Type
Table 70: Canada Market Value (US$ million) Forecast (2022 to 2032) by Type
Table 71: Brazil Market Value (US$ million) Analysis (2017 to 2021) by Component
Table 72: Brazil Market Value (US$ million) Forecast (2022 to 2032) by Component
Table 73: Brazil Market Value (US$ million) Analysis (2017 to 2021) by Network Architecture
Table 74: Brazil Market Value (US$ million) Forecast (2022 to 2032) by Network Architecture
Table 75: Brazil Market Value (US$ million) Analysis (2017 to 2021) by Type
Table 76: Brazil Market Value (US$ million) Forecast (2022 to 2032) by Type
Table 77: Mexico Market Value (US$ million) Analysis (2017 to 2021) by Component
Table 78: Mexico Market Value (US$ million) Analysis (2017 to 2021) by Network Architecture
Table 79: Mexico Market Value (US$ million) Forecast (2022 to 2032) by Network Architecture
Table 80: Mexico Market Value (US$ million) Analysis (2017 to 2021) by Type
Table 81: Mexico Market Value (US$ million) Forecast (2022 to 2032) by Type
Table 82: Rest of Latin America Market Value (US$ million) Analysis (2017 to 2021) by Component
Table 83: Rest of Latin America Market Value (US$ million) Forecast (2022 to 2032) by Component
Table 84: Rest of Latin America Market Value (US$ million) Analysis (2017 to 2021) by Network Architecture
Table 85: Rest of Latin America Market Value (US$ million) Forecast (2022 to 2032) by Network Architecture
Table 86: Rest of Latin America Market Value (US$ million) Analysis (2017 to 2021) by Type
Table 87: Rest of Latin America Market Value (US$ million) Forecast (2022 to 2032) by Type
Table 88: the United Kingdom Market Value (US$ million) Analysis (2017 to 2021) by Component
Table 89: the United Kingdom Market Value (US$ million) Forecast (2022 to 2032) by Component
Table 90: the United Kingdom Market Value (US$ million) Analysis (2017 to 2021) by Network Architecture
Table 91: the United Kingdom Market Value (US$ million) Forecast (2022 to 2032) by Network Architecture
Table 92: the United Kingdom Market Value (US$ million) Analysis (2017 to 2021) by Type
Table 93: the United Kingdom Market Value (US$ million) Forecast (2022 to 2032) by Type
Table 94: Germany Market Value (US$ million) Analysis (2017 to 2021) by Component
Table 95: Germany Market Value (US$ million) Forecast (2022 to 2032) by Component
Table 96: Germany Market Value (US$ million) Analysis (2017 to 2021) by Network Architecture
Table 97: Germany Market Value (US$ million) Forecast (2022 to 2032) by Network Architecture
Table 98: Germany Market Value (US$ million) Analysis (2017 to 2021) by Type
Table 99: Germany Market Value (US$ million) Forecast (2022 to 2032) by Type
Table 100: France Market Value (US$ million) Analysis (2017 to 2021) by Component
Table 101: France Market Value (US$ million) Forecast (2022 to 2032) by Component
Table 102: France Market Value (US$ million) Analysis (2017 to 2021) by Network Architecture
Table 103: France Market Value (US$ million) Forecast (2022 to 2032) by Network Architecture
Table 104: France Market Value (US$ million) Analysis (2017 to 2021) by Type
Table 105: France Market Value (US$ million) Forecast (2022 to 2032) by Type
Table 106: Italy Market Value (US$ million) Analysis (2017 to 2021) by Component
Table 107: Italy Market Value (US$ million) Forecast (2022 to 2032) by Component
Table 108: Italy Market Value (US$ million) Forecast (2022 to 2032) by Network Architecture
Table 109: Italy Market Value (US$ million) Analysis (2017 to 2021) by Type
Table 110: Italy Market Value (US$ million) Forecast (2022 to 2032) by Type
Table 111: Spain Market Value (US$ million) Analysis (2017 to 2021) by Component
Table 112: Spain Market Value (US$ million) Forecast (2022 to 2032) by Component
Table 113: Spain Market Value (US$ million) Analysis (2017 to 2021) by Network Architecture
Table 114: Spain Market Value (US$ million) Forecast (2022 to 2032) by Network Architecture
Table 115: Spain Market Value (US$ million) Analysis (2017 to 2021) by Type
Table 116: Spain Market Value (US$ million) Forecast (2022 to 2032) by Type
Table 117: Benelux Market Value (US$ million) Analysis (2017 to 2021) by Component
Table 118: Benelux Market Value (US$ million) Forecast (2022 to 2032) by Component
Table 119: Benelux Market Value (US$ million) Analysis (2017 to 2021) by Network Architecture
Table 120: Benelux Market Value (US$ million) Forecast (2022 to 2032) by Network Architecture
Table 121: Benelux The USA Market Value (US$ million) Analysis (2017 to 2021) by Type
Table 122: Benelux Market Value (US$ million) Forecast (2022 to 2032) by Type
Table 123: Russia Market Value (US$ million) Analysis (2017 to 2021) by Component
Table 124: Russia Market Value (US$ million) Forecast (2022 to 2032) by Component
Table 125: Russia Market Value (US$ million) Analysis (2017 to 2021) by Network Architecture
Table 126: Russia Market Value (US$ million) Forecast (2022 to 2032) by Network Architecture
Table 127: Russia Market Value (US$ million) Analysis (2017 to 2021) by Type
Table 128: Russia Market Value (US$ million) Forecast (2022 to 2032) by Type
Table 129: Rest of Europe Market Value (US$ million) Analysis (2017 to 2021) by Component
Table 130: Rest of Europe Market Value (US$ million) Forecast (2022 to 2032) by Component
Table 131: Rest of Europe Market Value (US$ million) Analysis (2017 to 2021) by Network Architecture
Table 132: Rest of Europe Market Value (US$ million) Forecast (2022 to 2032) by Network Architecture
Table 133: Rest of Europe Market Value (US$ million) Analysis (2017 to 2021) by Type
Table 134: Rest of Europe Market Value (US$ million) Forecast (2022 to 2032) by Type
Table 135: China Market Value (US$ million) Analysis (2017 to 2021) by Component
Table 136: China Market Value (US$ million) Forecast (2022 to 2032) by Component
Table 137: China Market Value (US$ million) Analysis (2017 to 2021) by Network Architecture
Table 138: China Market Value (US$ million) Forecast (2022 to 2032) by Network Architecture
Table 139: China Market Value (US$ million) Analysis (2017 to 2021) by Type
Table 140: China Market Value (US$ million) Forecast (2022 to 2032) by Type
Table 141: Japan Market Value (US$ million) Analysis (2017 to 2021) by Component
Table 142: Japan Market Value (US$ million) Forecast (2022 to 2032) by Component
Table 143: Japan Market Value (US$ million) Analysis (2017 to 2021) by Network Architecture
Table 144: Japan Market Value (US$ million) Forecast (2022 to 2032) by Network Architecture
Table 145: Japan Market Value (US$ million) Analysis (2017 to 2021) by Type
Table 146: Japan Market Value (US$ million) Forecast (2022 to 2032) by Type
Table 147: South Korea Market Value (US$ million) Analysis (2017 to 2021) by Component
Table 148: South Korea Market Value (US$ million) Forecast (2022 to 2032) by Component
Table 149: South Korea Market Value (US$ million) Analysis (2017 to 2021) by Network Architecture
Table 150: South Korea Market Value (US$ million) Forecast (2022 to 2032) by Network Architecture
Table 151: South Korea Market Value (US$ million) Analysis (2017 to 2021) by Type
Table 152: South Korea Market Value (US$ million) Forecast (2022 to 2032) by Type
Table 153: India Market Value (US$ million) Analysis (2017 to 2021) by Component
Table 154: India Market Value (US$ million) Forecast (2022 to 2032) by Component
Table 155: India Market Value (US$ million) Analysis (2017 to 2021) by Network Architecture
Table 156: India Market Value (US$ million) Forecast (2022 to 2032) by Network Architecture
Table 157: India Market Value (US$ million) Analysis (2017 to 2021) by Type
Table 158: India Market Value (US$ million) Forecast (2022 to 2032) by Type
Table 159: Thailand Market Value (US$ million) Analysis (2017 to 2021) by Component
Table 160: Thailand Market Value (US$ million) Forecast (2022 to 2032) by Component
Table 161: Thailand Market Value (US$ million) Analysis (2017 to 2021) by Network Architecture
Table 162: Thailand Market Value (US$ million) Forecast (2022 to 2032) by Network Architecture
Table 163: Thailand Market Value (US$ million) Analysis (2017 to 2021) by Type
Table 164: Thailand Market Value (US$ million) Forecast (2022 to 2032) by Type
Table 165: Indonesia Market Value (US$ million) Analysis (2017 to 2021) by Component
Table 166: Indonesia Market Value (US$ million) Forecast (2022 to 2032) by Component
Table 167: Indonesia Market Value (US$ million) Analysis (2017 to 2021) by Network Architecture
Table 168: Indonesia Market Value (US$ million) Forecast (2022 to 2032) by Network Architecture
Table 169: Indonesia Market Value (US$ million) Analysis (2017 to 2021) by Type
Table 170: Indonesia Market Value (US$ million) Forecast (2022 to 2032) by Type
Table 171: Malaysia Market Value (US$ million) Analysis (2017 to 2021) by Component
Table 172: Malaysia Market Value (US$ million) Forecast (2022 to 2032) by Component
Table 173: Malaysia Market Value (US$ million) Analysis (2017 to 2021) by Network Architecture
Table 174: Malaysia Market Value (US$ million) Forecast (2022 to 2032) by Network Architecture
Table 175: Malaysia Market Value (US$ million) Analysis (2017 to 2021) by Type
Table 176: Malaysia Market Value (US$ million) Forecast (2022 to 2032) by Type
Table 177: Australia & New Zealand Market Value (US$ million) Analysis (2017 to 2021) by Component
Table 178: Australia & New Zealand Market Value (US$ million) Forecast (2022 to 2032) by Component
Table 179: Australia & New Zealand Market Value (US$ million) Analysis (2017 to 2021) by Network Architecture
Table 180: Australia & New Zealand Market Value (US$ million) Forecast (2022 to 2032) by Network Architecture
Table 181: Australia & New Zealand Market Value (US$ million) Analysis (2017 to 2021) by Type
Table 182: Australia & New Zealand Market Value (US$ million) Forecast (2022 to 2032) by Type
Table 183: Rest of SAP Market Value (US$ million) Analysis (2017 to 2021) by Component
Table 184: Rest of SAP Market Value (US$ million) Forecast (2022 to 2032) by Component
Table 185: Rest of SAP Market Value (US$ million) Analysis (2017 to 2021) by Network Architecture
Table 186: Rest of SAP Market Value (US$ million) Forecast (2022 to 2032) by Network Architecture
Table 187: Rest of SAP Market Value (US$ million) Analysis (2017 to 2021) by Type
Table 188: Rest of SAP Market Value (US$ million) Forecast (2022 to 2032) by Type
Table 189: GCC Countries Market Value (US$ million) Analysis (2017 to 2021) by Component
Table 190: GCC Countries Market Value (US$ million) Forecast (2022 to 2032) by Component
Table 191: GCC Countries Market Value (US$ million) Analysis (2017 to 2021) by Network Architecture
Table 192: GCC Countries Market Value (US$ million) Forecast (2022 to 2032) by Network Architecture
Table 193: GCC Countries Market Value (US$ million) Analysis (2017 to 2021) by Type
Table 194: GCC Countries Market Value (US$ million) Forecast (2022 to 2032) by Type
Table 195: Turkey Market Value (US$ million) Analysis (2017 to 2021) by Component
Table 196: Turkey Market Value (US$ million) Forecast (2022 to 2032) by Component
Table 197: Turkey Market Value (US$ million) Analysis (2017 to 2021) by Network Architecture
Table 198: Turkey Market Value (US$ million) Forecast (2022 to 2032) by Network Architecture
Table 199: Turkey Market Value (US$ million) Analysis (2017 to 2021) by Type
Table 200: Turkey Market Value (US$ million) Forecast (2022 to 2032) by Type
Table 201: South Africa Market Value (US$ million) Analysis (2017 to 2021) by Component
Table 202: South Africa Market Value (US$ million) Forecast (2022 to 2032) by Component
Table 203: South Africa Market Value (US$ million) Analysis (2017 to 2021) by Network Architecture
Table 204: South Africa Market Value (US$ million) Forecast (2022 to 2032) by Network Architecture
Table 205: South Africa Market Value (US$ million) Analysis (2017 to 2021) by Type
Table 206: South Africa Market Value (US$ million) Forecast (2022 to 2032) by Type
Table 207: Rest of Middle East & Africa Market Value (US$ million) Analysis (2017 to 2021) by Component
Table 208: Rest of Middle East & Africa Market Value (US$ million) Forecast (2022 to 2032) by Component
Table 209: Rest of Middle East & Africa Market Value (US$ million) Analysis (2017 to 2021) by Network Architecture
Table 210: Rest of Middle East & Africa Market Value (US$ million) Forecast (2022 to 2032) by Network Architecture
Table 211: Rest of Middle East & Africa Market Value (US$ million) Analysis (2017 to 2021) by Type
Table 212: Rest of Middle East & Africa Market Value (US$ million) Forecast (2022 to 2032) by Type
Figure 01: Global Market Size (US$ million) and Y-o-Y Growth Rate from 2022 to 2032
Figure 02: Global Market Absolute $ Opportunity from 2022 to 2032
Figure 03: Global Market Value (US$ million), 2017 to 2032
Figure 04: Global Market Value (US$ million), 2022 to 2032
Figure 05: Global Market Value Share Analysis (2022 to 2032) by Component
Figure 06: Global Market Value Y-o-Y Growth Trend Analysis (2019 to 2032) by Component
Figure 07: Global Market Attractiveness by Component
Figure 08: Global Market Value Share Analysis (2022 to 2032) by Network Architecture
Figure 09: Global Market Value Y-o-Y Growth Trend Analysis (2019 to 2032) by Network Architecture
Figure 10: Global Market Attractiveness by Network Architecture
Figure 11: Global Market Value Share Analysis (2022 to 2032) by Type
Figure 12: Global Market Value Y-o-Y Growth Trend Analysis (2019 to 2032) by Type
Figure 13: Global Market Attractiveness by Type
Figure 14: Global Market Value Share Analysis (2022 to 2032) by Region
Figure 15: Global Market Value Y-o-Y Growth Trend Analysis (2019 to 2032) by Region
Figure 16: North America Market Absolute $ Opportunity (US$ million), 2017 to 2032
Figure 17: Rest of Middle East & Africa Market Absolute $ Opportunity (US$ million), 2017 to 2032
Figure 18: Latin America Market Absolute $ Opportunity (US$ million), 2017 to 2032
Figure 19: Europe Market Absolute $ Opportunity (US$ million), 2017 to 2032
Figure 20: East Asia Market Absolute $ Opportunity (US$ million), 2017 to 2032
Figure 21: South Asia and Pacific Market Absolute $ Opportunity (US$ million), 2017 to 2032
Figure 22: Middle East and Africa Market Absolute $ Opportunity (US$ million), 2017 to 2032
Figure 23: Global Market Attractiveness by Region
Figure 24: North America Market Value (US$ million), 2017 to 2032
Figure 25: North America Market Value (US$ million), 2022 to 2032
Figure 26: North America Market Value Share Analysis (2022 to 2032) by Component
Figure 27: North America Market Value Y-o-Y Growth Trend Analysis (2019 to 2032) by Component
Figure 28: North America Market Attractiveness by Component
Figure 29: North America Market Value Share Analysis (2022 to 2032) by Network Architecture
Figure 30: North America Market Value Y-o-Y Growth Trend Analysis (2019 to 2032) by Network Architecture
Figure 31: North America Market Attractiveness by Network Architecture
Figure 32: North America Market Value Share Analysis (2022 to 2032) by Type
Figure 33: North America Market Value Y-o-Y Growth Trend Analysis (2019 to 2032) by Type
Figure 34: North America Market Attractiveness by Type
Figure 35: North America Market Value Share Analysis (2022 to 2032) by Country
Figure 36: North America Market Value Y-o-Y Growth Trend Analysis (2019 to 2032) by Country
Figure 37:The USA Market Absolute $ Opportunity (US$ million), 2017 to 2032
Figure 38: Canada Market Absolute $ Opportunity (US$ million), 2017 to 2032
Figure 39: North America Market Attractiveness by Country
Figure 40: Latin America Market Value (US$ million), 2017 to 2032
Figure 41: Latin America Market Value (US$ million), 2022 to 2032
Figure 42: Latin America Market Value Share Analysis (2022 to 2032) by Component
Figure 43: Latin America Market Value Y-o-Y Growth Trend Analysis (2019 to 2032) by Component
Figure 44: Latin America Market Attractiveness by Component
Figure 45: Latin America Market Value Share Analysis (2022 to 2032) by Network Architecture
Figure 46: Latin America Market Value Y-o-Y Growth Trend Analysis (2019 to 2032) by Network Architecture
Figure 47: Latin America Market Attractiveness by Network Architecture
Figure 48: Latin America Market Value Share Analysis (2022 to 2032) by Type
Figure 49: Latin America Market Value Y-o-Y Growth Trend Analysis (2019 to 2032) by Type
Figure 50: Latin America Market Attractiveness by Type
Figure 51: Latin America Market Value Share Analysis (2022 to 2032) by Country
Figure 52: Latin America Market Value Y-o-Y Growth Trend Analysis (2019 to 2032) by Country
Figure 53: Brazil Market Absolute $ Opportunity (US$ million), 2017 to 2032
Figure 54: Mexico Market Absolute $ Opportunity (US$ million), 2017 to 2032
Figure 55: Rest of Latin America Market Absolute $ Opportunity (US$ million), 2017 to 2032
Figure 56: Latin America Market Attractiveness by Country
Figure 57: Europe Market Value (US$ million), 2017 to 2032
Figure 58: Europe Market Value (US$ million), 2022 to 2032
Figure 59: Europe Market Value Share Analysis (2022 to 2032) by Component
Figure 60: Europe Market Value Y-o-Y Growth Trend Analysis (2019 to 2032) by Component
Figure 61: Europe Market Attractiveness by Component
Figure 62: Europe Market Value Share Analysis (2022 to 2032) by Network Architecture
Figure 63: Europe Market Value Y-o-Y Growth Trend Analysis (2019 to 2032) by Network Architecture
Figure 64: Europe Market Attractiveness by Network Architecture
Figure 65: Europe Market Value Share Analysis (2022 to 2032) by Type
Figure 66: Europe Market Value Y-o-Y Growth Trend Analysis (2019 to 2032) by Type
Figure 67: Europe Market Attractiveness by Type
Figure 68: Europe Market Value Share Analysis (2022 to 2032) by Country
Figure 69: Europe Market Value Y-o-Y Growth Trend Analysis (2019 to 2032) by Country
Figure 70: the United Kingdom Market Absolute $ Opportunity (US$ million), 2017 to 2032
Figure 71: Germany Market Absolute $ Opportunity (US$ million), 2017 to 2032
Figure 72: France Market Absolute $ Opportunity (US$ million), 2017 to 2032
Figure 73: Italy Market Absolute $ Opportunity (US$ million), 2017 to 2032
Figure 74: Spain Market Absolute $ Opportunity (US$ million), 2017 to 2032
Figure 75: BENELUX Market Absolute $ Opportunity (US$ million), 2017 to 2032
Figure 76: Russia Market Absolute $ Opportunity (US$ million), 2017 to 2032
Figure 77: Rest of Europe Market Absolute $ Opportunity (US$ million), 2017 to 2032
Figure 78: Europe Market Attractiveness by Country
Figure 79: East Asia Market Value (US$ million), 2017 to 2032
Figure 80: East Asia Market Value (US$ million), 2022 to 2032
Figure 81: East Asia Market Value Share Analysis (2022 to 2032) by Component
Figure 82: East Asia Market Value Y-o-Y Growth Trend Analysis (2019 to 2032) by Component
Figure 83: East Asia Market Attractiveness by Component
Figure 84: East Asia Market Value Share Analysis (2022 to 2032) by Network Architecture
Figure 85: East Asia Market Value Y-o-Y Growth Trend Analysis (2019 to 2032) by Network Architecture
Figure 86: East Asia Market Attractiveness by Network Architecture
Figure 87: East Asia Market Value Share Analysis (2022 to 2032) by Type
Figure 88: East Asia Market Value Y-o-Y Growth Trend Analysis (2019 to 2032) by Type
Figure 89: East Asia Market Attractiveness by Type
Figure 90: East Asia Market Value Share Analysis (2022 to 2032) by Country
Figure 91: East Asia Market Value Y-o-Y Growth Trend Analysis (2019 to 2032) by Country
Figure 92: China Market Absolute $ Opportunity (US$ million), 2017 to 2032
Figure 93: Japan Market Absolute $ Opportunity (US$ million), 2017 to 2032
Figure 94: Spain Market Absolute $ Opportunity (US$ million), 2017 to 2032
Figure 95: East Asia Market Attractiveness by Country
Figure 96: South Asia & Pacific Market Value (US$ million), 2017 to 2032
Figure 97: South Asia & Pacific Market Value (US$ million), 2022 to 2032
Figure 98: South Asia & Pacific Market Value Share Analysis (2022 to 2032) by Component
Figure 99: South Asia & Pacific Market Value Y-o-Y Growth Trend Analysis (2019 to 2032) by Component
Figure 100: South Asia & Pacific Market Attractiveness by Component
Figure 101: South Asia & Pacific Market Value Share Analysis (2022 to 2032) by Network Architecture
Figure 102: South Asia & Pacific Market Value Y-o-Y Growth Trend Analysis (2019 to 2032) by Network Architecture
Figure 103: South Asia & Pacific Market Attractiveness by Network Architecture
Figure 104: South Asia & Pacific Market Value Share Analysis (2022 to 2032) by Type
Figure 105: South Asia & Pacific Market Value Y-o-Y Growth Trend Analysis (2019 to 2032) by Type
Figure 106: South Asia & Pacific Market Attractiveness by Type
Figure 107: South Asia & Pacific Market Value Share Analysis (2022 to 2032) by Country
Figure 108: South Asia & Pacific Market Value Y-o-Y Growth Trend Analysis (2019 to 2032) by Country
Figure 109: India Market Absolute $ Opportunity (US$ million), 2017 to 2032
Figure 110: Thailand Market Absolute $ Opportunity (US$ million), 2017 to 2032
Figure 111: Indonesia Market Absolute $ Opportunity (US$ million), 2017 to 2032
Figure 112: Malaysia Market Absolute $ Opportunity (US$ million), 2017 to 2032
Figure 113: Australia & New Zealand Market Absolute $ Opportunity (US$ million), 2017 to 2032
Figure 114: Rest of South Asia & Pacific Market Absolute $ Opportunity (US$ million), 2017 to 2032
Figure 115: South Asia & Pacific Market Attractiveness by Country
Figure 116: Middle East & Africa Market Value (US$ million), 2017 to 2032
Figure 117: Middle East & Africa Market Value (US$ million), 2022 to 2032
Figure 118: Middle East & Africa Market Value Share Analysis (2022 to 2032) by Component
Figure 119: Middle East & Africa Market Value Y-o-Y Growth Trend Analysis (2019 to 2032) by Component
Figure 120: Middle East & Africa Market Attractiveness by Component
Figure 121: Middle East & Africa Market Value Share Analysis (2022 to 2032) by Network Architecture
Figure 122: Middle East & Africa Market Value Y-o-Y Growth Trend Analysis (2019 to 2032) by Network Architecture
Figure 123: Middle East & Africa Market Attractiveness by Network Architecture
Figure 124: Middle East & Africa Market Value Share Analysis (2022 to 2032) by Type
Figure 125: Middle East & Africa Market Value Y-o-Y Growth Trend Analysis (2019 to 2032) by Type
Figure 126: Middle East & Africa Market Attractiveness by Type
Figure 127: Middle East & Africa Market Value Share Analysis (2022 to 2032) by Country
Figure 128: Middle East & Africa Market Value Y-o-Y Growth Trend Analysis (2019 to 2032) by Country
Figure 129: GCC Countries Market Absolute $ Opportunity (US$ million), 2017 to 2032
Figure 130: Turkey Market Absolute $ Opportunity (US$ million), 2017 to 2032
Figure 131: South Africa Market Absolute $ Opportunity (US$ million), 2017 to 2032
Figure 132: Middle East & Africa Market Attractiveness by Country
The global home wi-fi security solutions market is expected to reach USD 23.0 billion in 2022.
As per FMI, the overall wi-fi security solutions market is set to grow at 16.7% CAGR from 2022 to 2032, reaching a valuation of USD 107.6 billion by 2032.
South Asia & Pacific is projected to register strong growth in the market, exhibiting a CAGR of nearly 21.1% during the forecast period.
Some of the leading companies in this landscape are Honeywell International, ASSA ABLOY, Vivint, SimpliSafe, and Axis Communications among others.
Independent homes segment is expected to dominate the market over the forecast period, generating the highest revenue by the end of 2032.
The global home wi-fi security solutions market in the last 5 years (2017 to 2021) grew at a CAGR of 15.2%.
Increasing internet penetration and rising usage of IoT devices are some of the key trends driving demand for home wi-fi security solutions in the market.
Countries involved in providing home Wi-Fi security solutions include the USA., Japan, China, Germany, and the United Kingdom.
The global wi-fi security solutions market grew at around 15.8% between 2021 and 2022.
The top 5 countries driving demand for home Wi-Fi security solutions include the USA, Japan, Germany, India, and China.
The United Kingdom is expected to account for 23.2% of the Europe home wi-fi security solutions market through 2032.
Explore Similar Insights
Thank you!
You will receive an email from our Business Development Manager. Please be sure to check your SPAM/JUNK folder too.