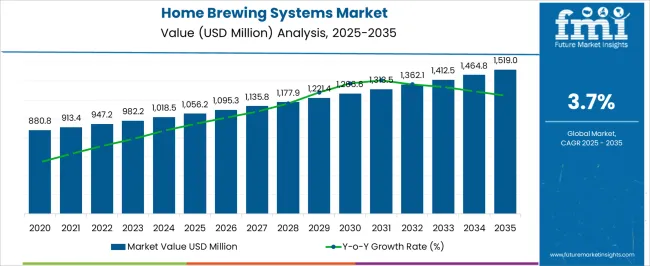
The Home Brewing Systems Market is estimated to be valued at USD 1056.2 million in 2025 and is projected to reach USD 1519.0 million by 2035, registering a compound annual growth rate (CAGR) of 3.7% over the forecast period.
| Metric | Value |
|---|---|
| Home Brewing Systems Market Estimated Value in (2025 E) | USD 1056.2 million |
| Home Brewing Systems Market Forecast Value in (2035 F) | USD 1519.0 million |
| Forecast CAGR (2025 to 2035) | 3.7% |
The Home Brewing Systems market is witnessing consistent expansion due to increasing consumer interest in craft beverages and a rising inclination toward home-based brewing setups. As noted in corporate announcements and trade media, the shift in consumer behavior toward health-conscious and customized drinking experiences is fostering demand for modular, compact, and easy-to-operate brewing systems.
This trend is further being supported by advancements in brewing automation and the growing visibility of home brewing culture through digital platforms. Additionally, strategic product launches from key players and the growing availability of high-quality raw ingredients for home use are playing a central role in encouraging adoption.
Investor briefings and consumer electronics expos have also emphasized the role of energy efficiency and digital connectivity in influencing buyer decisions With increasing consumer spending on lifestyle-enhancing kitchen appliances and growing awareness of brewing methods, the market is expected to maintain its upward trajectory, especially in urban and semi-urban regions with rising disposable incomes.
The market is segmented by Product, Distribution Channel, and Mode of Operation and region. By Product, the market is divided into Full Brewer and Mini Brewer. In terms of Distribution Channel, the market is classified into Offline and Online. Based on Mode of Operation, the market is segmented into Automatic and Manual. Regionally, the market is classified into North America, Latin America, Western Europe, Eastern Europe, Balkan & Baltic Countries, Russia & Belarus, Central Asia, East Asia, South Asia & Pacific, and the Middle East & Africa.
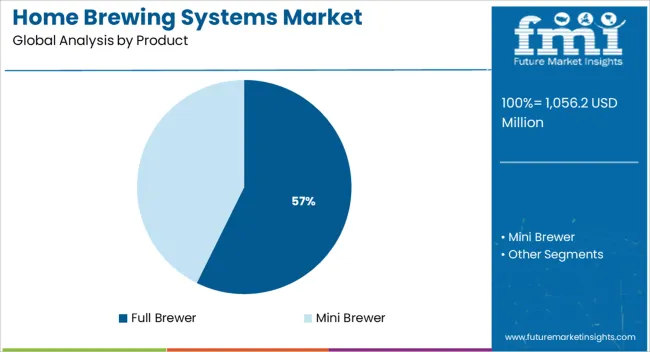
The full brewer product segment is projected to account for 57.3% of the Home Brewing Systems market revenue share in 2025, establishing it as the leading product category. This dominance is being attributed to the segment’s ability to deliver a comprehensive brewing experience with integrated features that simplify the process for both beginners and experienced users.
Full brewers are being preferred due to their all-in-one configuration, which eliminates the need for separate components and minimizes the margin for error in the brewing cycle. As highlighted in product demonstration events and consumer technology reviews, this segment is gaining traction among users seeking convenience, consistent output, and reduced manual intervention.
Manufacturers have increasingly focused on enhancing design, energy efficiency, and smart control features in full brewers, making them more attractive to a tech-savvy consumer base These functional advantages, coupled with growing interest in high-quality home craft brewing, have reinforced the segment’s leading position in the overall market.
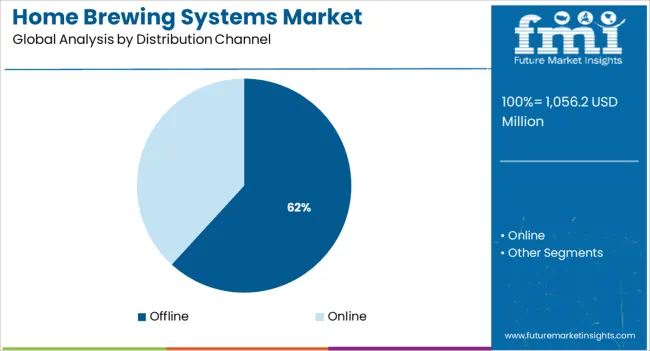
The offline distribution channel is expected to contribute 61.8% of the Home Brewing Systems market revenue share in 2025, maintaining its lead over online counterparts. This segment’s dominance is being driven by consumer preference for physically inspecting appliances, especially high-investment kitchen equipment, prior to purchase. As cited in retail performance reports and appliance trade updates, offline channels such as specialty stores, home improvement outlets, and brand showrooms are offering personalized consultations and product demonstrations that significantly influence buying behavior.
Brick-and-mortar presence has also enabled manufacturers to strengthen customer engagement and brand trust. In addition, bundled installation services, financing options, and promotional in-store offers are enhancing customer conversion rates.
While digital channels are expanding, the tangible experience and immediate product availability offered by offline stores are continuing to appeal to a broader consumer base, particularly in regions where digital infrastructure or trust in e-commerce is still developing These dynamics have collectively upheld the leadership of offline distribution in the market.
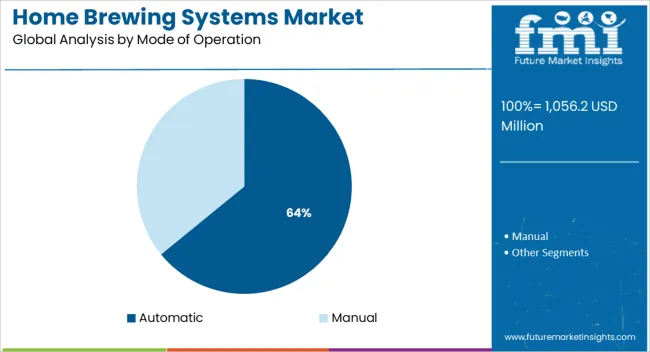
The automatic mode of operation segment is forecasted to capture 64.1% of the Home Brewing Systems market revenue share in 2025, making it the most dominant operational mode. This strong position is being reinforced by the increasing demand for user-friendly and time-saving brewing systems that reduce complexity and enhance precision. Automatic systems are being chosen due to their ability to manage the entire brewing process with minimal user intervention, from ingredient mixing to fermentation and carbonation.
As discussed in appliance innovation forums and smart kitchen product showcases, the segment is benefiting from improvements in sensor technology, programmable interfaces, and mobile app integration. These features appeal to modern consumers who prioritize convenience and consistency in home appliance usage.
Moreover, the rising preference for appliances that align with busy lifestyles and the growing penetration of smart homes have supported the adoption of automated brewing systems These technological and lifestyle-aligned benefits have contributed significantly to the segment’s leadership position in the market.
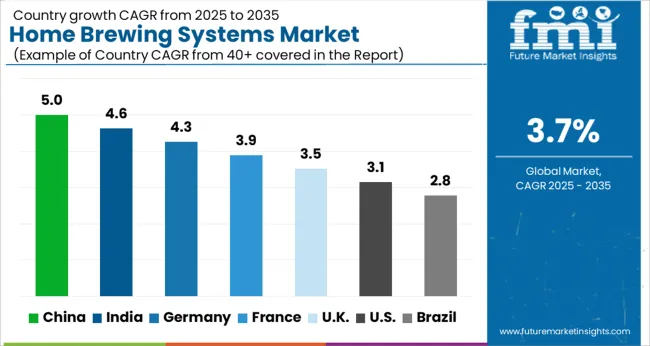
The global home brewing systems market is expected to grow significantly in the next ten years. The market showcased a moderate CAGR of 4.7% during the historical period from 2020 to 2025. However, as per FMI’s report, the market is anticipated to exhibit a CAGR of 3.7% in the forecast period from 2025 to 2035. Growing demand for specialty beer in both developed and developing countries is projected to drive the market.
The rising number of breweries providing numerous flavored beers is another crucial factor that is likely to fuel the global market in the evaluation period. As the market contains a large number of established companies, firms from countries such as India, the Czech Republic, Chile, the Caribbean, Argentina, Costa Rica, and Mexico are focusing on broadening their product portfolios to deliver novel products to consumers.
However, the high cost of brewing supplies and equipment is a major challenge for growth in the global home brewing systems market. Brewing supplies and equipment can cost up to D1,000, which is a significant investment for many consumers. In addition, the time required to brew beer can be a deterrent for some consumers.
A number of influential factors have been identified to stir the soup in the home brewing systems market. Apart from the proliferating aspects prevailing in the market, lead analysts at FMI have also evaluated the restraining factors, lucrative opportunities, and upcoming threats that can pose a hindrance to the progression of the home brewing systems market.
The drivers, restraints, opportunities, and threats (DROTs) identified are as follows:
DRIVERS
RESTRAINTS
OPPORTUNITIES
THREATS
“Rising Popularity of Craft Beer in the US to Push Sales of Home Brewing Equipment”
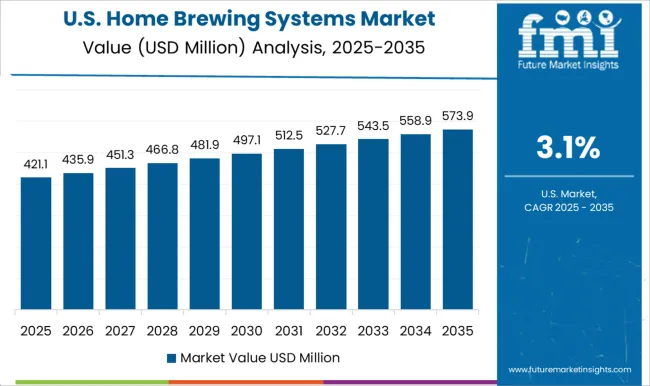
Home brewing is a process that has been around for centuries. In the US, sales of home brewing systems have been positively affected by various factors. One of the most significant factors is the rising popularity of craft beer. As more people become interested in trying out new and different beers, they are also more likely to try their hands at home brewing. This has led to the easy availability of numerous home brewing supplies and kits on the market.
As per the Brewers Association, in 2024, nearly 7.9% of craft beers were sold in the US. alone. The US. craft beer industry reached a valuation of USD 26.8 Billion in the same year and around 6.4% of beer production came from brewpubs. These numbers are projected to grow in the next ten years with rising demand from millennials, which would drive the US home brewing systems market.
Another factor that has had an impact on sales of home brewing systems in the US is changes in laws regarding alcohol production. In 1978, Congress passed a law that made it legal for Americans to brew beer at home for personal consumption. This law opened up the hobby of home brewing to many people who might not have tried it otherwise.
“High Adoption of Pub Culture in India to Spur the Demand for Home Micro Brewing Kits”
In Asia Pacific, India is considered to be one of the most opportunity-rich countries in the world for home brewing systems. The Indian market is expected to grow significantly in the next decade, encouraging international players to enter the industry. Growing adoption of cocktail and pub culture among millennials and the gen Z population in India is set to shift their preferences towards home brewing.
Apart from that, the rising middle-class population in India is set to push the demand for new products and unique flavors owing to their high disposable income. Thus, leading companies are launching premium products like home brewing systems with advanced technology that would provide their clients with a luxurious and unique experience. These factors are anticipated to propel the Indian home brewing systems market in the evaluation period.
“Growing Middle-class Population in China to Propel Sales of Portable Beer Brewing Machines”
In recent years, China has been a top global economic performer. The country’s GDP growth has averaged around 10 percent annually over the past two decades, making it the world’s second-largest economy. This sustained expansion has lifted hundreds of millions of Chinese out of poverty and created a burgeoning middle-class population.
At the same time, China has become an increasingly important player on the global stage, with a rapidly growing trade and investment footprint. These trends are all indicative of China’s emergence as a high-potential market for businesses from around the world.
For companies looking to tap into this vast and increasingly affluent consumer base, understanding the opportunities and challenges posed by China’s unique business environment is critical. Owing to the aforementioned factors, the China home brewing systems market is expected to surge at a rapid pace in the forecast period.
“Consumers are Preferring Automated Homebrew Systems with Novel Features Worldwide”
Based on the mode of operation, the automatic segment is expected to remain at the forefront in the global home brewing systems market during the forecast period. Rising demand for automated home brewing systems equipped with the internet of things (IoT) and new features are projected to drive the segment in the next ten years.
Consumers are nowadays preferring to consume fresh beer at home, which is making them shift towards automated machines that come with advanced features.
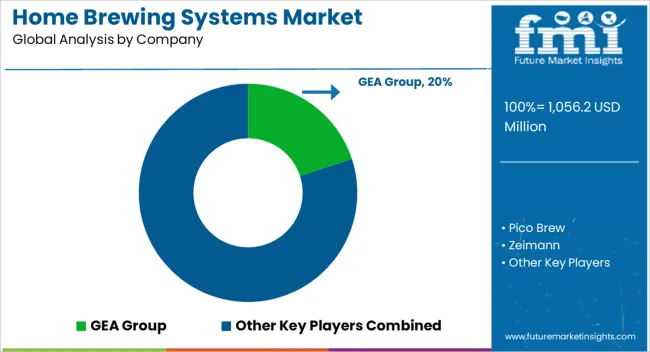
The home brewing systems market is highly competitive with the presence of a large number of players. Some of the key players in the market include Anheuser-Busch InBev, Heineken, and Diageo among others.
These companies have a large share of the global market and are expected to continue to grow at a rapid pace in the next ten years. They are engaging in collaborations and acquisitions with local firms to expand their product portfolios.
The home brewing systems market is also fragmented with many small and regional players. Some of the key regional players include BrewDog, Stone Brewing, and Boston Beer Company. These companies have a strong presence in their respective regions and are expected to grow at a fast pace. They are mainly focusing on new product launches to attract more consumers.
For instance,
| Attribute | Details |
|---|---|
| Estimated Market Size (2025) | USD 1056.2 million |
| Projected Market Valuation (2035) | USD 1519.0 million |
| Value-based CAGR (2025 to 2035) | 3.7% |
| Forecast Period | 2025 to 2035 |
| Historical Data Available for | 2020 to 2025 |
| Market Analysis | Value (USD Million) |
| Key Regions Covered | North America; Latin America; Europe; Asia Pacific; Oceania; Middle East & Africa (MEA) |
| Key Countries Covered | The US, Canada, Mexico, Germany, The UK, France, Italy, Spain, China, Japan, India, South Korea, Australia, Brazil, Argentina, South Africa, UAE |
| Key Segments Covered | Product, Distribution Channel, Mode of Operation, Region |
| Key Companies Profiled | Pico Brew; Zeimann; GEA Group; Brewie; Meura; XIMO; Krones; Lehui; Della Taffola; AlBrew |
| Report Coverage | Market Forecast, Company Share Analysis, Competitive Landscape, DROT Analysis, Market Dynamics and Challenges, and Strategic Growth Initiatives |
The global home brewing systems market is estimated to be valued at USD 1,056.2 million in 2025.
The market size for the home brewing systems market is projected to reach USD 1,519.0 million by 2035.
The home brewing systems market is expected to grow at a 3.7% CAGR between 2025 and 2035.
The key product types in home brewing systems market are full brewer and mini brewer.
In terms of distribution channel, offline segment to command 61.8% share in the home brewing systems market in 2025.


Our Research Products

The "Full Research Suite" delivers actionable market intel, deep dives on markets or technologies, so clients act faster, cut risk, and unlock growth.

The Leaderboard benchmarks and ranks top vendors, classifying them as Established Leaders, Leading Challengers, or Disruptors & Challengers.

Locates where complements amplify value and substitutes erode it, forecasting net impact by horizon

We deliver granular, decision-grade intel: market sizing, 5-year forecasts, pricing, adoption, usage, revenue, and operational KPIs—plus competitor tracking, regulation, and value chains—across 60 countries broadly.

Spot the shifts before they hit your P&L. We track inflection points, adoption curves, pricing moves, and ecosystem plays to show where demand is heading, why it is changing, and what to do next across high-growth markets and disruptive tech

Real-time reads of user behavior. We track shifting priorities, perceptions of today’s and next-gen services, and provider experience, then pace how fast tech moves from trial to adoption, blending buyer, consumer, and channel inputs with social signals (#WhySwitch, #UX).

Partner with our analyst team to build a custom report designed around your business priorities. From analysing market trends to assessing competitors or crafting bespoke datasets, we tailor insights to your needs.
Supplier Intelligence
Discovery & Profiling
Capacity & Footprint
Performance & Risk
Compliance & Governance
Commercial Readiness
Who Supplies Whom
Scorecards & Shortlists
Playbooks & Docs
Category Intelligence
Definition & Scope
Demand & Use Cases
Cost Drivers
Market Structure
Supply Chain Map
Trade & Policy
Operating Norms
Deliverables
Buyer Intelligence
Account Basics
Spend & Scope
Procurement Model
Vendor Requirements
Terms & Policies
Entry Strategy
Pain Points & Triggers
Outputs
Pricing Analysis
Benchmarks
Trends
Should-Cost
Indexation
Landed Cost
Commercial Terms
Deliverables
Brand Analysis
Positioning & Value Prop
Share & Presence
Customer Evidence
Go-to-Market
Digital & Reputation
Compliance & Trust
KPIs & Gaps
Outputs
Full Research Suite comprises of:
Market outlook & trends analysis
Interviews & case studies
Strategic recommendations
Vendor profiles & capabilities analysis
5-year forecasts
8 regions and 60+ country-level data splits
Market segment data splits
12 months of continuous data updates
DELIVERED AS:
PDF EXCEL ONLINE
Home Beer Brewing Machine Market Analysis & Forecast 2025-2035
Home Dialysis Systems Market Size and Share Forecast Outlook 2025 to 2035
Home Energy Management Systems Market Size and Share Forecast Outlook 2025 to 2035
Remote Home Monitoring Systems Market Size and Share Forecast Outlook 2025 to 2035
Home Sleep Screening Device Market Size and Share Forecast Outlook 2025 to 2035
Home Healthcare Software Industry Analysis in North America Size and Share Forecast Outlook 2025 to 2035
Home Decor Market Size and Share Forecast Outlook 2025 to 2035
Home Automation Sensors Market Size and Share Forecast Outlook 2025 to 2035
Home Standby Gensets Market Size and Share Forecast Outlook 2025 to 2035
Home Scales Market Size and Share Forecast Outlook 2025 to 2035
Home Gym Equipment Market Size and Share Forecast Outlook 2025 to 2035
Home Brew Boiler Market Size and Share Forecast Outlook 2025 to 2035
Homeland Security Market Size and Share Forecast Outlook 2025 to 2035
Home Wi-Fi Security Solutions Market Size and Share Forecast Outlook 2025 to 2035
Systems Administration Management Tools Market Size and Share Forecast Outlook 2025 to 2035
Home Security Drone Market Size and Share Forecast Outlook 2025 to 2035
Home Infusion Therapy Devices Market Analysis - Size, Share, and Forecast Outlook 2025 to 2035
Home Healthcare Market Analysis - Size, Share, and Forecast Outlook 2025 to 2035
Homeopathic Products Market Analysis - Size, Share, & Forecast Outlook 2025 to 2035
Home Care Services Market Size, Growth, and Forecast 2025 to 2035

Thank you!
You will receive an email from our Business Development Manager. Please be sure to check your SPAM/JUNK folder too.
Chat With
MaRIA