The Home Automation Sensors Market is estimated to be valued at USD 155.6 billion in 2025 and is projected to reach USD 672.9 billion by 2035, registering a compound annual growth rate (CAGR) of 15.8% over the forecast period.
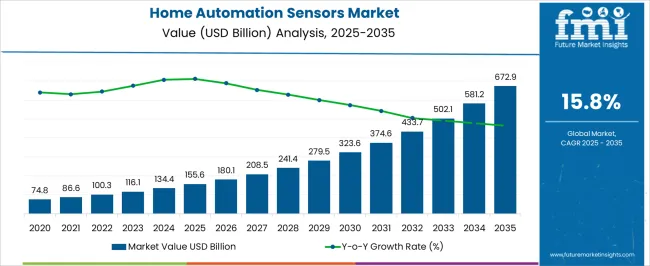
| Metric | Value |
|---|---|
| Home Automation Sensors Market Estimated Value in (2025 E) | USD 155.6 billion |
| Home Automation Sensors Market Forecast Value in (2035 F) | USD 672.9 billion |
| Forecast CAGR (2025 to 2035) | 15.8% |
The future outlook for the market is promising as more homeowners embrace energy management tools and IoT-enabled platforms for improved comfort and cost savings. Government initiatives promoting energy efficiency, coupled with rising disposable incomes, have further encouraged the use of smart home solutions.
The ability to remotely monitor and control home environments using smartphones and voice-controlled systems is also contributing to market growth As awareness about smart living solutions continues to expand, the Home Automation Sensors market is expected to experience sustained demand, with advanced sensing technologies playing a crucial role in creating adaptive and responsive living spaces.
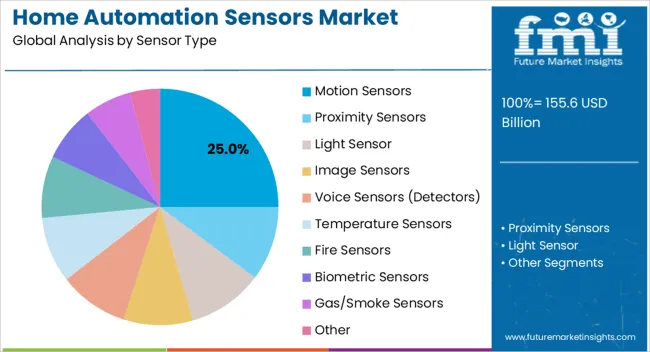
The Motion Sensors segment is projected to account for 25.00% of the total revenue share in the Home Automation Sensors market in 2025, making it one of the leading sensor types. This growth has been supported by the rising need for automated security systems and energy-saving solutions. Motion sensors are increasingly being integrated into home security setups, enabling real-time alerts and automated lighting controls that improve safety and reduce unnecessary energy consumption.
The ability to detect occupancy and movement within living spaces has been leveraged in both high-end and budget home automation systems. The segment’s growth has also been reinforced by the expanding use of voice-controlled devices and smartphone-enabled monitoring platforms, which rely on motion detection for activating functions.
Furthermore, the growing demand for seamless home experiences and energy management solutions has prompted manufacturers to develop compact and highly sensitive motion sensors that can be easily installed without complex wiring These factors have collectively contributed to the prominence of this segment in the market.
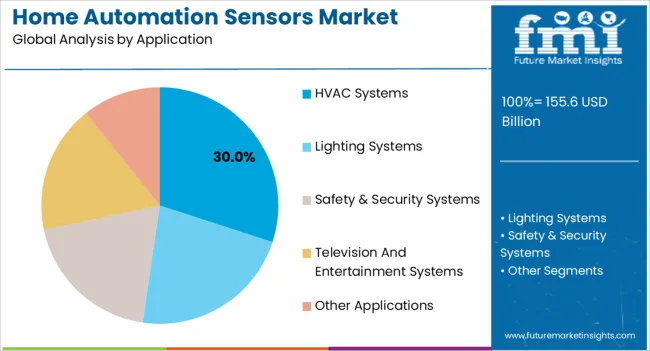
The HVAC Systems application segment is expected to represent 30.00% of the overall revenue share in the Home Automation Sensors market in 2025, establishing it as the largest application segment. This dominance has been driven by the increasing focus on energy efficiency and comfort within residential spaces. HVAC systems that integrate smart sensors are able to regulate temperature and airflow based on occupancy patterns, environmental conditions, and user preferences, which significantly reduces energy consumption.
The segment’s growth has been encouraged by rising electricity costs and growing awareness about sustainable living solutions. Additionally, homeowners are seeking systems that offer remote control and automated scheduling, allowing for optimized heating and cooling throughout the day. The use of sensors to manage indoor air quality has further supported adoption, especially in urban areas where environmental concerns are prominent.
As governments and utility providers promote energy-efficient solutions, HVAC systems powered by smart sensors are becoming a preferred option for consumers seeking comfort without compromising on cost or sustainability These factors are expected to reinforce the continued expansion of this application segment.
Abundant disposable incomes coupled with growing living standards among the urban class is estimated to be the key factor spurring the growth of the global market. The key growth drivers for this demand are increasing consumer awareness and financial capacity, product innovations (like smartphone apps), builders’ requirement for market differentiation, and an increase in the preference for energy-efficient systems.
The automation sensors market is growing due to government support and initiatives, high demand for industrial mechanization for large-scale production, and a compulsive reiteration to reduce operational costs. Product lifecycle management and enterprise-level solutions are gaining high demand across the globe.
However, the market is still in its growth phase with a significant gap in waiting for more innovative and connected systems. With industry 4.0 making it felt across the manufacturing sector, one of the initiatives includes smart cities to accelerate the progression of the digital economy. Hence, such developments are expected to drive the growth of the industrial automation sensors market.
| Attributes | Details |
|---|---|
| Home Automation Sensors Market CAGR (2025 to 2035) | 16.6% |
| Home Automation Sensors Market Size (2025) | USD 114,444.1 million |
| Home Automation Sensors Market Size (2035) | USD 533,117.7 million |
The global market expanded at a significant rate from USD 59,798.5 million in 2020 to USD 59,798.5 million in 2025. From 2020 to 2025, sales experienced significant growth, registering a CAGR of 14.5%.
Home automation is the utilization of intelligent terminals to control home appliances and equipment. It includes but is not limited to centralized control of lighting, security checks/locks for home access, HVAC control, and others. Home automation is also known as smart home automation, which is an automation system, which offers access to control appliances and devices such as lights, fans, alarm systems, heating & cooling systems, and electrical outlets with a smartphone.
There are various systems available in the open market, which incorporate different sensors or combinations of sensors to perform certain functions. The control technology of each system is a function of the product and varies from product to product.
The residential segment accounts for more than half of India’s home automation industry (out of which individual homes and villas account for the primary share of the market). This segment has the leading growth and is currently growing at a high CAGR in the range of 40 to 50 %. The market for residential home automation is highly fragmented, especially in home security systems.
Commercial spaces contribute to a reasonable market segment in home automation. This segment is largely driven by security and access systems. Large companies like Samsung, Bosch, and Honeywell dominate this segment in India. Efficient building management systems are fast gaining popularity in India as well.
The hospitality industry also uses home automation and accounts for 10-15 % of the market. Security and lighting systems are popular in this sector due to the growing need for differentiation. Lighting accessories that are visually appealing are also the reason for the growth of the industry in this sector.
The market restraints include the high cost of deployment of sensors in the home-based equipment calls for a lot of technical acumen which also increases the cost of the home automation sensors business. Also, systems embedded with sensors require high maintenance and suitable environmental conditions in order to work effectively.
Also since the embedded sensors have to be connected to a CU to answer commands, which in turn are controlled by a central cloud server, it gives access to undesirable elements to hack the system which leaves the security of the house vulnerable to security glitches. Also, a moderate level of satisfaction amongst consumers is the reason for the limited growth of the home automation sensors market.
The global home automation sensors industry is segmented on the basis of sensor type and by application mainly. By sensor type, the global market is segmented as motion sensors, proximity sensors, light sensors, image sensors, voice sensors (detectors), temperature sensors, fire sensors, biometric sensors, gas/smoke sensors, and others.
On the basis of application, the global market is segmented as the HVAC system, lighting system, safety & security system, television and entertainment systems, and others.
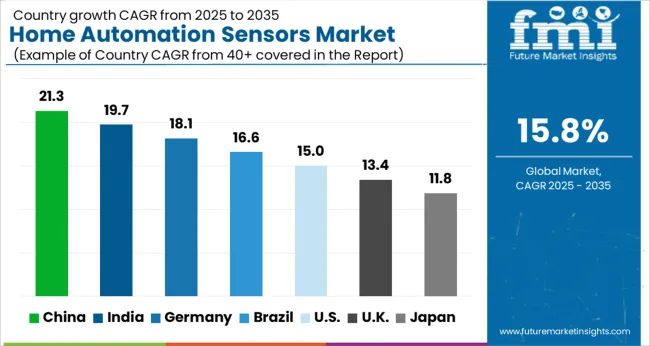
| Countries | Market Share (2025) |
|---|---|
| United States | 18.2% |
| Germany | 9.4% |
| Australia | 2.6% |
| Japan | 5.3% |
North America's market share value in the industry in the year 2025 is expected to amount to 28.1%. In terms of geography, North America is dominant in the market owing to the high per capita income and high living standards of the citizens. The North American region holds the key share of the home automation market and is expected to continue dominating the market during the forecast period.
This is attributed to factors such as people of this region increasingly gravitating towards the concept of smart homes, with United States households, projected to include smart home technology in the future, running into millions.
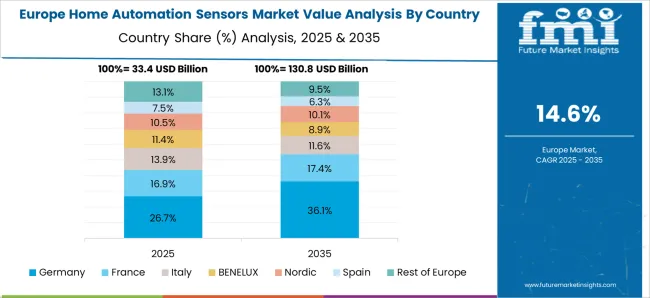
According to Future Market Insights, the European market held 24.3% of the global market in 2025. Smart homes use connected devices and appliances to perform actions, tasks, and automated routines to save money, time, and energy.
Home automation systems allow for the integration of various smart devices and appliances controlled through a centralized system. The convenience provided by smart home products and services lets smart home inhabitants live a more comfortable existence. The most basic and prominent smart house feature is climate control.
The capacity to remotely regulate or automatically schedule house components such as thermostats, ventilators, lighting equipment, kitchen appliances, and different domestic appliances is included in climate control. It reduces repetitive menial tasks, providing house occupants with comfort. Smart home safety services help people monitor their house's security and prevent accidents.
Instances of burglary are a significant motivator of security device adoption. Security cameras, door locks, motion sensors, and smoke sensors are examples of smart home security devices that are digitally connected and operated for burglar prevention and other security concerns.
The changing entertainment quotient and growing inclination toward luxurious entertainment systems such as home theaters have spurred the market for diverse entertainment controls, without moving a limb.
Based on sensor type, the industrial automation sensors market is segmented into level sensors, temperature sensors, flow sensors, gas sensors, position sensors, pressure sensors, force sensors, humidity & moisture sensors, and image sensors.
Motion sensors dominated the market with a share of 13.4% in 2025. Moreover, the gas sensor segment is expected to expand at the leading CAGR during the forecast period.
The growth of this segment is attributed to the ability to detect gas leakages in applications across manufacturing industries. Gas sensors monitor gas pressures and environmental information to guarantee production safety across feeble areas of production facilities.
How key Players are opening Frontiers for Future Growth?
Manufacturers are adopting various marketing strategies such as new product launches, geographical expansion, mergers and acquisitions, partnerships, and collaboration to identify the interest of potential buyers and create a larger customer base.
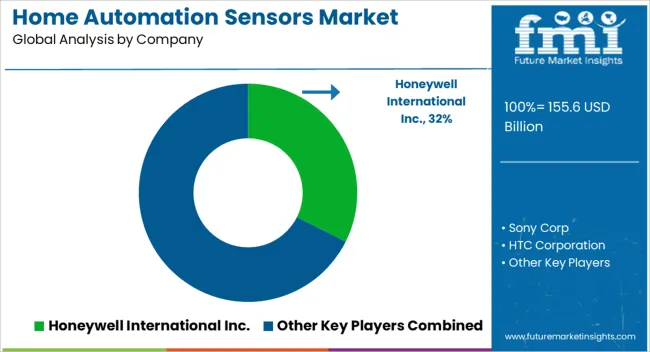
Who are the Leading Players in the Home Automation Sensors Market?
Overall, the market is highly fragmented, largely due to the low entry barriers. The availability of open-source technologies makes it easy to enter the market. Innovation is the driving force of the industry and the market is evolving fast both in terms of technology and features (mobile apps etc.).
In India, the home automation market is expected to grow significantly over the next few years and witness growth both in terms of the number of players and technologies offered.
The global home automation sensors market is estimated to be valued at USD 155.6 billion in 2025.
The market size for the home automation sensors market is projected to reach USD 672.9 billion by 2035.
The home automation sensors market is expected to grow at a 15.8% CAGR between 2025 and 2035.
The key product types in home automation sensors market are motion sensors, proximity sensors, light sensor, image sensors, voice sensors (detectors), temperature sensors, fire sensors, biometric sensors, gas/smoke sensors and other.
In terms of application, hvac systems segment to command 30.0% share in the home automation sensors market in 2025.


Our Research Products

The "Full Research Suite" delivers actionable market intel, deep dives on markets or technologies, so clients act faster, cut risk, and unlock growth.

The Leaderboard benchmarks and ranks top vendors, classifying them as Established Leaders, Leading Challengers, or Disruptors & Challengers.

Locates where complements amplify value and substitutes erode it, forecasting net impact by horizon

We deliver granular, decision-grade intel: market sizing, 5-year forecasts, pricing, adoption, usage, revenue, and operational KPIs—plus competitor tracking, regulation, and value chains—across 60 countries broadly.

Spot the shifts before they hit your P&L. We track inflection points, adoption curves, pricing moves, and ecosystem plays to show where demand is heading, why it is changing, and what to do next across high-growth markets and disruptive tech

Real-time reads of user behavior. We track shifting priorities, perceptions of today’s and next-gen services, and provider experience, then pace how fast tech moves from trial to adoption, blending buyer, consumer, and channel inputs with social signals (#WhySwitch, #UX).

Partner with our analyst team to build a custom report designed around your business priorities. From analysing market trends to assessing competitors or crafting bespoke datasets, we tailor insights to your needs.
Supplier Intelligence
Discovery & Profiling
Capacity & Footprint
Performance & Risk
Compliance & Governance
Commercial Readiness
Who Supplies Whom
Scorecards & Shortlists
Playbooks & Docs
Category Intelligence
Definition & Scope
Demand & Use Cases
Cost Drivers
Market Structure
Supply Chain Map
Trade & Policy
Operating Norms
Deliverables
Buyer Intelligence
Account Basics
Spend & Scope
Procurement Model
Vendor Requirements
Terms & Policies
Entry Strategy
Pain Points & Triggers
Outputs
Pricing Analysis
Benchmarks
Trends
Should-Cost
Indexation
Landed Cost
Commercial Terms
Deliverables
Brand Analysis
Positioning & Value Prop
Share & Presence
Customer Evidence
Go-to-Market
Digital & Reputation
Compliance & Trust
KPIs & Gaps
Outputs
Full Research Suite comprises of:
Market outlook & trends analysis
Interviews & case studies
Strategic recommendations
Vendor profiles & capabilities analysis
5-year forecasts
8 regions and 60+ country-level data splits
Market segment data splits
12 months of continuous data updates
DELIVERED AS:
PDF EXCEL ONLINE
Home Automation Market Analysis by Product, Application, Networking Technology, and Region Through 2035
Home Security Sensors Market Analysis by Application, Product, and Region through 2035
Smart Home Automation Technology Market Size and Share Forecast Outlook 2025 to 2035
Smart Home Automation Market Size and Share Forecast Outlook 2025 to 2035
Smart Home Automation in India – IoT & AI-Driven Growth
Smart Home Water Sensors & Controllers Market Trends & Forecast 2025 to 2035
PM2.5 Sensors for Home Appliances Market Size and Share Forecast Outlook 2025 to 2035
Home Sleep Screening Device Market Size and Share Forecast Outlook 2025 to 2035
Home Healthcare Software Industry Analysis in North America Size and Share Forecast Outlook 2025 to 2035
Home Decor Market Size and Share Forecast Outlook 2025 to 2035
Home Energy Management Systems Market Size and Share Forecast Outlook 2025 to 2035
Home Dialysis Systems Market Size and Share Forecast Outlook 2025 to 2035
Home Standby Gensets Market Size and Share Forecast Outlook 2025 to 2035
Home Scales Market Size and Share Forecast Outlook 2025 to 2035
Home Gym Equipment Market Size and Share Forecast Outlook 2025 to 2035
Home Brewing Systems Market Size and Share Forecast Outlook 2025 to 2035
Home Brew Boiler Market Size and Share Forecast Outlook 2025 to 2035
Homeland Security Market Size and Share Forecast Outlook 2025 to 2035
Automation Testing Market Size and Share Forecast Outlook 2025 to 2035
Home Wi-Fi Security Solutions Market Size and Share Forecast Outlook 2025 to 2035

Thank you!
You will receive an email from our Business Development Manager. Please be sure to check your SPAM/JUNK folder too.
Chat With
MaRIA