United States Dialysis Equipment Market Size and Share Forecast Outlook From 2024 to 2034

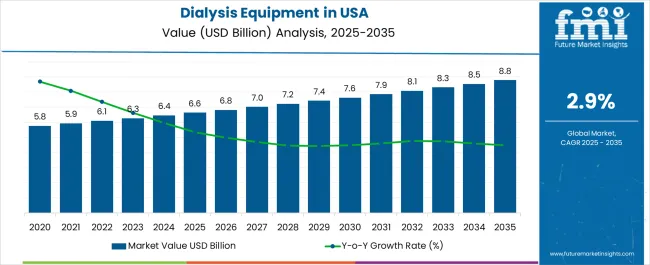
The United States Dialysis Equipment business size is expected to expand from USD 6,495.4 million in 2024 to USD 8,690.2 million by 2034. Demand for dialysis equipment in the United States is anticipated to grow at a CAGR of 3.0%. In 2023, the United States dialysis equipment business revenue totaled USD 6,252.5 million, and it is set to increase at a Y-o-Y growth of 3.5% in 2024.

United States Dialysis Equipment Industry Outlook

Attributes Key Insights
United States Dialysis Equipment Business Value in 2023 USD 6,252.5 million
Estimated Value in 2024 USD 6,495.4 million
Projected Value in 2034 USD 8,690.2 million
Value CAGR (2024 to 2034) 3.0%

The trend toward home-based dialysis and expansion of telemedicine & remote monitoring technologies represents a transformative shift in renal care. This is expected to persist and expand and will play a key role in fostering growth of the dialysis equipment in the United States.

Home-based dialysis, such as peritoneal dialysis and home hemodialysis, provides numerous advantages. These include enhanced patient convenience, improved quality of life, and a reduced burden on healthcare facilities.

Rising demand for dialysis equipment that is user-friendly and capable of supporting remote treatment is set to boost sales. To benefit from this, companies will look to introduce novel home-based dialysis systems with enhanced features.

Growing government initiatives to support manufacturers as well as end users for dialysis are expected to boost sales growth. Subsequently, favorable reimbursement policies are predicted to make the United States a highly lucrative pocket for dialysis equipment companies.

The United States government is establishing guidelines for dialysis with the aim of better accessibility of dialysis, which can be undertaken in home settings. This is especially beneficial for patients in rural areas who have to incur additional costs traveling to dialysis centers in faraway places.

Key Insights into the United States Dialysis Equipment Industry Landscape

Revenue to Expand Over 1.3X in the United States through 2034

Revenue in the United is predicted to expand over 1.3X through 2033, amid a 0.5% increase in anticipated CAGR compared to the historical one. This is due to rising incidence of kidney diseases and rising demand for advanced dialysis treatments.

Other Factors and Trends in the United States Dialysis Equipment Business Shaping Growth include:

  • Rising cases of chronic kidney disease (CKD) and end-stage renal diseases (ESRD)
  • Shift toward home-based dialysis
  • Rising popularity of continuous ambulatory peritoneal dialysis
  • Continuous advancements in renal care devices
  • Development of wearable and portable dialysis devices
  • Increasing adoption of home hemodialysis machines
  • Favorable government initiatives and policies

Sales Trend Analysis from Historical Performance Compared to Dialysis Equipment Demand Outlook in the United States

Sales of dialysis equipment in the United States recorded a CAGR of 2.5% from 2019 to 2023. Total valuation at the end of 2023 reached about USD 6,252.5 million. Over the forecast period, the United States dialysis equipment business is set to thrive at 3.0% CAGR.

Historical CAGR (2019 to 2023) 2.5%
Forecast CAGR (2024 to 2034) 3.0%

Growing demand for dialysis amid increasing cases of kidney diseases, including CKD and ESRD, is expected to boost the dialysis equipment business. Dialysis systems are increasingly used in blood purification and the removal of extra fluid.

The United government strives to provide easy access to treatments for kidney patients. It is investing vast amounts in upgrading hospital infrastructure and technologies. This is expected to create growth prospects for dialysis equipment manufacturers.

Companies and researchers are trying to introduce novel dialysis systems with enhanced features. For instance, they are focusing on developing wearable dialysis machines that are convenient to use and free patients from the otherwise huge machines that keep them tied down.

Several companies in the United States are developing different types of wearable kidneys. These include devices for hemodialysis and peritoneal dialysis and one machine that combines both hemodialysis and peritoneal dialysis.

The new devices weigh less and have small parts fitted with long-lasting batteries and filters that can reuse dialysate without needing a lot of purified water. These advances make it possible for people to wear a dialysis device that isn’t very heavy and can be worn under clothing.

Key Drivers Accelerating Dialysis Equipment Adoption Across the United States

Manufacturers see an opportunity to connect symptoms and treatment algorithms. This is because they focus on the Advancing American Kidney Health Initiative’s goal of placing new dialysis patients on home dialysis in the coming years.

With government-supported programs like KidneyX, manufacturers see redesigning dialysis machines and connective health as ways to make treatments easier for patients and to provide useful data to clinicians. This will help them to boost their revenue and solidify their positions.

Healthcare organizations in the United States are taking several initiatives to reduce the burden of kidney diseases. For instance, in July 2020, HHS and ASN formed the KidneyX Innovation Accelerator (KidneyX). This partnership aims to disrupt the status quo and offer new hope to millions worldwide with kidney diseases. Such developments are expected to foster growth.

Growing prevalence of chronic diseases is prompting manufacturers to develop innovative dialysis products to meet customers’ demands. Thus, growing research and innovation of new products will offer lucrative opportunities for dialysis equipment manufacturers through 2034.

Overview of Restrictive Factors for the Dialysis Equipment Business

Kidney transplantation is one of the alternate treatment options for patients suffering from end-stage renal kidney disease. The better treatment outcomes associated with kidney transplants and affordability of the procedure, owing to the favorable reimbursement policies, are projected to impede the growth of the dialysis equipment business during the forecast period.

Patients diagnosed with ESRD prefer kidney transplantation over renal infusion owing to the long-term benefits associated with the procedure. Thus, growing preference for alternate treatment options over dialysis is expected to hamper the business’s growth in the coming years.

The need for frequent treatments makes dialysis a high-cost procedure that imposes a financial burden on patients. This may lower the adoption of the treatment.

Analysis of Top Regions Utilizing Dialysis Equipment in the United States

The table below highlights the anticipated growth rates of different regions in the United States. Among these, Midwest and Southwest regions are set to register higher with CAGRs of 4.9% and 4.1%, respectively.

Regions Value-based CAGR
Northeast United States 3.2%
Midwest United States 4.9%
Southeast United States 1.8%
Southwest United States 4.1%
West United States 2.5%

Rising Prevalence of CKD Driving Demand in Southeast United States

The Southeast United States dominates the target business with a 34.5% value share in 2023. Over the forecast period, demand for dialysis equipment in the Southeast United States is predicted to rise at 1.8% CAGR.

Rising prevalence of chronic kidney diseases (CKD) is a prominent factor expected to drive dialysis equipment demand in the Southeast United States. As the number of patients requiring dialysis increases, so does the need for advanced and efficient equipment.

The Southeast United States is also witnessing increased investments in healthcare infrastructure, including dialysis centers and hospitals. Infrastructure development can support the integration of the latest dialysis equipment and technologies. This will likely boost sales of dialysis equipment in the region.

High Adoption of Portable Equipment Boosting Sales in the West United States

The West United States is expected to hold a value share of 23.0% in 2023. It will attain a valuation of USD 1,913.6 million in 2033, with dialysis equipment sales growing at 2.5% CAGR throughout the assessment period.

Multiple factors are expected to drive sales growth in the West United States. These include rising popularity of home healthcare and growing adoption of portable dialysis equipment.

Integrating telehealth solutions in the West United States for remote monitoring and management of dialysis patients could present opportunities for manufacturers. Collaborations with healthcare providers, research institutions, and other stakeholders can foster innovation and the development of tailored solutions that meet regional needs.

Dialysis Equipment Industry Analysis by Top Investment Segments in the United States

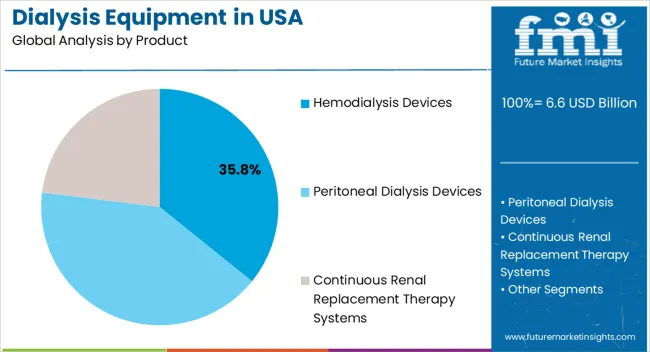
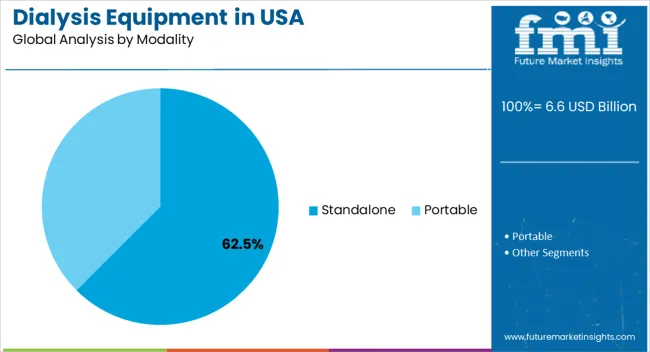
The below section highlights the estimated CAGR of key segments. The hemodialysis devices segment is projected to lead the target business through 2034, exhibiting a CAGR of 2.7%. The standalone dialysis equipment segment is predicted to generate significant revenue, registering a CAGR of 2.8%.

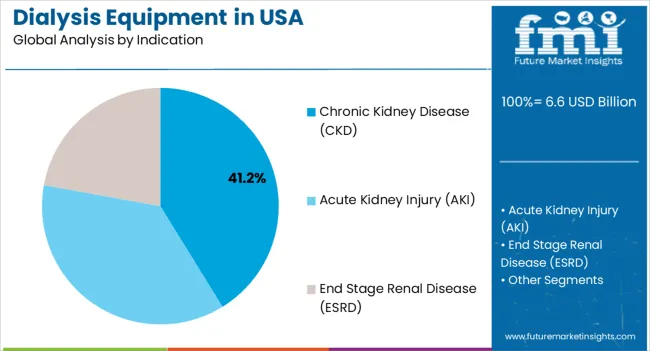
By indication, the ESRD segment is set to hold a dominant value share, thriving at 2.0% CAGR through 2034. Hospitals are expected to remain leading end users of dialysis equipment across the United States. The target segment will likely grow at a CAGR of 1.6% through 2034.

Hemodialysis Devices Remain Highly Sought-after Products in the United States

Growth Outlook by Key Product

Product Value CAGR
Hemodialysis Devices 2.7%
Peritoneal Dialysis Devices 4.7%
Continuous Renal Replacement Therapy Systems 2.1%

As per the latest analysis, demand for hemodialysis devices in the United States remains high. The target segment is estimated to thrive at 2.7% CAGR during the assessment period, holding a revenue share of 87.7% in 2023.

Growing popularity of hemodialysis is a prominent factor driving demand for hemodialysis systems in the United States. Similarly, rising demand for in-center hemodialysis machines and home hemodialysis machines will likely foster segment growth.

Hemodialysis has long been established as a primary method for treating ESRD, and the use of hemodialysis devices is integral to this treatment process. They are used to remove waste products and excess fluid from the blood.

Hemodialysis systems are designed to ensure clinical efficiency and patient safety during dialysis procedures. Their features, such as precise monitoring capabilities and safety mechanisms, contribute to improved treatment outcomes and patient well-being.

Peritoneal dialysis devices segment, on the other hand, is set to witness a higher CAGR of 4.7% through 2034. This is attributable to rising adoption of peritoneal dialysis equipment in the United States thriving healthcare sector.

Rising Cases of ESDR Making the United States a Lucrative Pocket for Companies

Growth Outlook by Key Indication

Indication Value CAGR
Acute Kidney Injury (AKI) 4.5%
Chronic Kidney Disease (CKD) 3.3%
End Stage Renal Disease (ESRD) 2.0%

Based on indication, the ESRD segment is expected to generate significant revenue-generation opportunities for dialysis equipment manufacturers. This is attributable to rising prevalence of ESRD in the United States, along with growing need for effective treatments like dialysis for this condition.

The end stage renal disease (ESRD) segment is poised to exhibit a CAGR of 2.0% during the forecast period. It will likely total USD 3,696.7 million in 2034.

The increasing prevalence of ESRD in the United States is a primary factor driving demand for dialysis equipment. Factors such as the aging population, rising incidences of diabetes and hypertension, and lifestyle-related diseases are contributing to the growing number of patients requiring dialysis treatment for ESRD.

Healthcare providers and dialysis equipment manufacturers have been increasingly focused on improving patient outcomes and improving individuals' quality of life with ESRD. This emphasis has led to the development of advanced and specialized dialysis equipment that can cater to the specific needs and preferences of patients undergoing dialysis treatment for ESRD.

Standalone Dialysis Systems to Generate Significant Revenue in the United States

Growth Outlook by Key Modality

Modality Value CAGR
Portable 4.1%
Standalone 2.8%

As per the latest analysis, standalone dialysis equipment segment is projected to generate significant revenue in the United States. It is expected to thrive at 2.8% CAGR during the assessment period, holding a revenue share of 89.0% in 2024.

Several factors are making standalone systems a top revenue-generating modality segment across the United States. These include rising demand for sophisticated dialysis equipment from hospitals and clinics and innovations in standalone dialysis systems.

Standalone dialysis equipment are more powerful than portable ones. They can provide more effective treatments for patients with severe kidney failure. As a result, they are widely used in hospitals and dialysis clinic settings.

Hospitals Remain Leading End Users of Dialysis Equipment

Growth Outlook by Key End User

End User Value CAGR
Hospitals 1.6%
Clinics & Dialysis Centers 3.4%
Ambulatory Surgical Centers 2.1%
Home Care Settings 4.5%

The hospitals segment dominates the United States dialysis equipment business, holding around 36.0% value share in 2024. It will likely thrive at 1.6% CAGR, totaling USD 2,730.0 million by 2034.

Rising patient inclination toward opting for dialysis treatments in hospitals due to presence of advanced technologies is expected to boost the target segment. Similarly, increasing number of hospitals offering dialysis services will foster segment growth.

Hospitals are well equipped to manage and treat co-existing health conditions that may be present alongside the need for dialysis treatment. This allows for a comprehensive approach to patient care and the coordination of treatment plans.

Hospitals are capable of providing emergency dialysis services to patients requiring immediate intervention or critical care. This makes them a vital end-user segment for the delivery of urgent dialysis treatment. Growing adoption of advanced kidney dialysis machines in hospital sector will foster segment growth.
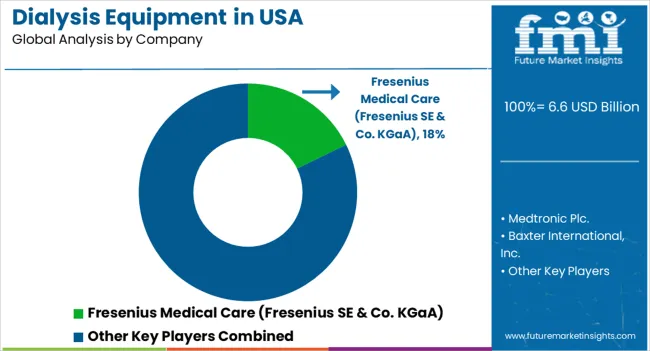
Leading Suppliers in the United States Dialysis Equipment Market

Top manufacturers of dialysis equipment in the United States are focusing on developing technologically advanced solutions with enhanced features. They are also expanding their footprint by adopting strategies like partnerships, acquisitions, mergers, and alliances.

Recent Developments in the United States Dialysis Equipment Business

  • In April 2023, Medtronic plc and DaVita Inc. announced the launch of Mozarc Medica, an independent new company committed to reshaping kidney health and driving patient-centered technology solutions.
  • In June 2021, Quanta Dialysis Technologies raised USD 245 million in an oversubscribed and upsized Series D round, the largest private funding round for a dialysis device company in history.

Key Shifting Preferences Covered in the United States Dialysis Equipment Market Report

Attribute Details
Estimated Size (2024) USD 6,495.4 million
Projected Value (2034) USD 8,690.2 million
Anticipated Growth Rate (2024 to 2034) 3.0% CAGR
Forecast Period 2024 to 2034
Historical Data Available for 2019 to 2023
Industry Analysis USD Million for Value
Key Regions Covered Northeast, Midwest, Southeast, Southwest, and West
Key States Covered New York, New Jersey, Massachusetts, Minnesota, Wisconsin, North Carolina, South Carolina, Florida, Virginia, Louisiana, Oklahoma, Texas, Washington, California, and New Mexico
Key Segments Covered Product, Indication, modality, End User, and Region
Key Companies Profiled Medtronic Plc.; Baxter International, Inc.; B. Braun Melsungen AG; Asahi Kasei Corporation; Fresenius Medical Care (Fresenius SE & Co. KGaA); Nipro Corporation; Toray Medical Co. Ltd. (Toray Industries, Inc.); Allmed Medical Care; Dialife S.A; ESCO Medicon; Quanta Dialysis Technologies; Nikkiso Co.,Ltd.; JMS Co. Ltd.; NxStage Medical, Inc.; NephroCan Holdings Corporation; Advin Urology
Report Coverage Business Forecast, Competition Intelligence, DROT Analysis, Key Dynamics and Challenges, Strategic Growth Initiatives

Top Segments Studied in the United States Dialysis Equipment Market Report

By Product:

  • Hemodialysis Devices
    • Hemodialysis Machines
    • Dialyzers and Filters
    • Vascular access devices
  • Peritoneal Dialysis Devices
    • Automated peritoneal dialysis Machine
    • Dialyzers and Filters
    • Vascular access devices
  • Continuous Renal Replacement Therapy Systems

By Indication:

  • Acute Kidney Injury (AKI)
  • Chronic Kidney Disease (CKD)
  • End Stage Renal Disease (ESRD)

By Modality:

  • Portable
  • Standalone

By End User:

  • Hospitals
  • Clinics & Dialysis Centers
  • Ambulatory Surgical Centers
  • Home Care Settings

By Region:

  • Northeast
  • Midwest
  • Southeast
  • Southwest
  • West

Table of Content

  • 1. Executive Summary
  • 2. Business Overview
  • 3. Key Trends
  • 4. Value Added Insights
  • 5. Business Background
  • 6. Demand Volume (Units) Analysis 2019 to 2023 and Forecast 2024 to 2034
  • 7. Demand Pricing Analysis
  • 8. Demand (in Value or Size in USD Million) Analysis 2019 to 2023 and Forecast 2024 to 2034
  • 9. Industry Analysis 2019 to 2023 and Forecast 2024 to 2034, By Product
    • 9.1. Hemodialysis Devices
      • 9.1.1. Hemodialysis Machines
      • 9.1.2. Dialyzers and Filters
      • 9.1.3. Vascular access devices
    • 9.2. Peritoneal Dialysis Devices
      • 9.2.1. Automated peritoneal dialysis Machine
      • 9.2.2. Dialyzers and Filters
      • 9.2.3. Vascular access devices
    • 9.3. Continuous Renal Replacement Therapy Systems
  • 10. Industry Analysis 2019 to 2023 and Forecast 2024 to 2034, By Modality
    • 10.1. Portable Dialysis Systems
    • 10.2. Standalone Dialysis Systems
  • 11. Industry Analysis 2019 to 2023 and Forecast 2024 to 2034, By Indication
    • 11.1. Chronic Kidney Disease (CKD)
    • 11.2. Acute Kidney Injury (AKI)
    • 11.3. End Stage Renal Disease (ESRD)
  • 12. Industry Analysis 2019 to 2023 and Forecast 2024 to 2034, By End User
    • 12.1. Hospital
    • 12.2. Clinics & Dialysis Centers
    • 12.3. Ambulatory Surgical Centers
    • 12.4. Home Care Setting
  • 13. Industry Analysis 2019 to 2023 and Forecast 2024 to 2034, By Region
    • 13.1. Northeast
    • 13.2. Midwest
    • 13.3. Southeast
    • 13.4. Southwest
    • 13.5. West
  • 14. Northeast Industry Analysis 2019 to 2023 and Forecast 2024 to 2034
  • 15. Midwest Industry Analysis 2019 to 2023 and Forecast 2024 to 2034
  • 16. Southeast Industry Analysis 2019 to 2023 and Forecast 2024 to 2034
  • 17. Southwest Industry Analysis 2019 to 2023 and Forecast 2024 to 2034
  • 18. West Industry Analysis 2019 to 2023 and Forecast 2024 to 2034
  • 19. Business Structure Analysis
  • 20. Competition Analysis
    • 20.1. Medtronic Plc.
    • 20.2. Baxter International, Inc.
    • 20.3. B. Braun Melsungen AG
    • 20.4. Asahi Kasei Corporation
    • 20.5. Fresenius Medical Care (Fresenius SE & Co. KGaA)
    • 20.6. Nipro Corporation
    • 20.7. Toray Medical Co. Ltd. (Toray Industries, Inc.)
    • 20.8. Allmed Medical Care
    • 20.9. Dialife S.A
    • 20.10. ESCO Medicon
    • 20.11. Quanta Dialysis Technologies
    • 20.12. Nikkiso Co., Ltd.
    • 20.13. JMS Co. Ltd.
    • 20.14. NxStage Medical, Inc.
    • 20.15. NephroCan Holdings Corporation
    • 20.16. Advin Urology
  • 21. Assumptions and Acronyms Used
  • 22. Research Methodology

List of Tables

Table 01: Pricing Analysis (US$), 2024

Table 02: Business Size (US$ Million) Analysis 2019 to 2023 and Forecast 2024 to 2034, By Product

Table 03: Business Volume (Units) Analysis 2019 to 2023 and Forecast 2024 to 2034, By Product

Table 04: Business Volume (Units) Analysis 2019 to 2023 and Forecast 2024 to 2034, By Product

Table 05: Business Size (US$ Million) Analysis 2019 to 2023 and Forecast 2024 to 2034, By Modality

Table 06: Business Size (US$ Million) Analysis 2019 to 2023 and Forecast 2024 to 2034, By Indication

Table 07: Business Size (US$ Million) Analysis 2019 to 2023 and Forecast 2024 to 2034, By End User

Table 08: Business Size (US$ Million) Analysis 2019 to 2023 and Forecast 2024 to 2034, By Region

Table 09: Northeast Business Size (US$ Million) Analysis 2019 to 2023 and Forecast 2024 to 2034, By States

Table 10: Northeast Business Size (US$ Million) Analysis 2019 to 2023 and Forecast 2024 to 2034, By Product

Table 11: Northeast Business Volume (Units) Analysis 2019 to 2023 and Forecast 2024 to 2034, By Product

Table 12: Northeast Business Volume (Units) Analysis 2019 to 2023 and Forecast 2024 to 2034, By Product

Table 13: Northeast Business Size (US$ Million) Analysis 2019 to 2023 and Forecast 2024 to 2034, By Modality

Table 14: Northeast Business Size (US$ Million) Analysis 2019 to 2023 and Forecast 2024 to 2034, By Indication

Table 15: Northeast Business Size (US$ Million) Analysis 2019 to 2023 and Forecast 2024 to 2034, By End User

Table 16: New York Business Size (US$ Million) Analysis 2019 to 2023 and Forecast 2024 to 2034, By Product

Table 17: New York Business Volume (Units) Analysis 2019 to 2023 and Forecast 2024 to 2034, By Product

Table 18: New York Business Volume (Units) Analysis 2019 to 2023 and Forecast 2024 to 2034, By Product

Table 19: New York Business Size (US$ Million) Analysis 2019 to 2023 and Forecast 2024 to 2034, By Modality

Table 20: New York Business Size (US$ Million) Analysis 2019 to 2023 and Forecast 2024 to 2034, By Indication

Table 21: New York Business Size (US$ Million) Analysis 2019 to 2023 and Forecast 2024 to 2034, By End User

Table 22: New Jersey Business Size (US$ Million) Analysis 2019 to 2023 and Forecast 2024 to 2034, By Product

Table 23: New Jersey Business Volume (Units) Analysis 2019 to 2023 and Forecast 2024 to 2034, By Product

Table 24: New Jersey Business Volume (Units) Analysis 2019 to 2023 and Forecast 2024 to 2034, By Product

Table 25: New Jersey Business Size (US$ Million) Analysis 2019 to 2023 and Forecast 2024 to 2034, By Modality

Table 26: New Jersey Business Size (US$ Million) Analysis 2019 to 2023 and Forecast 2024 to 2034, By Indication

Table 27: New Jersey Business Size (US$ Million) Analysis 2019 to 2023 and Forecast 2024 to 2034, By End User

Table 28: Massachusetts Business Size (US$ Million) Analysis 2019 to 2023 and Forecast 2024 to 2034, By Product

Table 29: Massachusetts Business Volume (Units) Analysis 2019 to 2023 and Forecast 2024 to 2034, By Product

Table 30: Massachusetts Business Volume (Units) Analysis 2019 to 2023 and Forecast 2024 to 2034, By Product

Table 31: Massachusetts Business Size (US$ Million) Analysis 2019 to 2023 and Forecast 2024 to 2034, By Modality

Table 32: Massachusetts Business Size (US$ Million) Analysis 2019 to 2023 and Forecast 2024 to 2034, By Indication

Table 33: Massachusetts Business Size (US$ Million) Analysis 2019 to 2023 and Forecast 2024 to 2034, By End User

Table 34: Midwest Business Size (US$ Million) Analysis 2019 to 2023 and Forecast 2024 to 2034, By States

Table 35: Midwest Business Size (US$ Million) Analysis 2019 to 2023 and Forecast 2024 to 2034, By Product

Table 36: Midwest Business Volume (Units) Analysis 2019 to 2023 and Forecast 2024 to 2034, By Product

Table 37: Midwest Business Volume (Units) Analysis 2019 to 2023 and Forecast 2024 to 2034, By Product

Table 38: Midwest Business Size (US$ Million) Analysis 2019 to 2023 and Forecast 2024 to 2034, By Modality

Table 39: Midwest Business Size (US$ Million) Analysis 2019 to 2023 and Forecast 2024 to 2034, By Indication

Table 40: Midwest Business Size (US$ Million) Analysis 2019 to 2023 and Forecast 2024 to 2034, By End User

Table 41: Minnesota Business Size (US$ Million) Analysis 2019 to 2023 and Forecast 2024 to 2034, By Product

Table 42: Minnesota Business Volume (Units) Analysis 2019 to 2023 and Forecast 2024 to 2034, By Product

Table 43: Minnesota Business Volume (Units) Analysis 2019 to 2023 and Forecast 2024 to 2034, By Product

Table 44: Minnesota Business Size (US$ Million) Analysis 2019 to 2023 and Forecast 2024 to 2034, By Modality

Table 45: Minnesota Business Size (US$ Million) Analysis 2019 to 2023 and Forecast 2024 to 2034, By Indication

Table 46: Minnesota Business Size (US$ Million) Analysis 2019 to 2023 and Forecast 2024 to 2034, By End User

Table 47: Wisconsin Business Size (US$ Million) Analysis 2019 to 2023 and Forecast 2024 to 2034, By Product

Table 48: Wisconsin Business Volume (Units) Analysis 2019 to 2023 and Forecast 2024 to 2034, By Product

Table 49: Wisconsin Business Volume (Units) Analysis 2019 to 2023 and Forecast 2024 to 2034, By Product

Table 50: Wisconsin Business Size (US$ Million) Analysis 2019 to 2023 and Forecast 2024 to 2034, By Modality

Table 51: Wisconsin Business Size (US$ Million) Analysis 2019 to 2023 and Forecast 2024 to 2034, By Indication

Table 52: Wisconsin Business Size (US$ Million) Analysis 2019 to 2023 and Forecast 2024 to 2034, By End User

Table 53: Southeast Business Size (US$ Million) Analysis 2019 to 2023 and Forecast 2024 to 2034, By States

Table 54: Southeast Business Size (US$ Million) Analysis 2019 to 2023 and Forecast 2024 to 2034, By Product

Table 55: Southeast Business Volume (Units) Analysis 2019 to 2023 and Forecast 2024 to 2034, By Product

Table 56: Southeast Business Volume (Units) Analysis 2019 to 2023 and Forecast 2024 to 2034, By Product

Table 57: Southeast Business Size (US$ Million) Analysis 2019 to 2023 and Forecast 2024 to 2034, By Modality

Table 58: Southeast Business Size (US$ Million) Analysis 2019 to 2023 and Forecast 2024 to 2034, By Indication

Table 59: Southeast Business Size (US$ Million) Analysis 2019 to 2023 and Forecast 2024 to 2034, By End User

Table 60: North Carolina Business Size (US$ Million) Analysis 2019 to 2023 and Forecast 2024 to 2034, By Product

Table 61: North Carolina Business Volume (Units) Analysis 2019 to 2023 and Forecast 2024 to 2034, By Product

Table 62: North Carolina Business Volume (Units) Analysis 2019 to 2023 and Forecast 2024 to 2034, By Product

Table 63: North Carolina Business Size (US$ Million) Analysis 2019 to 2023 and Forecast 2024 to 2034, By Modality

Table 64: North Carolina Business Size (US$ Million) Analysis 2019 to 2023 and Forecast 2024 to 2034, By Indication

Table 65: North Carolina Business Size (US$ Million) Analysis 2019 to 2023 and Forecast 2024 to 2034, By End User

Table 66: South Carolina Business Size (US$ Million) Analysis 2019 to 2023 and Forecast 2024 to 2034, By Product

Table 67: South Carolina Business Volume (Units) Analysis 2019 to 2023 and Forecast 2024 to 2034, By Product

Table 68: South Carolina Business Volume (Units) Analysis 2019 to 2023 and Forecast 2024 to 2034, By Product

Table 69: South Carolina Business Size (US$ Million) Analysis 2019 to 2023 and Forecast 2024 to 2034, By Modality

Table 70: South Carolina Business Size (US$ Million) Analysis 2019 to 2023 and Forecast 2024 to 2034, By Indication

Table 71: South Carolina Business Size (US$ Million) Analysis 2019 to 2023 and Forecast 2024 to 2034, By End User

Table 72: Florida Business Size (US$ Million) Analysis 2019 to 2023 and Forecast 2024 to 2034, By Product

Table 73: Florida Business Volume (Units) Analysis 2019 to 2023 and Forecast 2024 to 2034, By Product

Table 74: Florida Business Volume (Units) Analysis 2019 to 2023 and Forecast 2024 to 2034, By Product

Table 75: Florida Business Size (US$ Million) Analysis 2019 to 2023 and Forecast 2024 to 2034, By Modality

Table 76: Florida Business Size (US$ Million) Analysis 2019 to 2023 and Forecast 2024 to 2034, By Indication

Table 77: Florida Business Size (US$ Million) Analysis 2019 to 2023 and Forecast 2024 to 2034, By End User

Table 78: Virginia Business Size (US$ Million) Analysis 2019 to 2023 and Forecast 2024 to 2034, By Product

Table 79: Virginia Business Volume (Units) Analysis 2019 to 2023 and Forecast 2024 to 2034, By Product

Table 80: Virginia Business Volume (Units) Analysis 2019 to 2023 and Forecast 2024 to 2034, By Product

Table 81: Virginia Business Size (US$ Million) Analysis 2019 to 2023 and Forecast 2024 to 2034, By Modality

Table 82: Virginia Business Size (US$ Million) Analysis 2019 to 2023 and Forecast 2024 to 2034, By Indication

Table 83: Virginia Business Size (US$ Million) Analysis 2019 to 2023 and Forecast 2024 to 2034, By End User

Table 84: Southwest Business Size (US$ Million) Analysis 2019 to 2023 and Forecast 2024 to 2034, By States

Table 85: Southwest Business Size (US$ Million) Analysis 2019 to 2023 and Forecast 2024 to 2034, By Product

Table 86: Southwest Business Volume (Units) Analysis 2019 to 2023 and Forecast 2024 to 2034, By Product

Table 87: Southwest Business Volume (Units) Analysis 2019 to 2023 and Forecast 2024 to 2034, By Product

Table 88: Southwest Business Size (US$ Million) Analysis 2019 to 2023 and Forecast 2024 to 2034, By Modality

Table 89: Southwest Business Size (US$ Million) Analysis 2019 to 2023 and Forecast 2024 to 2034, By Indication

Table 90: Southwest Business Size (US$ Million) Analysis 2019 to 2023 and Forecast 2024 to 2034, By End User

Table 91: Louisiana Business Size (US$ Million) Analysis 2019 to 2023 and Forecast 2024 to 2034, By Product

Table 92: Louisiana Business Volume (Units) Analysis 2019 to 2023 and Forecast 2024 to 2034, By Product

Table 93: Louisiana Business Volume (Units) Analysis 2019 to 2023 and Forecast 2024 to 2034, By Product

Table 94: Louisiana Business Size (US$ Million) Analysis 2019 to 2023 and Forecast 2024 to 2034, By Modality

Table 95: Louisiana Business Size (US$ Million) Analysis 2019 to 2023 and Forecast 2024 to 2034, By Indication

Table 96: Louisiana Business Size (US$ Million) Analysis 2019 to 2023 and Forecast 2024 to 2034, By End User

Table 97: Oklahoma Business Size (US$ Million) Analysis 2019 to 2023 and Forecast 2024 to 2034, By Product

Table 98: Oklahoma Business Volume (Units) Analysis 2019 to 2023 and Forecast 2024 to 2034, By Product

Table 99: Oklahoma Business Volume (Units) Analysis 2019 to 2023 and Forecast 2024 to 2034, By Product

Table 100: Oklahoma Business Size (US$ Million) Analysis 2019 to 2023 and Forecast 2024 to 2034, By Modality

Table 101: Oklahoma Business Size (US$ Million) Analysis 2019 to 2023 and Forecast 2024 to 2034, By Indication

Table 102: Oklahoma Business Size (US$ Million) Analysis 2019 to 2023 and Forecast 2024 to 2034, By End User

Table 103: Texas Business Size (US$ Million) Analysis 2019 to 2023 and Forecast 2024 to 2034, By Product

Table 104: Texas Business Volume (Units) Analysis 2019 to 2023 and Forecast 2024 to 2034, By Product

Table 105: Texas Business Volume (Units) Analysis 2019 to 2023 and Forecast 2024 to 2034, By Product

Table 106: Texas Business Size (US$ Million) Analysis 2019 to 2023 and Forecast 2024 to 2034, By Modality

Table 107: Texas Business Size (US$ Million) Analysis 2019 to 2023 and Forecast 2024 to 2034, By Indication

Table 108: Texas Business Size (US$ Million) Analysis 2019 to 2023 and Forecast 2024 to 2034, By End User

Table 109: West Business Size (US$ Million) Analysis 2019 to 2023 and Forecast 2024 to 2034, By States

Table 110: West Business Size (US$ Million) Analysis 2019 to 2023 and Forecast 2024 to 2034, By Product

Table 111: West Business Volume (Units) Analysis 2019 to 2023 and Forecast 2024 to 2034, By Product

Table 112: West Business Volume (Units) Analysis 2019 to 2023 and Forecast 2024 to 2034, By Product

Table 113: West Business Size (US$ Million) Analysis 2019 to 2023 and Forecast 2024 to 2034, By Modality

Table 114: West Business Size (US$ Million) Analysis 2019 to 2023 and Forecast 2024 to 2034, By Indication

Table 115: West Business Size (US$ Million) Analysis 2019 to 2023 and Forecast 2024 to 2034, By End User

Table 116: Washington Business Size (US$ Million) Analysis 2019 to 2023 and Forecast 2024 to 2034, By Product

Table 117: Washington Business Volume (Units) Analysis 2019 to 2023 and Forecast 2024 to 2034, By Product

Table 118: Washington Business Volume (Units) Analysis 2019 to 2023 and Forecast 2024 to 2034, By Product

Table 119: Washington Business Size (US$ Million) Analysis 2019 to 2023 and Forecast 2024 to 2034, By Modality

Table 120: Washington Business Size (US$ Million) Analysis 2019 to 2023 and Forecast 2024 to 2034, By Indication

Table 121: Washington Business Size (US$ Million) Analysis 2019 to 2023 and Forecast 2024 to 2034, By End User

Table 122: California Business Size (US$ Million) Analysis 2019 to 2023 and Forecast 2024 to 2034, By Product

Table 123: California Business Volume (Units) Analysis 2019 to 2023 and Forecast 2024 to 2034, By Product

Table 124: California Business Volume (Units) Analysis 2019 to 2023 and Forecast 2024 to 2034, By Product

Table 125: California Business Size (US$ Million) Analysis 2019 to 2023 and Forecast 2024 to 2034, By Modality

Table 126: California Business Size (US$ Million) Analysis 2019 to 2023 and Forecast 2024 to 2034, By Indication

Table 127: California Business Size (US$ Million) Analysis 2019 to 2023 and Forecast 2024 to 2034, By End User

Table 128: New Mexico Business Size (US$ Million) Analysis 2019 to 2023 and Forecast 2024 to 2034, By Product

Table 129: New Mexico Business Volume (Units) Analysis 2019 to 2023 and Forecast 2024 to 2034, By Product

Table 130: New Mexico Business Volume (Units) Analysis 2019 to 2023 and Forecast 2024 to 2034, By Product

Table 131: New Mexico Business Size (US$ Million) Analysis 2019 to 2023 and Forecast 2024 to 2034, By Modality

Table 132: New Mexico Business Size (US$ Million) Analysis 2019 to 2023 and Forecast 2024 to 2034, By Indication

Table 133: New Mexico Business Size (US$ Million) Analysis 2019 to 2023 and Forecast 2024 to 2034, By End User

List of Figures

Figure 01: Business Value Share By Product 2024 (E)

Figure 02: Business Value Share By Modality 2024 (E)

Figure 04: Business Value Share By End User 2024 (E)

Figure 04: Healthcare Expenditure in US$ Million (2019 to 2023)

Figure 05: Business Value Share By Region 2024 (E)

Figure 06: Business Volume ('000' Units) Analysis, 2019 to 2023

Figure 07: Business Volume Forecast (Units), 2024 to 2034

Figure 08: Business Size (US$ Million) Analysis, 2019 to 2023

Figure 09: Business Size (US$ Million) & Y-o-Y Growth (%) Analysis, 2024 to 2034

Figure 10: Business Absolute $ Opportunity Analysis, 2024 to 2034

Figure 11: Industry Analysis By Product, 2024 & 2034

Figure 12: Business Y-o-Y Growth Projections By Product, 2024 to 2034

Figure 13: Industry Attractiveness, By Product

Figure 14: Industry Analysis By Modality, 2024 & 2034

Figure 15: Business Y-o-Y Growth Projections By Modality, 2024 to 2034

Figure 16: Industry Attractiveness, By Modality

Figure 17: Industry Analysis By Indication- 2024 & 2034

Figure 18: Business Y-o-Y Growth Projections By Indication, 2024 to 2034

Figure 19: Industry Attractiveness, By Indication

Figure 20: Industry Analysis by End User 2024 & 2034

Figure 21: Business Y-o-Y Growth Projections by End User, 2024 to 2034

Figure 22: Industry Attractiveness, by End User

Figure 23: Industry Analysis by Region–2024 & 2034

Figure 24: Business Y-o-Y Growth Projections by Region, 2024 to 2034

Figure 25: Industry Attractiveness, By Region

Figure 26: Northeast Business Size (US$ Million) Analysis, 2019 to 2023

Figure 27: Northeast Business Size (US$ Million) & Y-o-Y Growth (%) Analysis, 2024 to 2034

Figure 28: Northeast Business Value Share By Product 2024 (E)

Figure 29: Northeast Business Value Share By Modality 2024 (E)

Figure 30: Northeast Business Value Share By Indication 2024 (E)

Figure 31: Northeast Business Value Share By End User 2024 (E)

Figure 32: Northeast Business Value Share By States 2024 (E)

Figure 33: Northeast Industry Attractiveness Analysis 2024 to 2034 By States

Figure 34: Northeast Industry Attractiveness Analysis 2024 to 2034 By Product

Figure 35: Northeast Industry Attractiveness Analysis 2024 to 2034, By Modality

Figure 36: Northeast Industry Attractiveness Analysis 2024 to 2034, By Indication

Figure 37: Northeast Industry Attractiveness Analysis 2024 to 2034, By End User

Figure 38: Midwest Business Size (US$ Million) Analysis, 2019 to 2023

Figure 39: Midwest Business Size (US$ Million) & Y-o-Y Growth (%) Analysis, 2024 to 2034

Figure 40: Midwest Business Value Share By Product 2024 (E)

Figure 41: Midwest Business Value Share By Modality 2024 (E)

Figure 42: Midwest Business Value Share By Indication 2024 (E)

Figure 43: Midwest Business Value Share By End User 2024 (E)

Figure 44: Midwest Business Value Share By States 2024 (E)

Figure 45: Midwest Industry Attractiveness Analysis 2024 to 2034 By States

Figure 46: Midwest Industry Attractiveness Analysis 2024 to 2034 By Product

Figure 47: Midwest Industry Attractiveness Analysis 2024 to 2034, By Modality

Figure 48: Midwest Industry Attractiveness Analysis 2024 to 2034, By Indication

Figure 49: Midwest Industry Attractiveness Analysis 2024 to 2034, By End User

Figure 50: Southeast Business Size (US$ Million) Analysis, 2019 to 2023

Figure 51: Southeast Business Size (US$ Million) & Y-o-Y Growth (%) Analysis, 2024 to 2034

Figure 52: Southeast Business Value Share By Product 2024 (E)

Figure 53: Southeast Business Value Share By Modality 2024 (E)

Figure 54: Southeast Business Value Share By Indication 2024 (E)

Figure 55: Southeast Business Value Share By End User 2024 (E)

Figure 56: Southeast Business Value Share By States 2024 (E)

Figure 57: Southeast Industry Attractiveness Analysis 2024 to 2034 By States

Figure 58: Southeast Industry Attractiveness Analysis 2024 to 2034 By Product

Figure 59: Southeast Industry Attractiveness Analysis 2024 to 2034, By Modality

Figure 60: Southeast Industry Attractiveness Analysis 2024 to 2034, By Indication

Figure 61: Southeast Industry Attractiveness Analysis 2024 to 2034, By End User

Figure 62: Southwest Business Size (US$ Million) Analysis, 2019 to 2023

Figure 63: Southwest Business Size (US$ Million) & Y-o-Y Growth (%) Analysis, 2024 to 2034

Figure 64: Southwest Business Value Share By Product 2024 (E)

Figure 65: Southwest Business Value Share By Modality 2024 (E)

Figure 66: Southwest Business Value Share By Indication 2024 (E)

Figure 67: Southwest Business Value Share By End User 2024 (E)

Figure 68: Southwest Business Value Share By States 2024 (E)

Figure 69: Southwest Industry Attractiveness Analysis 2024 to 2034 By States

Figure 70: Southwest Industry Attractiveness Analysis 2024 to 2034 By Product

Figure 71: Southwest Industry Attractiveness Analysis 2024 to 2034, By Modality

Figure 72: Southwest Industry Attractiveness Analysis 2024 to 2034, By Indication

Figure 73: Southwest Industry Attractiveness Analysis 2024 to 2034, By End User

Figure 74: West Business Size (US$ Million) Analysis, 2019 to 2023

Figure 75: West Business Size (US$ Million) & Y-o-Y Growth (%) Analysis, 2024 to 2034

Figure 76: West Business Value Share By Product 2024 (E)

Figure 77: West Business Value Share By Modality 2024 (E)

Figure 78: West Business Value Share By Indication 2024 (E)

Figure 79: West Business Value Share By End User 2024 (E)

Figure 80: West Business Value Share By States 2024 (E)

Figure 81: West Industry Attractiveness Analysis 2024 to 2034 By States

Figure 82: West Industry Attractiveness Analysis 2024 to 2034 By Product

Figure 83: West Industry Attractiveness Analysis 2024 to 2034, By Modality

Figure 84: West Industry Attractiveness Analysis 2024 to 2034, By Indication

Figure 85: West Industry Attractiveness Analysis 2024 to 2034, By End User

Frequently Asked Questions

How big is the dialysis equipment business in the United States?

The United States business is valued at USD 6,252.5 million in 2023.

What is the sales forecast for dialysis equipment in the United States?

Sales will likely total USD 6,495.4 million by 2024.

What is the expected United States business size in 2034?

Total business size is set to reach around USD 8,690.2 million by 2034.

Which product segment leads the United States business?

With 86.1% share, hemodialysis devices segment will dominate the target business.

What was the last 5 years’ CAGR for the target business?

The United States business grew at a 2.5% CAGR from 2019 to 2023.

What is the Southeast industry outlook?

Southeast is set to account for around 34.1% share of the United States business in 2024.

How much does a dialysis machine cost in the United States?

In the United States, the cost of a dialysis machine ranges from USD 3000 to USD 45000.

What equipment is used for dialysis?

Dialyzer is mostly used for dialysis.

Explore Similar Insights

Future Market Insights

Dialysis Equipment Industry Analysis in the United States