Plant Care Services Market Size and Share Forecast Outlook 2025 to 2035

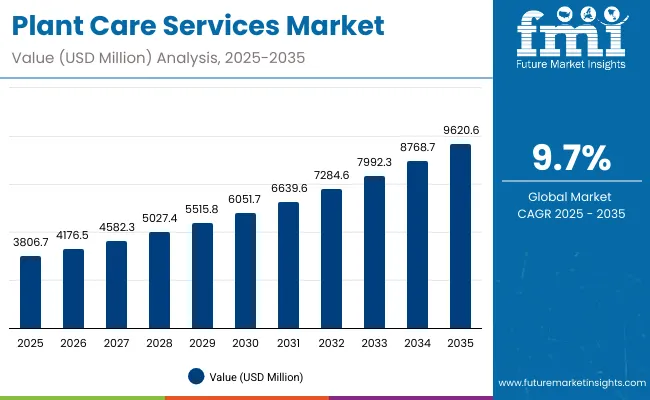
The Plant Care Services Market is expected to record a valuation of USD 3,806.7 million in 2025 and USD 9,620.6 million in 2035, with an increase of USD 5,813.9 million, which equals a growth of 153% over the decade. The overall expansion represents a CAGR of 9.7% and a 2.5X increase in market size.

Quick Stats for Plant Care Services Market

  • Plant Care Services Market Value (2025): USD 3,806.7 million
  • Plant Care Services Market Forecast Value (2035): USD 9,620.6 million
  • Plant Care Services Market Forecast CAGR (2025 to 2035): 9.7%
  • Leading Segment in Plant Care Services Market in 2025: On-site visits (65.1%)
  • Key Growth Regions in the Plant Care Services Market: North America, Asia-Pacific, Europe
  • Top Key Players in Plant Care Services Market: Greenscapes, Ambius, Rentokil Initial Plants, The Sill, Bloomscape, Plantscaping, Natura, UrbanStems, My City Plants, Planterra

Plant Care Services Market

Plant Care Services Market Key Takeaways

Metric Value
Market Estimated Value in (2025E) USD 3,806.7 million
Market Forecast Value in (2035F) USD 9,620.6 million
Forecast CAGR (2025 to 2035) 9.7%

During the first five-year period from 2025 to 2030, the market increases from USD 3,806.7 million to USD 6,051.7 million, adding USD 2,245 million, which accounts for 39% of the total decade growth. This phase records steady adoption of on-site services for residential and commercial offices, as well as greater uptake of subscription-based plant care kits among urban households seeking convenience.

The second half from 2030 to 2035 contributes USD 3,569 million, equal to 61% of total growth, as the market jumps from USD 6,051.7 million to USD 9,620.6 million. This acceleration is powered by widespread digitization of plant care through IoT-enabled monitoring, AI-driven pest detection, and remote advisory models. Subscription deliveries and app-based plant care expand rapidly, while commercial offices and hospitality sectors increasingly adopt professional maintenance programs. By 2035, digital and subscription-led models account for a much larger share of the total value.

From 2020 to 2024, the Plant Care Services Market steadily expanded, driven by rising urban greenery initiatives and demand for managed indoor plant services. During this period, on-site visits dominated revenues, accounting for nearly two-thirds of total value, with service leaders such as Ambius, Rentokil Initial, and Bloomscape scaling operations through commercial contracts. Competitive differentiation relied on reliability, customized care packages, and sustainable practices, while DIY subscription kits remained a niche with less than 10% penetration.

Demand will further expand to USD 3,806.7 million in 2025, and the revenue mix is expected to shift as subscription deliveries and remote advisory models grow to capture a larger share. Traditional service leaders face rising competition from digital-first plant care platforms offering app-based monitoring, IoT-enabled soil and water sensors, and subscription-based wellness programs. Leading providers are pivoting to hybrid models, combining physical plant services with AI-driven disease detection and remote advisory ecosystems. The competitive advantage is moving away from physical service scale alone toward ecosystem strength, tech-integration, and recurring subscription revenues.

Why the Plant Care Services Market is growing?

The market expansion is indicative to the increasing adoption of plant care services in commercial office spaces. Employers are investing in greenery as part of sustainability goals, ESG reporting, and workplace wellness programs. Studies link indoor plants to higher productivity, reduced stress, and improved air quality, making them a preferred investment in corporate environments. Service providers are offering customized maintenance contracts, IoT-based plant monitoring, and seasonal plant rotations, which appeal to enterprises seeking consistent care. This structural demand ensures recurring, high-value contracts driving market growth.

Urban millennials are increasingly adopting subscription-based plant care kits that deliver DIY solutions with fertilizers, soil boosters, and remote advisory support through mobile apps. This shift is fueled by limited time, smaller living spaces, and rising interest in home aesthetics and indoor greenery. These kits not only simplify care but also integrate AI-driven reminders, pest detection advice, and seasonal customization. The digital-first, experience-driven model aligns with consumer preferences for personalization and convenience, expanding revenue beyond traditional on-site services into scalable, tech-enabled ecosystems.

Segmental Analysis

The Plant Care Services Market is segmented by service type, customer type, service mode, and region, reflecting its diverse structure and evolving demand. Service types include plant watering & feeding, pest/disease management, repotting & soil services, landscaping & aesthetic care, and subscription plant care kits, addressing both essential and lifestyle-driven needs. Customer types span residential, commercial offices, hotels & hospitality, and institutions, highlighting wide applicability across households and businesses. Service modes consist of on-site visits, subscription deliveries (DIY kits), and remote advisory through apps and IoT devices, with traditional in-person care being supplemented by digital-first solutions. Regionally, the market scope extends across North America, Latin America, Europe, Asia-Pacific, and the Middle East & Africa, with growth driven by urban greenery initiatives, wellness-focused workplaces, and the rising popularity of indoor plants among younger consumers.
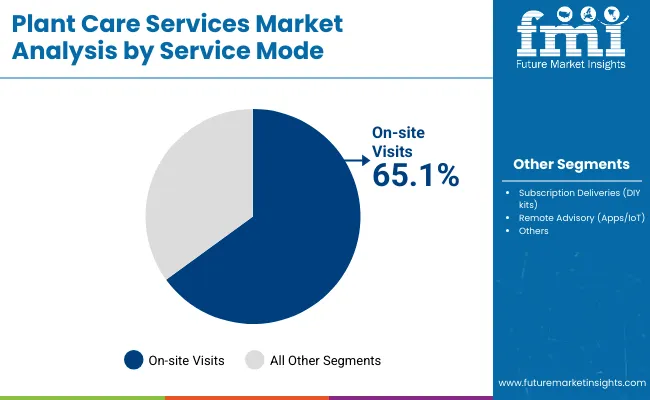
Insights into the Service Mode Segment with On-site Visits Leading in Market Share

Plant Care Services Market By Service

Service Mode Value Share% 2025
On-site visits 65.1%
Others 34.9%

The on-site visits segment is projected to contribute the largest share of the Plant Care Services Market revenue in 2025, maintaining its dominance as the preferred service mode. This leadership is driven by strong demand across residential households, commercial offices, and hospitality spaces where clients require hands-on, professional maintenance to ensure plant health and aesthetic appeal. On-site visits provide reliability, tailored solutions, and consistent quality, which are particularly valued by businesses integrating greenery into workplace wellness and ESG programs.

The segment’s growth is further supported by expanding corporate contracts, premium urban households, and institutions such as schools and hospitals seeking professional care. While digital solutions and subscription kits are growing, on-site visits remain the backbone of plant care services, offering personalized expertise that cannot be fully replicated by remote or DIY alternatives.
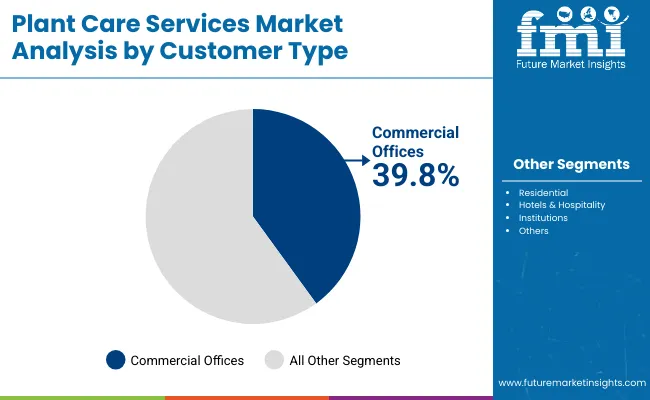
Insights into the Customer Type Segment with Commercial Offices Leading in Market Share

Plant Care Services Market By Customer

Customer Type Value Share% 2025
Commercial offices 39.8%
Others 60.2%

The commercial offices segment is forecasted to hold a significant share of the Plant Care Services Market in 2025, driven by rising demand for sustainable workplace environments and wellness-focused initiatives. Offices increasingly adopt professional plant care to improve air quality, enhance aesthetics, and support employee wellbeing, with green certifications (such as LEED and WELL) reinforcing this trend. Corporate sustainability programs also integrate greenery as part of ESG commitments, creating recurring demand for specialized plant care contracts.

The segment’s growth is further supported by large-scale urban office complexes, co-working spaces, and hybrid work environments where companies seek to foster healthier, more attractive workspaces. Service providers are responding with customized care packages, IoT-enabled monitoring, and seasonal plant rotation programs, ensuring long-term engagement. As businesses increasingly link indoor greenery to productivity and corporate image, commercial offices are expected to remain one of the most lucrative customer groups in the Plant Care Services Market.
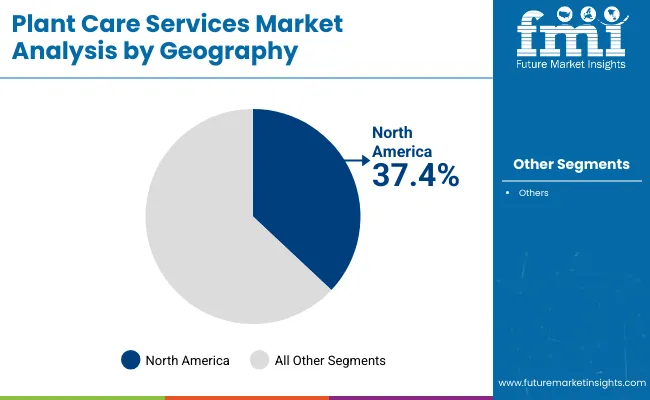
Insights into the Regional Segment with North America Leading in Market Share

Plant Care Services Market By Geography

Geography Value Share% 2025
North America 37.4%
Others 62.6%

he North American region is projected to account for the largest share of the Plant Care Services Market in 2025, establishing it as the leading geography. This dominance is supported by the region’s strong adoption of professional plant care in residential, commercial, and hospitality spaces, alongside growing emphasis on sustainability certifications and workplace wellness programs. With rising corporate demand for biophilic design, office greenery, and ESG compliance, plant care services have become an essential component of business and residential urban living.

The region’s growth is further strengthened by high penetration of subscription-based plant care kits among millennials and urban households, as well as advanced digital platforms integrating IoT-enabled plant monitoring and advisory services. Service providers in North America also lead in offering premium, customized solutions for hotels, institutions, and luxury residences. Given its mature service ecosystem and emphasis on lifestyle-driven greenery, North America is expected to maintain its leading role in the Plant Care Services Market throughout the forecast period.

What are the Drivers, Restraints, and Key Trends of the Plant Care Services Market?

Corporate ESG and Workplace Wellness Initiatives

A major driver for the Plant Care Services Market is the surge in corporate sustainability and wellness programs. Offices are increasingly integrating indoor greenery to align with LEED and WELL certifications and ESG goals. Studies show plants improve productivity, reduce stress, and enhance indoor air quality, making professional plant care indispensable for modern workspaces. Service providers offering long-term contracts, IoT-based plant health monitoring, and customized care packages are seeing strong demand from large corporates, ensuring recurring revenue streams and steady market expansion.

Subscription Plant Care Kits for Urban Households

Urbanization and the popularity of apartment living are driving demand for subscription-based plant care kits. These kits offer fertilizers, soil boosters, seasonal plant food, and app-based reminders, meeting the needs of time-constrained urban millennials. Growing interest in aesthetic indoor greenery and Instagram-driven lifestyle trends amplifies adoption. Providers are integrating AI-driven advisory features, pest detection tips, and IoT sensor compatibility, creating convenience and personalization. This shift expands the market beyond traditional on-site services, opening a scalable, digital-first revenue model with strong consumer loyalty.

High Service Costs and Limited Scalability

The cost-intensive nature of personalized on-site plant care remains a key restraint. Professional maintenance requires skilled labor, frequent visits, and customized solutions, making services relatively expensive for small households and SMEs. Additionally, the reliance on manual service models limits scalability compared to subscription kits or app-based advisory systems. In price-sensitive regions, consumers often resort to DIY care, reducing market penetration. This cost barrier restricts adoption among lower-income groups and smaller businesses, slowing overall expansion despite growing awareness of plant care benefits.

Integration of IoT and AI into Plant Care Services

A defining trend is the integration of IoT sensors and AI-driven advisory platforms in plant care. Smart soil sensors now monitor moisture, nutrients, and light exposure, sending data to mobile apps that provide real-time recommendations. AI enhances this ecosystem by offering automated pest and disease detection with predictive alerts. Service providers are combining these technologies with subscription care models to deliver hybrid offerings blending professional visits with digital monitoring. This convergence is transforming plant care into a tech-enabled, scalable service model.
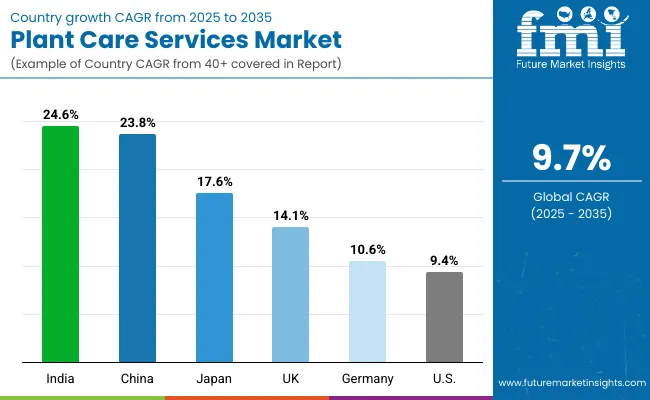
Analysis of Plant Care Services Market By Key Countries

Plant Care Services Market By Country

Countries Estimated CAGR (2025 to 2035)
China 23.8%
USA 9.4%
India 24.6%
UK 14.1%
Germany 10.6%
Japan 17.6%

The global Plant Care Services Market shows significant regional disparities, shaped by urbanization, workplace wellness programs, and adoption of subscription-based care models. Asia-Pacific is the fastest-growing region, led by China (23.8% CAGR) and India (24.6% CAGR). China’s growth is supported by urban lifestyle changes, municipal greenery initiatives, and strong adoption of plant care apps and subscription kits. India demonstrates a similar trajectory, driven by rising awareness in tier-2 cities, cost-effective service launches, and growing demand from commercial offices and institutions.

Europe maintains steady momentum, with Germany (10.6% CAGR) and the UK (14.1% CAGR) benefiting from a strong culture of indoor gardening, biophilic design adoption in offices, and government-backed sustainability programs. Japan (17.6% CAGR) shows robust expansion fueled by technological integration, where IoT-enabled plant monitoring and AI-driven wellness programs are becoming mainstream.

North America remains a mature market, with the USA (9.4% CAGR) growing at a slower pace due to saturation but continuing to benefit from large-scale corporate contracts and premium residential services. Growth in the region is increasingly shaped by digital-first models such as IoT-based monitoring, app-based advisory, and hybrid subscription bundles rather than traditional services alone.
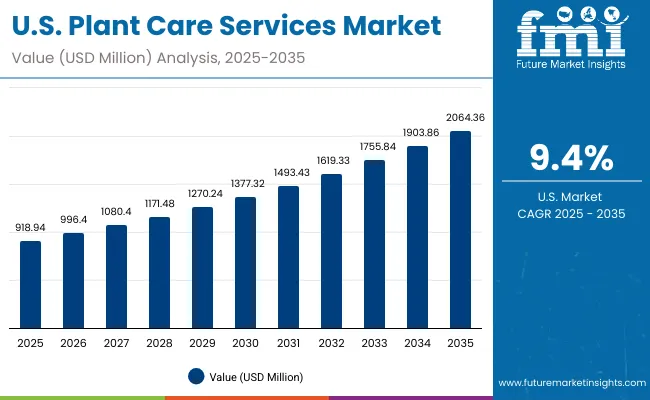
Sales Outlook for Plant Care Services in the United States

Plant Care Services Market Usa

Year USA Plant Care Services Market (USD Million)
2025 918.94
2026 996.40
2027 1080.40
2028 1171.48
2029 1270.24
2030 1377.32
2031 1493.43
2032 1619.33
2033 1755.84
2034 1903.86
2035 2064.36

The Plant Care Services Market in the United States is projected to grow at a CAGR of 9.4% between 2025 and 2035, fueled by rising adoption of greenery in corporate offices, hotels, and premium residential spaces. Growth is anchored by large-scale commercial contracts where sustainability and wellness programs drive demand for long-term plant care partnerships. Additionally, the expansion of subscription deliveries and IoT-enabled monitoring solutions is reshaping service delivery, making care more data-driven and scalable.

Adoption is also rising in hospitality and institutional spaces, where interior landscaping is central to branding and customer experience. Service providers are bundling on-site visits with remote advisory apps to enhance efficiency and reduce service costs. This hybrid model appeals to both households and businesses. As wellness-driven spaces become a priority in urban planning, the USA market is expected to see continuous growth.

  • Corporate offices adopting greenery to align with ESG and wellness goals
  • Hotels and hospitality investing in interior landscaping for branding
  • Hybrid models combining on-site visits and digital advisory shaping growth

Growth and Expansion Outlook for Plant Care Services Market in the United Kingdom

The Plant Care Services Market in the United Kingdom is expected to grow at a CAGR of 14.1% through 2035, driven by a combination of workplace wellness initiatives, hospitality sector investments, and a strong culture of home gardening. Corporate offices and co-working spaces are increasingly adopting professional plant care to align with sustainability certifications and employee wellbeing programs, creating recurring demand for on-site services. The UK’s hospitality and retail sectors are also integrating indoor greenery and landscaping as part of customer experience strategies, fueling steady adoption.

Public institutions and heritage sites further contribute to market growth by incorporating greenery into restoration and preservation projects, with plants being used for both aesthetic enhancement and environmental balance. Subscription-based plant care kits are gaining popularity among urban households, particularly in London and other metropolitan areas where lifestyle-driven demand for indoor greenery is high. Government-backed urban greening initiatives and public-private collaborations continue to strengthen market opportunities, creating a balanced growth environment across residential, commercial, and institutional segments.

  • Corporate offices are expanding plant care adoption to support ESG and wellness targets.
  • Hospitality and retail sectors are leveraging greenery for improved customer engagement.
  • Urban households are embracing subscription kits, boosting DIY and hybrid service demand.

Growth and Expansion Outlook for Plant Care Services Market in India

The Plant Care Services Market in India is forecast to expand at a CAGR of 24.6% through 2035, making it one of the fastest-growing globally. A sharp increase in adoption is being driven by tier-2 and tier-3 cities, where affordable service packages and subscription kits are gaining traction among middle-class households and MSMEs. Corporate offices are increasingly investing in professional greenery management as part of sustainability mandates and employee wellness programs, while institutions and co-working spaces are adopting on-site contracts.

Educational institutes and vocational training centers are also contributing by integrating horticulture and IoT-enabled plant monitoring into their digital learning modules, creating long-term demand for professional services. Public infrastructure projects are embracing greenery in urban landscaping and smart city programs, fueling steady institutional adoption. India’s youthful population and rising disposable income are further driving lifestyle-driven demand for indoor and balcony plant cae.

  • Tier-2 and tier-3 cities fueling adoption with cost-effective services.
  • Corporate offices increasing contracts for ESG and wellness compliance.
  • Education and public projects driving institutional and urban greenery adoption.

Sales Outlook for Plant Care Services Market in China

The Plant Care Services Market in China is expected to grow at a CAGR of 23.8% between 2025 and 2035, the highest among leading economies. This growth is fueled by strong government support for urban greening, cultural heritage preservation, and smart city initiatives that integrate plant care into public spaces and community design. Rising disposable incomes and lifestyle changes are driving subscription-based plant care kits in urban households, while commercial complexes and hospitality chains are contracting large-scale professional services.

Municipal governments are actively encouraging plant care adoption in public parks, offices, and educational institutions, creating consistent long-term demand. Domestic players are expanding aggressively with affordable service packages and app-based advisory platforms, making care accessible to both households and businesses. The presence of tech-driven solutions, including IoT-enabled plant monitoring and AI-based care recommendations, is accelerating market penetration across demographics.
  • Urban greening initiatives driving large-scale institutional adoption.
  • Domestic service providers offering affordable, app-integrated solutions.
  • Subscription-based kits fueling household adoption in major cities.

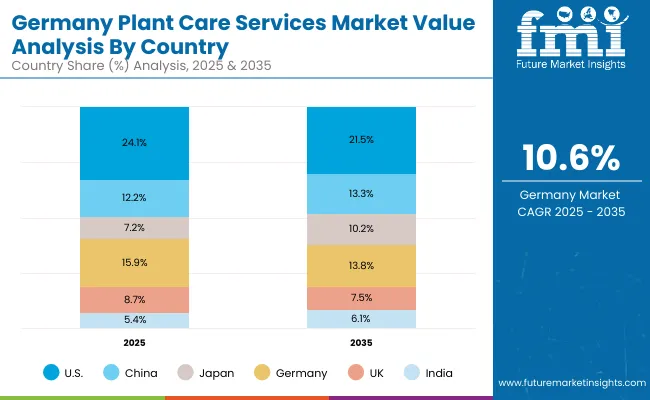
In-depth Analysis of Plant Care Services Market in Germany

Plant Care Services Market Germany

Countries 2025 Share (%)
USA 24.1%
China 12.2%
Japan 7.2%
Germany 15.9%
UK 8.7%
India 5.4%
Countries 2035 Share (%)
USA 21.5%
China 13.3%
Japan 10.2%
Germany 13.8%
UK 7.5%
India 6.1%

The Plant Care Services Market in Germany is projected to grow at a CAGR of 10.6% from 2025 to 2035, supported by its strong focus on sustainability, workplace wellness, and urban greening initiatives. German corporations are increasingly contracting professional plant care providers as part of their ESG strategies and EU sustainability compliance frameworks, creating stable recurring revenue. Urban municipalities are integrating greenery into public infrastructure, transportation hubs, and educational institutions, boosting demand for both on-site visits and subscription-based solutions.

The hospitality and healthcare sectors are also key adopters, with hotels, hospitals, and clinics prioritizing indoor plant management for patient wellbeing and guest experience. Additionally, Germany’s strong gardening culture translates into household adoption of subscription-based DIY care kits, especially in metropolitan areas like Berlin, Hamburg, and Munich. With rising emphasis on energy-efficient, green-certified buildings, plant care is becoming a standard feature of modern construction and design projects, further strengthening the market outlook.
  • Corporate offices using plant care to meet EU ESG and sustainability mandates.
  • Urban greening projects integrating greenery in public spaces and institutions.
  • Hospitality and healthcare providers prioritizing indoor plant care for wellbeing.

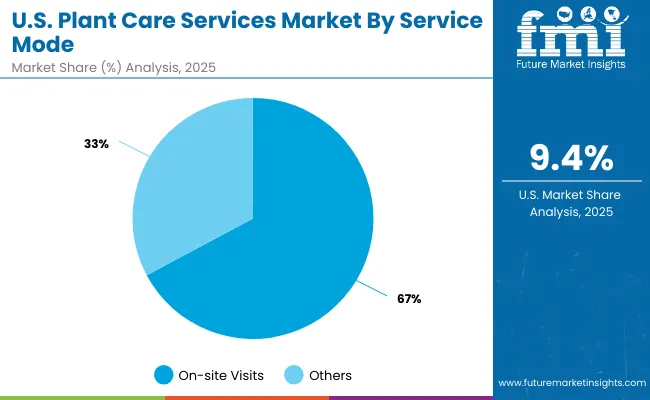
Growth Outlook for Plant Care Services Market in USA

Plant Care Services Market Usa 2

USA by Service Mode Value Share% 2025
On-site visits 67.2%
Others 32.8%

The Plant Care Services Market in the United States is projected to expand at a CAGR of 9.4% between 2025 and 2035. On-site visits dominate at 67.2% of service share in 2025, reflecting the preference of corporate offices, hospitals, and hospitality establishments for reliable, professional plant care contracts. Growth is also being reinforced by large-scale adoption in co-working spaces and premium residential complexes, where greenery is tied to wellness and sustainability branding.

The USA market is maturing but shifting toward hybrid models combining on-site visits with digital advisory and IoT-enabled plant monitoring for cost efficiency. Subscription deliveries of DIY plant care kits are increasingly popular in urban households, while the commercial segment drives recurring revenue through long-term contracts. With ESG reporting and wellness certifications rising, plant care is becoming an integral part of workplace and institutional environments.
  • On-site services dominate due to strong demand from offices and hospitality.
  • Hybrid models (on-site + IoT/digital) gaining traction for cost efficiency.
  • Subscription kits supporting household adoption in metro regions.

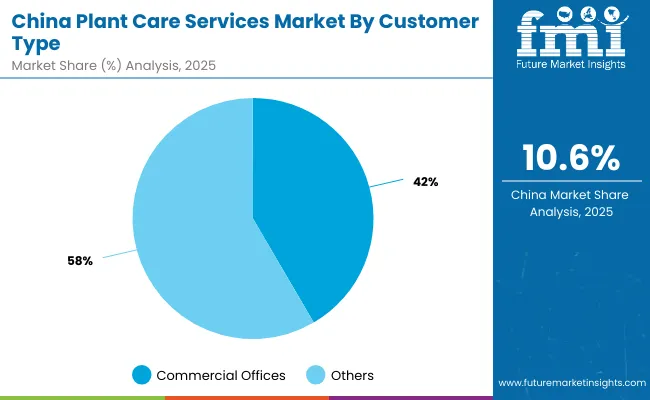
Opportunity Analysis of China Plant Care Services Market

Plant Care Services Market China

China by Customer Type Value Share% 2025
Commercial offices 41.6%
Others 58.4%

The Plant Care Services Market in China is forecast to grow at a CAGR of 23.8%, driven by rapid urbanization, smart city programs, and lifestyle shifts toward indoor greenery. In 2025, commercial offices account for 41.6% of demand, reflecting the trend of integrating biophilic design into workspaces to enhance productivity and air quality. Demand is further boosted by hospitality, malls, and public institutions adopting large-scale indoor landscaping.

Households are another fast-growing segment, supported by subscription-based plant care kits that cater to China’s digital-first consumer base. Domestic providers are leveraging mobile apps, AI-driven advisory, and affordable packages, enabling mass adoption across income groups. Municipal initiatives that mandate green public spaces and urban forestry are creating strong institutional opportunities, ensuring balanced demand from both households and commercial sectors.
  • Commercial offices (41.6%) driving recurring contracts for corporate greenery.
  • Households adopting subscription kits, supported by AI-driven apps.
  • Government greening policies fueling adoption in public and institutional spaces.

Competitive Landscape of Plant Care Services Market

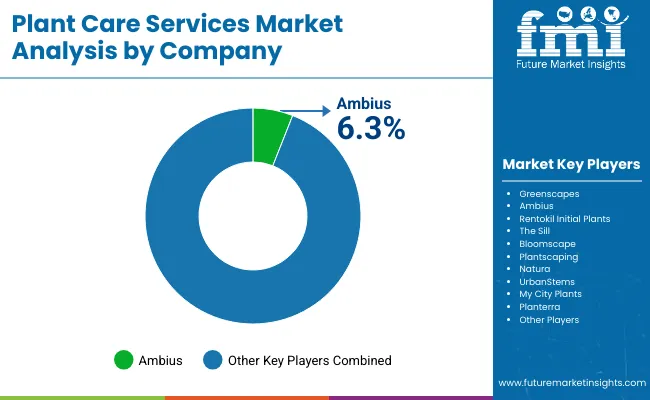
Plant Care Services Market By Company

The Plant Care Services Market is moderately fragmented, with leading international service providers, regional specialists, and niche innovators competing for share. Ambius, as the largest global player, commands 6.3% of the market, leveraging its scale in commercial landscaping and long-term corporate contracts. Other major providers such as Greenscapes, Rentokil Initial Plants, Bloomscape, and The Sill focus on specialized segments ranging from workplace greenery to direct-to-consumer subscription kits.

Mid-sized players including Plant scaping, Natura, and UrbanStems are capitalizing on personalized services and urban delivery models, catering especially to metro households and boutique offices. Meanwhile, niche companies such as My City Plants and Planterra are finding growth in targeted offerings like IoT-enabled plant monitoring, luxury plant décor, and eco-friendly soil/repotting services.

Competitive differentiation is shifting away from traditional maintenance to integrated service ecosystems, combining on-site visits, digital advisory, subscription kits, and sustainability-focused packages. Providers are increasingly embedding smart technology including sensor-based watering, AI-driven plant health monitoring, and app-based care scheduling to attract younger, tech-savvy customers and corporate clients seeking measurable ESG outcomes.

Key Developments in Plant Care Services Market

  • 2024: Ambius launched a hybrid service platform combining on-site plant care with AI-driven mobile advisory for corporate clients, expanding recurring service efficiency.
  • 2025: Bloomscape introduced IoT-enabled subscription kits featuring soil sensors and app integration, targeting urban households and premium apartment complexes across North America and Europe.

Scope of the Report

Item Value
Quantitative Units USD 3,806.7 Million
Service Type Plant watering & feeding, Pest/disease management, Repotting & soil services, Landscaping & aesthetic care, Subscription plant care kits
Customer Type Residential, Commercial offices, Hotels & hospitality, Institutions
Service Mode On-site visits, Subscription deliveries (DIY kits), Remote advisory (apps/ IoT)
Regions Covered North America, Europe, Asia-Pacific, Latin America, Middle East & Africa
Country Covered United States, Canada, Germany, France, United Kingdom, China, Japan, India, Brazil, South Africa
Key Companies Profiled Greenscapes, Ambius, Rentokil Initial Plants, The Sill, Bloomscape, Plantscaping, Natura, UrbanStems, My City Plants, Planterra
Additional Attributes Dollar sales by service type and customer category, adoption trends in subscription plant care kits and IoT -enabled monitoring, rising demand for on-site visits and DIY care kits, sector-specific growth in residential, commercial offices, and hospitality, revenue segmentation between physical services and remote advisory platforms, integration with smart home IoT, AR/VR plant health visualization, and AI-driven predictive care, regional growth patterns shaped by urban greening initiatives and corporate wellness programs, and innovations in app-based remote advisory, automated irrigation systems, and eco-friendly pest/disease management methods.

Key Segments

By Service Type:

  • Plant watering & feeding
  • Pest/disease management
  • Repotting & soil services
  • Landscaping & aesthetic care
  • Subscription plant care kits

By Customer Type:

  • Residential
  • Commercial offices
  • Hotels & hospitality
  • Institutions

By Service Mode:

  • On-site visits
  • Subscription deliveries (DIY kits)
  • Remote advisory (apps/IoT)

By Region:

  • North America
  • Latin America
  • Europe
  • East Asia
  • South Asia & Pacific
  • Middle East and Africa

Table of Content

  1. Executive Summary
    • Global Market Outlook
    • Demand-side Trends
    • Supply-side Trends
    • Technology Roadmap Analysis
    • Analysis and Recommendations
  2. Market Overview
    • Market Coverage / Taxonomy
    • Market Definition / Scope / Limitations
  3. Market Background
    • Market Dynamics
      • Drivers
      • Restraints
      • Opportunity
      • Trends
    • Scenario Forecast
      • Demand in Optimistic Scenario
      • Demand in Likely Scenario
      • Demand in Conservative Scenario
    • Opportunity Map Analysis
    • Product Life Cycle Analysis
    • Supply Chain Analysis
      • Supply Side Participants and their Roles
        • Producers
        • Mid-Level Participants (Traders/ Agents/ Brokers)
        • Wholesalers and Distributors
      • Value Added and Value Created at Node in the Supply Chain
      • List of Raw Material Suppliers
      • List of Existing and Potential Buyer’s
    • Investment Feasibility Matrix
    • Value Chain Analysis
      • Profit Margin Analysis
      • Wholesalers and Distributors
      • Retailers
    • PESTLE and Porter’s Analysis
    • Regulatory Landscape
      • By Key Regions
      • By Key Countries
    • Regional Parent Market Outlook
    • Production and Consumption Statistics
    • Import and Export Statistics
  4. Global Market Analysis 2020 to 2024 and Forecast, 2025 to 2035
    • Historical Market Size Value (USD Million) & Volume (Units) Analysis, 2020 to 2024
    • Current and Future Market Size Value (USD Million) & Volume (Units) Projections, 2025 to 2035
      • Y-o-Y Growth Trend Analysis
      • Absolute $ Opportunity Analysis
  5. Global Market Analysis 2020 to 2024 and Forecast 2025 to 2035, By Service Type
    • Introduction / Key Findings
    • Historical Market Size Value (USD Million) & Volume (Units) Analysis By Service Type, 2020 to 2024
    • Current and Future Market Size Value (USD Million) & Volume (Units) Analysis and Forecast By Service Type, 2025 to 2035
      • Plant watering & feeding
      • Pest/disease management
      • Repotting & soil services
      • Landscaping & aesthetic care
      • Subscription plant care kits
    • Y-o-Y Growth Trend Analysis By Service Type, 2020 to 2024
    • Absolute $ Opportunity Analysis By Service Type, 2025 to 2035
  6. Global Market Analysis 2020 to 2024 and Forecast 2025 to 2035, By Customer Type
    • Introduction / Key Findings
    • Historical Market Size Value (USD Million) & Volume (Units) Analysis By Customer Type, 2020 to 2024
    • Current and Future Market Size Value (USD Million) & Volume (Units) Analysis and Forecast By Customer Type, 2025 to 2035
      • Residential
      • Commercial offices
      • Hotels & hospitality
      • Institutions
    • Y-o-Y Growth Trend Analysis By Customer Type, 2020 to 2024
    • Absolute $ Opportunity Analysis By Customer Type, 2025 to 2035
  7. Global Market Analysis 2020 to 2024 and Forecast 2025 to 2035, By Service Mode
    • Introduction / Key Findings
    • Historical Market Size Value (USD Million) & Volume (Units) Analysis By Service Mode, 2020 to 2024
    • Current and Future Market Size Value (USD Million) & Volume (Units) Analysis and Forecast By Service Mode, 2025 to 2035
      • On-site visits
      • Subscription deliveries (DIY kits)
      • Remote advisory (apps/IoT)
    • Y-o-Y Growth Trend Analysis By Service Mode, 2020 to 2024
    • Absolute $ Opportunity Analysis By Service Mode, 2025 to 2035
  8. Global Market Analysis 2020 to 2024 and Forecast 2025 to 2035, By Region
    • Introduction
    • Historical Market Size Value (USD Million) & Volume (Units) Analysis By Region, 2020 to 2024
    • Current Market Size Value (USD Million) & Volume (Units) Analysis and Forecast By Region, 2025 to 2035
      • North America
      • Latin America
      • Europe
      • East Asia
      • South Asia & Pacific
      • Middle East and Africa
    • Market Attractiveness Analysis By Region
  9. North America Market Analysis 2020 to 2024 and Forecast 2025 to 2035, By Country
    • Historical Market Size Value (USD Million) & Volume (Units) Trend Analysis By Market Taxonomy, 2020 to 2024
    • Market Size Value (USD Million) & Volume (Units) Forecast By Market Taxonomy, 2025 to 2035
      • By Country
        • USA
        • Canada
      • By Service Type
      • By Customer Type
      • By Service Mode
    • Market Attractiveness Analysis
      • By Country
      • By Service Type
      • By Customer Type
      • By Service Mode
    • Key Takeaways
  10. Latin America Market Analysis 2020 to 2024 and Forecast 2025 to 2035, By Country
    • Historical Market Size Value (USD Million) & Volume (Units) Trend Analysis By Market Taxonomy, 2020 to 2024
    • Market Size Value (USD Million) & Volume (Units) Forecast By Market Taxonomy, 2025 to 2035
      • By Country
        • Brazil
        • Mexico
        • Colombia
        • Rest of Latin America
      • By Service Type
      • By Customer Type
      • By Service Mode
    • Market Attractiveness Analysis
      • By Country
      • By Service Type
      • By Customer Type
      • By Service Mode
    • Key Takeaways
  11. Europe Market Analysis 2020 to 2024 and Forecast 2025 to 2035, By Country
    • Historical Market Size Value (USD Million) & Volume (Units) Trend Analysis By Market Taxonomy, 2020 to 2024
    • Market Size Value (USD Million) & Volume (Units) Forecast By Market Taxonomy, 2025 to 2035
      • By Country
        • Germany
        • UK
        • France
        • Italy
        • Spain
        • Belgium
        • Netherlands
        • Nordic
        • Switzerland
        • Russia
        • Poland
        • Rest of Europe
      • By Service Type
      • By Customer Type
      • By Service Mode
    • Market Attractiveness Analysis
      • By Country
      • By Service Type
      • By Customer Type
      • By Service Mode
    • Key Takeaways
  12. East Asia Market Analysis 2020 to 2024 and Forecast 2025 to 2035, By Country
    • Historical Market Size Value (USD Million) & Volume (Units) Trend Analysis By Market Taxonomy, 2020 to 2024
    • Market Size Value (USD Million) & Volume (Units) Forecast By Market Taxonomy, 2025 to 2035
      • By Country
        • China
        • Japan
        • South Korea
      • By Service Type
      • By Customer Type
      • By Service Mode
    • Market Attractiveness Analysis
      • By Country
      • By Service Type
      • By Customer Type
      • By Service Mode
    • Key Takeaways
  13. South Asia & Pacific Market Analysis 2020 to 2024 and Forecast 2025 to 2035, By Country
    • Historical Market Size Value (USD Million) & Volume (Units) Trend Analysis By Market Taxonomy, 2020 to 2024
    • Market Size Value (USD Million) & Volume (Units) Forecast By Market Taxonomy, 2025 to 2035
      • By Country
        • India
        • Thailand
        • Malaysia
        • Indonesia
        • Singapore
        • Vietnam
        • Australia
        • New Zealand
        • Rest of South Asia
      • By Service Type
      • By Customer Type
      • By Service Mode
    • Market Attractiveness Analysis
      • By Country
      • By Service Type
      • By Customer Type
      • By Service Mode
    • Key Takeaways
  14. Middle East and Africa Market Analysis 2020 to 2024 and Forecast 2025 to 2035, By Country
    • Historical Market Size Value (USD Million) & Volume (Units) Trend Analysis By Market Taxonomy, 2020 to 2024
    • Market Size Value (USD Million) & Volume (Units) Forecast By Market Taxonomy, 2025 to 2035
      • By Country
        • Turkey
        • UAE
        • Saudi Arabia
        • Israel
        • Other GCC Countries
        • North Africa
        • South Africa
      • By Service Type
      • By Customer Type
      • By Service Mode
    • Market Attractiveness Analysis
      • By Country
      • By Service Type
      • By Customer Type
      • By Service Mode
    • Key Takeaways
  15. Key Countries Market Analysis
    • USA
      • Pricing Analysis
      • Market Share Analysis, 2024
        • By Service Type
        • By Customer Type
        • By Service Mode
    • Canada
      • Pricing Analysis
      • Market Share Analysis, 2024
        • By Service Type
        • By Customer Type
        • By Service Mode
    • Brazil
      • Pricing Analysis
      • Market Share Analysis, 2024
        • By Service Type
        • By Customer Type
        • By Service Mode
    • Mexico
      • Pricing Analysis
      • Market Share Analysis, 2024
        • By Service Type
        • By Customer Type
        • By Service Mode
    • Colombia
      • Pricing Analysis
      • Market Share Analysis, 2024
        • By Service Type
        • By Customer Type
        • By Service Mode
    • Germany
      • Pricing Analysis
      • Market Share Analysis, 2024
        • By Service Type
        • By Customer Type
        • By Service Mode
    • UK
      • Pricing Analysis
      • Market Share Analysis, 2024
        • By Service Type
        • By Customer Type
        • By Service Mode
    • France
      • Pricing Analysis
      • Market Share Analysis, 2024
        • By Service Type
        • By Customer Type
        • By Service Mode
    • Italy
      • Pricing Analysis
      • Market Share Analysis, 2024
        • By Service Type
        • By Customer Type
        • By Service Mode
    • Spain
      • Pricing Analysis
      • Market Share Analysis, 2024
        • By Service Type
        • By Customer Type
        • By Service Mode
    • Belgium
      • Pricing Analysis
      • Market Share Analysis, 2024
        • By Service Type
        • By Customer Type
        • By Service Mode
    • Netherlands
      • Pricing Analysis
      • Market Share Analysis, 2024
        • By Service Type
        • By Customer Type
        • By Service Mode
    • Nordic
      • Pricing Analysis
      • Market Share Analysis, 2024
        • By Service Type
        • By Customer Type
        • By Service Mode
    • Switzerland
      • Pricing Analysis
      • Market Share Analysis, 2024
        • By Service Type
        • By Customer Type
        • By Service Mode
    • Russia
      • Pricing Analysis
      • Market Share Analysis, 2024
        • By Service Type
        • By Customer Type
        • By Service Mode
    • Poland
      • Pricing Analysis
      • Market Share Analysis, 2024
        • By Service Type
        • By Customer Type
        • By Service Mode
    • China
      • Pricing Analysis
      • Market Share Analysis, 2024
        • By Service Type
        • By Customer Type
        • By Service Mode
    • Japan
      • Pricing Analysis
      • Market Share Analysis, 2024
        • By Service Type
        • By Customer Type
        • By Service Mode
    • South Korea
      • Pricing Analysis
      • Market Share Analysis, 2024
        • By Service Type
        • By Customer Type
        • By Service Mode
    • India
      • Pricing Analysis
      • Market Share Analysis, 2024
        • By Service Type
        • By Customer Type
        • By Service Mode
    • Thailand
      • Pricing Analysis
      • Market Share Analysis, 2024
        • By Service Type
        • By Customer Type
        • By Service Mode
    • Indonesia
      • Pricing Analysis
      • Market Share Analysis, 2024
        • By Service Type
        • By Customer Type
        • By Service Mode
    • Australia
      • Pricing Analysis
      • Market Share Analysis, 2024
        • By Service Type
        • By Customer Type
        • By Service Mode
    • New Zealand
      • Pricing Analysis
      • Market Share Analysis, 2024
        • By Service Type
        • By Customer Type
        • By Service Mode
    • Turkey
      • Pricing Analysis
      • Market Share Analysis, 2024
        • By Service Type
        • By Customer Type
        • By Service Mode
    • UAE
      • Pricing Analysis
      • Market Share Analysis, 2024
        • By Service Type
        • By Customer Type
        • By Service Mode
    • Saudi Arabia
      • Pricing Analysis
      • Market Share Analysis, 2024
        • By Service Type
        • By Customer Type
        • By Service Mode
    • Israel
      • Pricing Analysis
      • Market Share Analysis, 2024
        • By Service Type
        • By Customer Type
        • By Service Mode
    • North Africa
      • Pricing Analysis
      • Market Share Analysis, 2024
        • By Service Type
        • By Customer Type
        • By Service Mode
    • South Africa
      • Pricing Analysis
      • Market Share Analysis, 2024
        • By Service Type
        • By Customer Type
        • By Service Mode
  16. Market Structure Analysis
    • Competition Dashboard
    • Competition Benchmarking
    • Market Share Analysis of Top Players
      • By Regional
      • By Service Type
      • By Customer Type
      • By Service Mode
  17. Competition Analysis
    • Competition Deep Dive
      • Greenscapes
        • Overview
        • Product Portfolio
        • Profitability by Market Segments (Product/Age /Sales Channel/Region)
        • Sales Footprint
        • Strategy Overview
          • Marketing Strategy
          • Product Strategy
          • Channel Strategy
      • Ambius
        • Overview
        • Product Portfolio
        • Profitability by Market Segments (Product/Age /Sales Channel/Region)
        • Sales Footprint
        • Strategy Overview
          • Marketing Strategy
          • Product Strategy
          • Channel Strategy
      • Rentokil Initial Plants
        • Overview
        • Product Portfolio
        • Profitability by Market Segments (Product/Age /Sales Channel/Region)
        • Sales Footprint
        • Strategy Overview
          • Marketing Strategy
          • Product Strategy
          • Channel Strategy
      • The Sill
        • Overview
        • Product Portfolio
        • Profitability by Market Segments (Product/Age /Sales Channel/Region)
        • Sales Footprint
        • Strategy Overview
          • Marketing Strategy
          • Product Strategy
          • Channel Strategy
      • Bloomscape
        • Overview
        • Product Portfolio
        • Profitability by Market Segments (Product/Age /Sales Channel/Region)
        • Sales Footprint
        • Strategy Overview
          • Marketing Strategy
          • Product Strategy
          • Channel Strategy
      • Plantscaping
        • Overview
        • Product Portfolio
        • Profitability by Market Segments (Product/Age /Sales Channel/Region)
        • Sales Footprint
        • Strategy Overview
          • Marketing Strategy
          • Product Strategy
          • Channel Strategy
      • Natura
        • Overview
        • Product Portfolio
        • Profitability by Market Segments (Product/Age /Sales Channel/Region)
        • Sales Footprint
        • Strategy Overview
          • Marketing Strategy
          • Product Strategy
          • Channel Strategy
      • UrbanStems
        • Overview
        • Product Portfolio
        • Profitability by Market Segments (Product/Age /Sales Channel/Region)
        • Sales Footprint
        • Strategy Overview
          • Marketing Strategy
          • Product Strategy
          • Channel Strategy
      • My City Plants
        • Overview
        • Product Portfolio
        • Profitability by Market Segments (Product/Age /Sales Channel/Region)
        • Sales Footprint
        • Strategy Overview
          • Marketing Strategy
          • Product Strategy
          • Channel Strategy
      • Planterra
        • Overview
        • Product Portfolio
        • Profitability by Market Segments (Product/Age /Sales Channel/Region)
        • Sales Footprint
        • Strategy Overview
          • Marketing Strategy
          • Product Strategy
          • Channel Strategy
      • Others
        • Overview
        • Product Portfolio
        • Profitability by Market Segments (Product/Age /Sales Channel/Region)
        • Sales Footprint
        • Strategy Overview
          • Marketing Strategy
          • Product Strategy
          • Channel Strategy
  18. Assumptions & Acronyms Used
  19. Research Methodology

List of Tables

  • Table 1: Global Market Value (USD Million) Forecast by Region, 2020-2035
  • Table 2: Global Market Volume (Units) Forecast by Region, 2020-2035
  • Table 3: Global Market Value (USD Million) Forecast by Service Type, 2020-2035
  • Table 4: Global Market Volume (Units) Forecast by Service Type, 2020-2035
  • Table 5: Global Market Value (USD Million) Forecast by Customer Type, 2020-2035
  • Table 6: Global Market Volume (Units) Forecast by Customer Type, 2020-2035
  • Table 7: Global Market Value (USD Million) Forecast by Service Mode, 2020-2035
  • Table 8: Global Market Volume (Units) Forecast by Service Mode, 2020-2035
  • Table 9: North America Market Value (USD Million) Forecast by Country, 2020-2035
  • Table 10: North America Market Volume (Units) Forecast by Country, 2020-2035
  • Table 11: North America Market Value (USD Million) Forecast by Service Type, 2020-2035
  • Table 12: North America Market Volume (Units) Forecast by Service Type, 2020-2035
  • Table 13: North America Market Value (USD Million) Forecast by Customer Type, 2020-2035
  • Table 14: North America Market Volume (Units) Forecast by Customer Type, 2020-2035
  • Table 15: North America Market Value (USD Million) Forecast by Service Mode, 2020-2035
  • Table 16: North America Market Volume (Units) Forecast by Service Mode, 2020-2035
  • Table 17: Latin America Market Value (USD Million) Forecast by Country, 2020-2035
  • Table 18: Latin America Market Volume (Units) Forecast by Country, 2020-2035
  • Table 19: Latin America Market Value (USD Million) Forecast by Service Type, 2020-2035
  • Table 20: Latin America Market Volume (Units) Forecast by Service Type, 2020-2035
  • Table 21: Latin America Market Value (USD Million) Forecast by Customer Type, 2020-2035
  • Table 22: Latin America Market Volume (Units) Forecast by Customer Type, 2020-2035
  • Table 23: Latin America Market Value (USD Million) Forecast by Service Mode, 2020-2035
  • Table 24: Latin America Market Volume (Units) Forecast by Service Mode, 2020-2035
  • Table 25: Europe Market Value (USD Million) Forecast by Country, 2020-2035
  • Table 26: Europe Market Volume (Units) Forecast by Country, 2020-2035
  • Table 27: Europe Market Value (USD Million) Forecast by Service Type, 2020-2035
  • Table 28: Europe Market Volume (Units) Forecast by Service Type, 2020-2035
  • Table 29: Europe Market Value (USD Million) Forecast by Customer Type, 2020-2035
  • Table 30: Europe Market Volume (Units) Forecast by Customer Type, 2020-2035
  • Table 31: Europe Market Value (USD Million) Forecast by Service Mode, 2020-2035
  • Table 32: Europe Market Volume (Units) Forecast by Service Mode, 2020-2035
  • Table 33: East Asia Market Value (USD Million) Forecast by Country, 2020-2035
  • Table 34: East Asia Market Volume (Units) Forecast by Country, 2020-2035
  • Table 35: East Asia Market Value (USD Million) Forecast by Service Type, 2020-2035
  • Table 36: East Asia Market Volume (Units) Forecast by Service Type, 2020-2035
  • Table 37: East Asia Market Value (USD Million) Forecast by Customer Type, 2020-2035
  • Table 38: East Asia Market Volume (Units) Forecast by Customer Type, 2020-2035
  • Table 39: East Asia Market Value (USD Million) Forecast by Service Mode, 2020-2035
  • Table 40: East Asia Market Volume (Units) Forecast by Service Mode, 2020-2035
  • Table 41: South Asia & Pacific Market Value (USD Million) Forecast by Country, 2020-2035
  • Table 42: South Asia & Pacific Market Volume (Units) Forecast by Country, 2020-2035
  • Table 43: South Asia & Pacific Market Value (USD Million) Forecast by Service Type, 2020-2035
  • Table 44: South Asia & Pacific Market Volume (Units) Forecast by Service Type, 2020-2035
  • Table 45: South Asia & Pacific Market Value (USD Million) Forecast by Customer Type, 2020-2035
  • Table 46: South Asia & Pacific Market Volume (Units) Forecast by Customer Type, 2020-2035
  • Table 47: South Asia & Pacific Market Value (USD Million) Forecast by Service Mode, 2020-2035
  • Table 48: South Asia & Pacific Market Volume (Units) Forecast by Service Mode, 2020-2035
  • Table 49: Middle East and Africa Market Value (USD Million) Forecast by Country, 2020-2035
  • Table 50: Middle East and Africa Market Volume (Units) Forecast by Country, 2020-2035
  • Table 51: Middle East and Africa Market Value (USD Million) Forecast by Service Type, 2020-2035
  • Table 52: Middle East and Africa Market Volume (Units) Forecast by Service Type, 2020-2035
  • Table 53: Middle East and Africa Market Value (USD Million) Forecast by Customer Type, 2020-2035
  • Table 54: Middle East and Africa Market Volume (Units) Forecast by Customer Type, 2020-2035
  • Table 55: Middle East and Africa Market Value (USD Million) Forecast by Service Mode, 2020-2035
  • Table 56: Middle East and Africa Market Volume (Units) Forecast by Service Mode, 2020-2035

List of Figures

  • Figure 1: Global Market Value (USD Million) by Service Type, 2025-2035
  • Figure 2: Global Market Value (USD Million) by Customer Type, 2025-2035
  • Figure 3: Global Market Value (USD Million) by Service Mode, 2025-2035
  • Figure 4: Global Market Value (USD Million) by Region, 2025-2035
  • Figure 5: Global Market Value (USD Million) Analysis by Region, 2020-2035
  • Figure 6: Global Market Volume (Units) Analysis by Region, 2020-2035
  • Figure 7: Global Market Value Share (%) and BPS Analysis by Region, 2025-2035
  • Figure 8: Global Market Y-o-Y Growth (%) Projections by Region, 2025-2035
  • Figure 9: Global Market Value (USD Million) Analysis by Service Type, 2020-2035
  • Figure 10: Global Market Volume (Units) Analysis by Service Type, 2020-2035
  • Figure 11: Global Market Value Share (%) and BPS Analysis by Service Type, 2025-2035
  • Figure 12: Global Market Y-o-Y Growth (%) Projections by Service Type, 2025-2035
  • Figure 13: Global Market Value (USD Million) Analysis by Customer Type, 2020-2035
  • Figure 14: Global Market Volume (Units) Analysis by Customer Type, 2020-2035
  • Figure 15: Global Market Value Share (%) and BPS Analysis by Customer Type, 2025-2035
  • Figure 16: Global Market Y-o-Y Growth (%) Projections by Customer Type, 2025-2035
  • Figure 17: Global Market Value (USD Million) Analysis by Service Mode, 2020-2035
  • Figure 18: Global Market Volume (Units) Analysis by Service Mode, 2020-2035
  • Figure 19: Global Market Value Share (%) and BPS Analysis by Service Mode, 2025-2035
  • Figure 20: Global Market Y-o-Y Growth (%) Projections by Service Mode, 2025-2035
  • Figure 21: Global Market Attractiveness by Service Type, 2025-2035
  • Figure 22: Global Market Attractiveness by Customer Type, 2025-2035
  • Figure 23: Global Market Attractiveness by Service Mode, 2025-2035
  • Figure 24: Global Market Attractiveness by Region, 2025-2035
  • Figure 25: North America Market Value (USD Million) by Service Type, 2025-2035
  • Figure 26: North America Market Value (USD Million) by Customer Type, 2025-2035
  • Figure 27: North America Market Value (USD Million) by Service Mode, 2025-2035
  • Figure 28: North America Market Value (USD Million) by Country, 2025-2035
  • Figure 29: North America Market Value (USD Million) Analysis by Country, 2020-2035
  • Figure 30: North America Market Volume (Units) Analysis by Country, 2020-2035
  • Figure 31: North America Market Value Share (%) and BPS Analysis by Country, 2025-2035
  • Figure 32: North America Market Y-o-Y Growth (%) Projections by Country, 2025-2035
  • Figure 33: North America Market Value (USD Million) Analysis by Service Type, 2020-2035
  • Figure 34: North America Market Volume (Units) Analysis by Service Type, 2020-2035
  • Figure 35: North America Market Value Share (%) and BPS Analysis by Service Type, 2025-2035
  • Figure 36: North America Market Y-o-Y Growth (%) Projections by Service Type, 2025-2035
  • Figure 37: North America Market Value (USD Million) Analysis by Customer Type, 2020-2035
  • Figure 38: North America Market Volume (Units) Analysis by Customer Type, 2020-2035
  • Figure 39: North America Market Value Share (%) and BPS Analysis by Customer Type, 2025-2035
  • Figure 40: North America Market Y-o-Y Growth (%) Projections by Customer Type, 2025-2035
  • Figure 41: North America Market Value (USD Million) Analysis by Service Mode, 2020-2035
  • Figure 42: North America Market Volume (Units) Analysis by Service Mode, 2020-2035
  • Figure 43: North America Market Value Share (%) and BPS Analysis by Service Mode, 2025-2035
  • Figure 44: North America Market Y-o-Y Growth (%) Projections by Service Mode, 2025-2035
  • Figure 45: North America Market Attractiveness by Service Type, 2025-2035
  • Figure 46: North America Market Attractiveness by Customer Type, 2025-2035
  • Figure 47: North America Market Attractiveness by Service Mode, 2025-2035
  • Figure 48: North America Market Attractiveness by Country, 2025-2035
  • Figure 49: Latin America Market Value (USD Million) by Service Type, 2025-2035
  • Figure 50: Latin America Market Value (USD Million) by Customer Type, 2025-2035
  • Figure 51: Latin America Market Value (USD Million) by Service Mode, 2025-2035
  • Figure 52: Latin America Market Value (USD Million) by Country, 2025-2035
  • Figure 53: Latin America Market Value (USD Million) Analysis by Country, 2020-2035
  • Figure 54: Latin America Market Volume (Units) Analysis by Country, 2020-2035
  • Figure 55: Latin America Market Value Share (%) and BPS Analysis by Country, 2025-2035
  • Figure 56: Latin America Market Y-o-Y Growth (%) Projections by Country, 2025-2035
  • Figure 57: Latin America Market Value (USD Million) Analysis by Service Type, 2020-2035
  • Figure 58: Latin America Market Volume (Units) Analysis by Service Type, 2020-2035
  • Figure 59: Latin America Market Value Share (%) and BPS Analysis by Service Type, 2025-2035
  • Figure 60: Latin America Market Y-o-Y Growth (%) Projections by Service Type, 2025-2035
  • Figure 61: Latin America Market Value (USD Million) Analysis by Customer Type, 2020-2035
  • Figure 62: Latin America Market Volume (Units) Analysis by Customer Type, 2020-2035
  • Figure 63: Latin America Market Value Share (%) and BPS Analysis by Customer Type, 2025-2035
  • Figure 64: Latin America Market Y-o-Y Growth (%) Projections by Customer Type, 2025-2035
  • Figure 65: Latin America Market Value (USD Million) Analysis by Service Mode, 2020-2035
  • Figure 66: Latin America Market Volume (Units) Analysis by Service Mode, 2020-2035
  • Figure 67: Latin America Market Value Share (%) and BPS Analysis by Service Mode, 2025-2035
  • Figure 68: Latin America Market Y-o-Y Growth (%) Projections by Service Mode, 2025-2035
  • Figure 69: Latin America Market Attractiveness by Service Type, 2025-2035
  • Figure 70: Latin America Market Attractiveness by Customer Type, 2025-2035
  • Figure 71: Latin America Market Attractiveness by Service Mode, 2025-2035
  • Figure 72: Latin America Market Attractiveness by Country, 2025-2035
  • Figure 73: Europe Market Value (USD Million) by Service Type, 2025-2035
  • Figure 74: Europe Market Value (USD Million) by Customer Type, 2025-2035
  • Figure 75: Europe Market Value (USD Million) by Service Mode, 2025-2035
  • Figure 76: Europe Market Value (USD Million) by Country, 2025-2035
  • Figure 77: Europe Market Value (USD Million) Analysis by Country, 2020-2035
  • Figure 78: Europe Market Volume (Units) Analysis by Country, 2020-2035
  • Figure 79: Europe Market Value Share (%) and BPS Analysis by Country, 2025-2035
  • Figure 80: Europe Market Y-o-Y Growth (%) Projections by Country, 2025-2035
  • Figure 81: Europe Market Value (USD Million) Analysis by Service Type, 2020-2035
  • Figure 82: Europe Market Volume (Units) Analysis by Service Type, 2020-2035
  • Figure 83: Europe Market Value Share (%) and BPS Analysis by Service Type, 2025-2035
  • Figure 84: Europe Market Y-o-Y Growth (%) Projections by Service Type, 2025-2035
  • Figure 85: Europe Market Value (USD Million) Analysis by Customer Type, 2020-2035
  • Figure 86: Europe Market Volume (Units) Analysis by Customer Type, 2020-2035
  • Figure 87: Europe Market Value Share (%) and BPS Analysis by Customer Type, 2025-2035
  • Figure 88: Europe Market Y-o-Y Growth (%) Projections by Customer Type, 2025-2035
  • Figure 89: Europe Market Value (USD Million) Analysis by Service Mode, 2020-2035
  • Figure 90: Europe Market Volume (Units) Analysis by Service Mode, 2020-2035
  • Figure 91: Europe Market Value Share (%) and BPS Analysis by Service Mode, 2025-2035
  • Figure 92: Europe Market Y-o-Y Growth (%) Projections by Service Mode, 2025-2035
  • Figure 93: Europe Market Attractiveness by Service Type, 2025-2035
  • Figure 94: Europe Market Attractiveness by Customer Type, 2025-2035
  • Figure 95: Europe Market Attractiveness by Service Mode, 2025-2035
  • Figure 96: Europe Market Attractiveness by Country, 2025-2035
  • Figure 97: East Asia Market Value (USD Million) by Service Type, 2025-2035
  • Figure 98: East Asia Market Value (USD Million) by Customer Type, 2025-2035
  • Figure 99: East Asia Market Value (USD Million) by Service Mode, 2025-2035
  • Figure 100: East Asia Market Value (USD Million) by Country, 2025-2035
  • Figure 101: East Asia Market Value (USD Million) Analysis by Country, 2020-2035
  • Figure 102: East Asia Market Volume (Units) Analysis by Country, 2020-2035
  • Figure 103: East Asia Market Value Share (%) and BPS Analysis by Country, 2025-2035
  • Figure 104: East Asia Market Y-o-Y Growth (%) Projections by Country, 2025-2035
  • Figure 105: East Asia Market Value (USD Million) Analysis by Service Type, 2020-2035
  • Figure 106: East Asia Market Volume (Units) Analysis by Service Type, 2020-2035
  • Figure 107: East Asia Market Value Share (%) and BPS Analysis by Service Type, 2025-2035
  • Figure 108: East Asia Market Y-o-Y Growth (%) Projections by Service Type, 2025-2035
  • Figure 109: East Asia Market Value (USD Million) Analysis by Customer Type, 2020-2035
  • Figure 110: East Asia Market Volume (Units) Analysis by Customer Type, 2020-2035
  • Figure 111: East Asia Market Value Share (%) and BPS Analysis by Customer Type, 2025-2035
  • Figure 112: East Asia Market Y-o-Y Growth (%) Projections by Customer Type, 2025-2035
  • Figure 113: East Asia Market Value (USD Million) Analysis by Service Mode, 2020-2035
  • Figure 114: East Asia Market Volume (Units) Analysis by Service Mode, 2020-2035
  • Figure 115: East Asia Market Value Share (%) and BPS Analysis by Service Mode, 2025-2035
  • Figure 116: East Asia Market Y-o-Y Growth (%) Projections by Service Mode, 2025-2035
  • Figure 117: East Asia Market Attractiveness by Service Type, 2025-2035
  • Figure 118: East Asia Market Attractiveness by Customer Type, 2025-2035
  • Figure 119: East Asia Market Attractiveness by Service Mode, 2025-2035
  • Figure 120: East Asia Market Attractiveness by Country, 2025-2035
  • Figure 121: South Asia & Pacific Market Value (USD Million) by Service Type, 2025-2035
  • Figure 122: South Asia & Pacific Market Value (USD Million) by Customer Type, 2025-2035
  • Figure 123: South Asia & Pacific Market Value (USD Million) by Service Mode, 2025-2035
  • Figure 124: South Asia & Pacific Market Value (USD Million) by Country, 2025-2035
  • Figure 125: South Asia & Pacific Market Value (USD Million) Analysis by Country, 2020-2035
  • Figure 126: South Asia & Pacific Market Volume (Units) Analysis by Country, 2020-2035
  • Figure 127: South Asia & Pacific Market Value Share (%) and BPS Analysis by Country, 2025-2035
  • Figure 128: South Asia & Pacific Market Y-o-Y Growth (%) Projections by Country, 2025-2035
  • Figure 129: South Asia & Pacific Market Value (USD Million) Analysis by Service Type, 2020-2035
  • Figure 130: South Asia & Pacific Market Volume (Units) Analysis by Service Type, 2020-2035
  • Figure 131: South Asia & Pacific Market Value Share (%) and BPS Analysis by Service Type, 2025-2035
  • Figure 132: South Asia & Pacific Market Y-o-Y Growth (%) Projections by Service Type, 2025-2035
  • Figure 133: South Asia & Pacific Market Value (USD Million) Analysis by Customer Type, 2020-2035
  • Figure 134: South Asia & Pacific Market Volume (Units) Analysis by Customer Type, 2020-2035
  • Figure 135: South Asia & Pacific Market Value Share (%) and BPS Analysis by Customer Type, 2025-2035
  • Figure 136: South Asia & Pacific Market Y-o-Y Growth (%) Projections by Customer Type, 2025-2035
  • Figure 137: South Asia & Pacific Market Value (USD Million) Analysis by Service Mode, 2020-2035
  • Figure 138: South Asia & Pacific Market Volume (Units) Analysis by Service Mode, 2020-2035
  • Figure 139: South Asia & Pacific Market Value Share (%) and BPS Analysis by Service Mode, 2025-2035
  • Figure 140: South Asia & Pacific Market Y-o-Y Growth (%) Projections by Service Mode, 2025-2035
  • Figure 141: South Asia & Pacific Market Attractiveness by Service Type, 2025-2035
  • Figure 142: South Asia & Pacific Market Attractiveness by Customer Type, 2025-2035
  • Figure 143: South Asia & Pacific Market Attractiveness by Service Mode, 2025-2035
  • Figure 144: South Asia & Pacific Market Attractiveness by Country, 2025-2035
  • Figure 145: Middle East and Africa Market Value (USD Million) by Service Type, 2025-2035
  • Figure 146: Middle East and Africa Market Value (USD Million) by Customer Type, 2025-2035
  • Figure 147: Middle East and Africa Market Value (USD Million) by Service Mode, 2025-2035
  • Figure 148: Middle East and Africa Market Value (USD Million) by Country, 2025-2035
  • Figure 149: Middle East and Africa Market Value (USD Million) Analysis by Country, 2020-2035
  • Figure 150: Middle East and Africa Market Volume (Units) Analysis by Country, 2020-2035
  • Figure 151: Middle East and Africa Market Value Share (%) and BPS Analysis by Country, 2025-2035
  • Figure 152: Middle East and Africa Market Y-o-Y Growth (%) Projections by Country, 2025-2035
  • Figure 153: Middle East and Africa Market Value (USD Million) Analysis by Service Type, 2020-2035
  • Figure 154: Middle East and Africa Market Volume (Units) Analysis by Service Type, 2020-2035
  • Figure 155: Middle East and Africa Market Value Share (%) and BPS Analysis by Service Type, 2025-2035
  • Figure 156: Middle East and Africa Market Y-o-Y Growth (%) Projections by Service Type, 2025-2035
  • Figure 157: Middle East and Africa Market Value (USD Million) Analysis by Customer Type, 2020-2035
  • Figure 158: Middle East and Africa Market Volume (Units) Analysis by Customer Type, 2020-2035
  • Figure 159: Middle East and Africa Market Value Share (%) and BPS Analysis by Customer Type, 2025-2035
  • Figure 160: Middle East and Africa Market Y-o-Y Growth (%) Projections by Customer Type, 2025-2035
  • Figure 161: Middle East and Africa Market Value (USD Million) Analysis by Service Mode, 2020-2035
  • Figure 162: Middle East and Africa Market Volume (Units) Analysis by Service Mode, 2020-2035
  • Figure 163: Middle East and Africa Market Value Share (%) and BPS Analysis by Service Mode, 2025-2035
  • Figure 164: Middle East and Africa Market Y-o-Y Growth (%) Projections by Service Mode, 2025-2035
  • Figure 165: Middle East and Africa Market Attractiveness by Service Type, 2025-2035
  • Figure 166: Middle East and Africa Market Attractiveness by Customer Type, 2025-2035
  • Figure 167: Middle East and Africa Market Attractiveness by Service Mode, 2025-2035
  • Figure 168: Middle East and Africa Market Attractiveness by Country, 2025-2035

Frequently Asked Questions

How big is the Plant Care Services Market in 2025?

The global Plant Care Services Market is estimated to be valued at USD 3,806.7 million in 2025.

What will be the size of Plant Care Services Market in 2035?

The market size for the Plant Care Services Market is projected to reach USD 9,620.6 million by 2035.

How much will be the Plant Care Services Market growth between 2025 and 2035?

The Plant Care Services Market is expected to grow at a 9.7% CAGR between 2025 and 2035.

What are the key service types in the Plant Care Services Market?

The key service types in the Plant Care Services Market are Plant watering & feeding, Pest/disease management, Repotting & soil services, Landscaping & aesthetic care, and Subscription plant care kits.

Which service mode segment to contribute significant share in the Plant Care Services Market in 2025?

In terms of service mode, On-site visits are projected to command a 65.1% share in the Plant Care Services Market in 2025.

Explore Similar Insights

Future Market Insights

Plant Care Services Market