Geriatric Care Services Market
Market Insights on Geriatric Care Services covering sales outlook, demand forecast & up-to-date key trends
Geriatric Care Services Market by Service, Payment Source, Application & Region - Forecast 2022 - 2032
Geriatric Care Services Market Outlook (2022-2032)
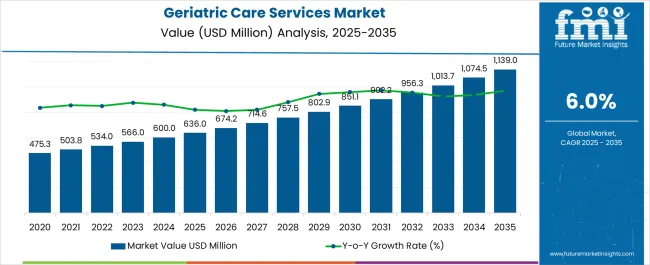
[300 Pages Report] The geriatric care services market is anticipated to document a CAGR of 6.0% during the period of 2022-2032. The Geriatric Care Services Market is anticipated to reach US$ 954 Million in 2032, from US$ 534 Million in 2022.
“Governments of various countries are taking several initiatives to provide easily accessible and affordable social care services to the elderly population. This, in confluence with the introduction of favorable reimbursement policies, is contributing to the market growth.”
Key factors such as the expanding geriatric population and the rising awareness regarding the healthcare facilities for senior patients are expected to propel the growth of the Geriatric Care Services Market during the forecast period.
Attributes |
Details |
Geriatric Care Services Market CAGR (2022 – 2032) |
6.0% |
Geriatric Care Services Market (2022) |
US$ 534 Million |
Geriatric Care Services Market (2032) |
US$ 954 Million |
Let us know your requirement to get
100% FREE customization
Prominent Geriatric Care Services Market Drivers
Growing Demand for Home Care Services for Elderly People
The growing demand for home care services for elderly people is a significant factor driving the Elderly Care Products and Services market during the forecast period. The growing elderly population coupled with the rising demand of services for individuals suffering from chronic diseases that are above the age of 60 worldwide will further fuel the market growth.
In addition, the presence of a wide range of services within the domain of healthcare has also brought elderly care under the spotlight of attention. The presence of a sound healthcare industry is a prerequisite to the success of a nation’s economy.
Considering the aforementioned factors, the global market for geriatric care services is projected to expand at a starry rate in the years to come. Moreover, an increase in the population globally has ensured higher elder care thereby, the market is anticipated to grow in the upcoming years.
Technological Advancement and Product Innovation
Technological advancement and product innovation are some other factors that are expected to accelerate the Geriatric Care Services Market during the analysis period. Increasing product innovation including gadgets for emergency assistance, remote monitoring devices and health monitoring wearable devices are increasing, which in turn helps to monitor the patient more efficiently with lesser effort.
In addition, new products such as grab bars, assistive sitting devices, toilet accessories and others are contributing to growth of the market.
Further, comorbidities such as diabetes, renal insufficiency and arthritis, and metabolic changes are quite common amongst the elderly population that makes them more susceptible to infection.
The combination of increased comorbid conditions and the decrease in activity of the immune system of elderly population is further driving the market for geriatric care services. Additionally, recent technological evolution in geriatric care services will benefit the growth of geriatric care services market in the upcoming years.
Key Challenges And Restraints Affecting The Geriatric Care Services Market Growth
Absence of Proper Geriatric Care Services in Developing Countries
The lack of proper geriatric care services in developing countries is another major factor that is expected to hamper the growth of the geriatric care services market in the long run.
Moreover, violence continues to occur and is most prevalent in emergency departments, behavioral health facilities, intensive care units, waiting rooms and geriatric care units. Approximately half of the nurses responding to a 2011 survey conducted by the Emergency Nurses Association (ENA) believe violence is simply part of their everyday work environment.
Between 8% and 13% of emergency room nurses are victims of physical violence every week. Thus, this violence can cause a bad shadow on Care services and people will not opt for them affecting the market growth.
Key Trends For Geriatric Care Services Market
Rising Awareness of Elderly Care to fuel Market Growth
The contemporary-day changes in the healthcare setup have largely aided the growth of the global geriatric care services market. Furthermore, the importance given to healthcare management in recent times has also led to advancements in the field of elderly care. The rising incidence of chronic diseases that persist until people become old has also created commendable market growth.
The need for a functional domain for elderly care has been rising over the past decade. Governments are making ardent efforts to improve the quality of life for the geriatric population.
There is little contention that the global geriatric care services market would witness paced growth in the years to come. The medical reimbursement policies for the elderly have been improving over the past couple of decades. This factor has played an integral role in the growth of the global geriatric care services market.
The need for establishing better values and standards for the treatment of elderly people has also aided growth. It is expected that increasing investments in healthcare would lead to the inflow of voluminous revenues into the global geriatric care services market.
Increase in demand and preference for home care will fuel the market growth
As per the American Geriatrics Society, home care is associated with longer life and a reduced risk of re-hospitalization that will result in fostering the geriatric care services market progression during the forecast period.
Home care service providing companies commonly work with families to make care plans for aged people. One of the advantages of hiring a home care company is its affordability along with caregiver that come on several days each week to assist seniors. Identifying the unmet care and support requirements of the geriatric population is becoming an urgent public health priority.
Find your sweet spots for generating winning opportunities in this market.
Talk to AnalystComparative Analysis Of The Adjacent Geriatric Care Services Market
Geriatric Care Services Market:
Attributes |
Geriatric Care Services Market |
CAGR (2022 - 2032) |
6.0% |
Market Value (2032) |
US$ 954 Billion |
Growth Factor |
A substantial increase in the geriatric population across the globe is expected to fuel the market growth. |
Opportunity |
The presence of various long-term care services providers coupled with favorable reimbursement policies are few factors expected to boost the growth of the geriatric care services market. |
Key Trends |
The widespread prevalence of chronic health conditions, such as diabetes, cardiovascular diseases (CVDs), high blood pressure, orthopedic disorders, and cancer, is another major growth-inducing factor for the market. |
Home Healthcare Market:
Attributes |
Home Healthcare Market |
CAGR (2022 - 2032) |
8.4% |
Market Value (2032) |
US$ 307.5 Billion |
Growth Factor |
Rapid growth in the elderly population is one of the major factors driving the market growth. |
Opportunity |
The rising incidence of chronic diseases, and technological advancements of home care devices are expected to fuel the market growth. |
Key Trends |
The growing need for cost-effective healthcare delivery due to the increasing healthcare costs will boost the market growth. |
Care Management Solutions Market:
Attributes |
Care Management Solutions Market |
CAGR (2022 - 2032) |
11.4% |
Market Value (2032) |
US$ 30.0 Billion |
Growth Factor |
The growth of this market is driven by the implementation of initiatives to shift the burden of risk from healthcare payers to providers, government initiatives and regulations promoting patient-centric care. |
Opportunity |
Rising geriatric population, and need to reduce healthcare costs are driving the growth of the care management solutions market. |
Key Trends |
Initiatives to promote healthcare IT is one of the major factors that is expected to fuel the market growth. |
Category Wise Analysis
Which Service will dominate the Geriatric Care Services Market?
Adult day care to witness considerable CAGR for the market growth
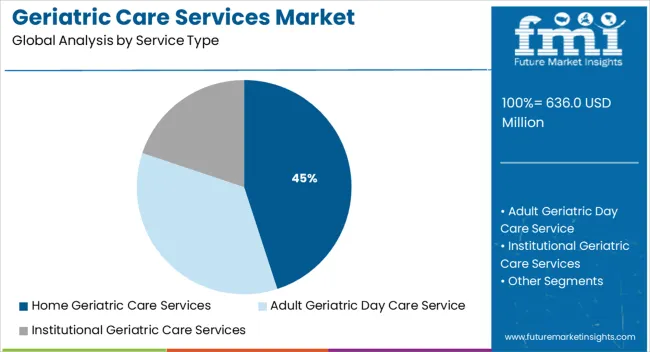
The adult day care segment of the geriatric care services market accounts for the highest CAGR of 6.9% during the forecast period, as the adult day care enables the elderly to stay at home and receive the whole day care without altering their lifestyles. Services include medical and non-medical services.
The rise in technological advancements in recent years has led to the launch of new products for self-monitoring, and multi-parameter diagnostic monitors. This resulted in a high demand for such diagnostic equipment for the adult day care, which in turn is driving the segment’s growth over the analysis period.
By Application, which category is expected to represent highest growth?
Diabetes likely to be the highest contributor to Market Growth
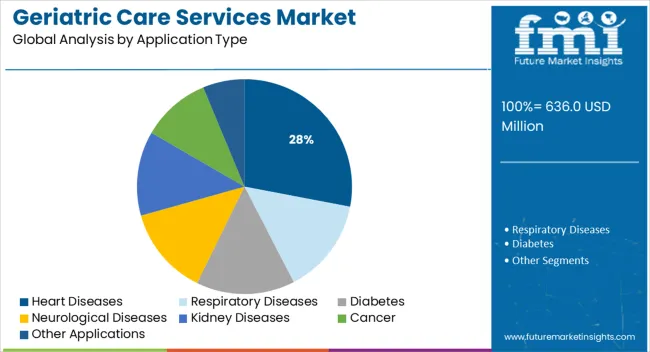
The diabetes segment of the geriatric care services market is expected to grow at the highest CAGR of 6.8% during the forecast period, attributed to the increasing number of diabetic patients.
Monitoring blood sugar at home helps arrive at an overall diabetes treatment plan and aids in managing the medications for blood sugar, diet, and exercise.

An unified Market Research Subscription Platform, built for today’s disparate research needs.
Region-Wise Analysis
How Opportunistic will the Market for Geriatric Care Services be across North America?
Converging trends of Aging Population to widen Scope of Market
North America holds dominant position in the global geriatric care service market, owing to increasing number of geriatric care agencies, converging trends of aging population, favorable reimbursement policies, and technological advancements.
According to the Centres for Disease Control and Prevention’s Estimates in 2014, a number of patients who received care worldwide was around 4.9 million in 2013, with 12,400 home healthcare agencies in the U.S.
The U.S is expected to hold a significant position in the global geriatric care services market, experiencing a CAGR of 6.9% during the forecast period, and is expected to reach a valuation of US$ 332.5 Million.
Will Asia-Pacific emerge as an attractive Geriatric Care Services Market?
Geriatric Care Services Market in the China to Witness Better Growth Opportunities
The Asia Pacific region is expected to grow at the highest CAGR during the forecast period, owing to the growing adoption of Geriatric Care Services. The number of older people in the Asia-Pacific region is growing at an unprecedented rate and it is at the forefront of the global phenomenon of aging population.
In addition, the growing life expectancy, declining fertility rates, and geriatric care services are the key drivers of aging population in some countries of the region. China is expected to represent the highest CAGR of 6.5% in the geriatric care services market during the forecast period, and is expected to reach at a valuation of US$ 68 Million.
Whereas, Japan is expected to represent the highest CAGR of 5.4% in the geriatric care services market during the forecast period, and is expected to reach at a valuation of US$ 54.9 Million.
Who are the Key Competitors in the Geriatric Care Services Market?
Endo Pharmaceuticals Inc., Merck & Co. Inc., AstraZeneca PLC, Pfizer Inc., Allergan Inc., Bristol-Myers Squibb Company, Regeneron Pharmaceuticals Inc., AstraZeneca PLC, F. Hoffmann-La Roche AG, Octapharma AG, Epoch Elder Care, St Luke's ElderCare Ltd., Korian Group, and ProVita International Medical Center, among others are the top companies in the global geriatric care services market.
With a sizable geriatric care services market share, these main firms are concentrating on growing their consumer base into new countries. These businesses are making use of strategic collaboration initiatives to grow their market share and profits.
Mid-size and smaller businesses, on the other hand, are expanding their market presence by gaining new contracts and entering new markets, thanks to technical developments and product innovations.
Recent Developments
- In March 2022, Alexion, AstraZeneca’s Rare Disease group, has closed an exclusive global collaboration and license agreement with Neurimmune AG for NI006, an investigational human monoclonal antibody currently in Phase Ib development for the treatment of transthyretin amyloid cardiomyopathy (ATTR-CM), an underdiagnosed, systemic condition that leads to progressive heart failure and high rate of fatality within four years from diagnosis.
- In January 2022, Century Therapeutics and Bristol Myers Squibb announced a research collaboration and license agreement (the “agreement”) to develop and commercialize up to four induced pluripotent stem cell (“iPSC”) derived, engineered natural killer cell (“iNK”) and / or T cell (“iT”) programs for hematologic malignancies and solid tumors. The first two programs include a program in acute myeloid leukemia and a program in multiple myeloma, which could incorporate either the iNK or a gamma delta iT platform. Bristol Myers Squibb has the option to add two additional programs which can be nominated subject to certain conditions agreed with Century in the agreement.
- In August 2020, Happiness Biotech Group Limited, an innovative China based nutraceutical and dietary supplements producer launched a new category of products in personal care segment under the new brand “Cai Zhi Ning” mainly targeting the elderly market.
By Key Players
- Endo Pharmaceuticals Inc.
- Merck & Co. Inc.
- AstraZeneca PLC
- Pfizer Inc.
- Allergan Inc.
- Bristol-Myers Squibb Company
- Regeneron Pharmaceuticals Inc.
- AstraZeneca PLC
- F. Hoffmann-La Roche AG
- Octapharma AG
- Epoch Elder Care
- St Luke's ElderCare Ltd.
- Korian Group
- ProVita International Medical Center
Key Segments Covered In The Geriatric Care Services Market Report
Geriatric Care Services Market by Service:
- Home Geriatric Care Services
- Adult Geriatric Day Care Service
- Institutional Geriatric Care Services
Geriatric Care Services Market by Payment Source:
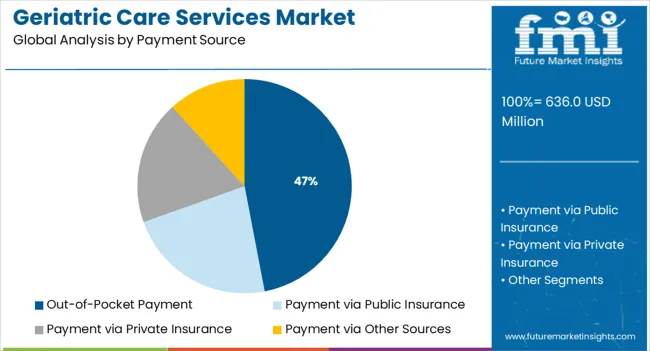
- Geriatric Care Services Payment via Public Insurance
- Geriatric Care Services Payment via Private Insurance
- Out-of-Pocket Geriatric Care Services Payment
- Geriatric Care Services Payment via Other Sources
Geriatric Care Services Market by Application:
- Geriatric Care Services for Respiratory Diseases
- Geriatric Care Services for Diabetes
- Geriatric Care Services for Heart Diseases
- Geriatric Care Services for Neurological Diseases
- Geriatric Care Services for Kidney Diseases
- Geriatric Care Services for Cancer
- Geriatric Care Services for Other Applications
Geriatric Care Services Market by Region:
- North America Geriatric Care Services Market
- Latin America Geriatric Care Services Market
- Europe Geriatric Care Services Market
- Asia Pacific Geriatric Care Services Market
- Middle East and Africa Geriatric Care Services Market
Frequently Asked Questions
As of 2021, the market for geriatric care services was valued at US$ 497.3 Million, as per FMI
By 2022-end, the market for geriatric care services closed at a value of US$ 534 Million
From 2017 to 2021, geriatric care services demand expanded at a CAGR of 10.5%
From 2022 to 2032, geriatric care services demand is expected to flourish at a CAGR of 6%
By 2032, the market value of geriatric care services is expected to reach US$ 954 Million
From 2022 to 2032, geriatric care services demand in the U.S is expected to surge at a CAGR of 6.9%
By service, the adult day care category constitutes the bulk of market share with a CAGR of 6.9%.
By application, the diabetes category of geriatric care services is expected to dominate the market with a CAGR of 6.8%.
1. Executive Summary
1.1. Global Market Outlook
1.2. Demand-side Trends
1.3. Supply-side Trends
1.4. Technology Roadmap Analysis
1.5. Analysis and Recommendations
2. Market Overview
2.1. Market Coverage / Taxonomy
2.2. Market Definition / Scope / Limitations
3. Market Background
3.1. Market Dynamics
3.1.1. Drivers
3.1.2. Restraints
3.1.3. Opportunity
3.1.4. Trends
3.2. Scenario Forecast
3.2.1. Demand in Optimistic Scenario
3.2.2. Demand in Likely Scenario
3.2.3. Demand in Conservative Scenario
3.3. Opportunity Map Analysis
3.4. Product Life Cycle Analysis
3.5. Supply Chain Analysis
3.5.1. Supply Side Participants and their Roles
3.5.2. Value Added and Value Created at Node in the Supply Chain
3.5.3. List of Raw Material Suppliers
3.5.4. List of Existing and Potential Buyer’s
3.6. Investment Feasibility Matrix
3.7. Value Chain Analysis
3.7.1. Profit Margin Analysis
3.7.2. Wholesalers and Distributors
3.7.3. Retailers
3.8. PESTLE and Porter’s Analysis
3.9. Regulatory Landscape
3.9.1. By Key Regions
3.9.2. By Key Countries
3.10. Regional Parent Market Outlook
3.11. Production and Consumption Statistics
3.12. Import and Export Statistics
4. Global Geriatric Care Services Market Analysis 2017-2021 and Forecast, 2022-2032
4.1. Historical Market Size Value (US$ Mn) Analysis, 2017-2021
4.2. Current and Future Market Size Value (US$ Mn) Projections, 2022-2032
4.2.1. Y-o-Y Growth Trend Analysis
4.2.2. Absolute $ Opportunity Analysis
5. Global Geriatric Care Services Market Analysis 2017-2021 and Forecast 2022-2032, By Service
5.1. Introduction / Key Findings
5.2. Historical Market Size Value (US$ Mn) Analysis By Service , 2017-2021
5.3. Current and Future Market Size Value (US$ Mn) Analysis and Forecast By Service , 2022-2032
5.3.1. Home Care
5.3.2. Adult Day Care
5.3.3. Institutional Care
5.4. Y-o-Y Growth Trend Analysis By Service , 2017-2021
5.5. Absolute $ Opportunity Analysis By Service , 2022-2032
6. Global Geriatric Care Services Market Analysis 2017-2021 and Forecast 2022-2032, By Payment Source
6.1. Introduction / Key Findings
6.2. Historical Market Size Value (US$ Mn) Analysis By Payment Source, 2017-2021
6.3. Current and Future Market Size Value (US$ Mn) Analysis and Forecast By Payment Source, 2022-2032
6.3.1. Public Insurance
6.3.2. Private Insurance
6.3.3. Out-of-pocket
6.3.4. Others
6.4. Y-o-Y Growth Trend Analysis By Payment Source, 2017-2021
6.5. Absolute $ Opportunity Analysis By Payment Source, 2022-2032
7. Global Geriatric Care Services Market Analysis 2017-2021 and Forecast 2022-2032, By Application
7.1. Introduction / Key Findings
7.2. Historical Market Size Value (US$ Mn) Analysis By Application, 2017-2021
7.3. Current and Future Market Size Value (US$ Mn) Analysis and Forecast By Application, 2022-2032
7.3.1. Respiratory Diseases
7.3.2. Diabetes
7.3.3. Heart Diseases
7.3.4. Neurological Diseases
7.3.5. Kidney Diseases
7.3.6. Cancer
7.3.7. Others
7.4. Y-o-Y Growth Trend Analysis By Application, 2017-2021
7.5. Absolute $ Opportunity Analysis By Application, 2022-2032
8. Global Geriatric Care Services Market Analysis 2017-2021 and Forecast 2022-2032, By Region
8.1. Introduction
8.2. Historical Market Size Value (US$ Mn) Analysis By Region, 2017-2021
8.3. Current Market Size Value (US$ Mn) Analysis and Forecast By Region, 2022-2032
8.3.1. North America
8.3.2. Latin America
8.3.3. Europe
8.3.4. Asia Pacific
8.3.5. Middle East and Africa
8.4. Market Attractiveness Analysis By Region
9. North America Geriatric Care Services Market Analysis 2017-2021 and Forecast 2022-2032, By Country
9.1. Historical Market Size Value (US$ Mn) Trend Analysis By Market Taxonomy, 2017-2021
9.2. Market Size Value (US$ Mn) Forecast By Market Taxonomy, 2022-2032
9.2.1. By Country
9.2.1.1. U.S.
9.2.1.2. Canada
9.2.1.3. Rest of North America
9.2.2. By Service
9.2.3. By Payment Source
9.2.4. By Application
9.3. Market Attractiveness Analysis
9.3.1. By Country
9.3.2. By Service
9.3.3. By Payment Source
9.3.4. By Application
9.4. Key Takeaways
10. Latin America Geriatric Care Services Market Analysis 2017-2021 and Forecast 2022-2032, By Country
10.1. Historical Market Size Value (US$ Mn) Trend Analysis By Market Taxonomy, 2017-2021
10.2. Market Size Value (US$ Mn) Forecast By Market Taxonomy, 2022-2032
10.2.1. By Country
10.2.1.1. Brazil
10.2.1.2. Mexico
10.2.1.3. Rest of Latin America
10.2.2. By Service
10.2.3. By Payment Source
10.2.4. By Application
10.3. Market Attractiveness Analysis
10.3.1. By Country
10.3.2. By Service
10.3.3. By Payment Source
10.3.4. By Application
10.4. Key Takeaways
11. Europe Geriatric Care Services Market Analysis 2017-2021 and Forecast 2022-2032, By Country
11.1. Historical Market Size Value (US$ Mn) Trend Analysis By Market Taxonomy, 2017-2021
11.2. Market Size Value (US$ Mn) Forecast By Market Taxonomy, 2022-2032
11.2.1. By Country
11.2.1.1. Germany
11.2.1.2. Italy
11.2.1.3. France
11.2.1.4. U.K.
11.2.1.5. Spain
11.2.1.6. Russia
11.2.1.7. BENELUX
11.2.1.8. Rest of Europe
11.2.2. By Service
11.2.3. By Payment Source
11.2.4. By Application
11.3. Market Attractiveness Analysis
11.3.1. By Country
11.3.2. By Service
11.3.3. By Payment Source
11.3.4. By Application
11.4. Key Takeaways
12. Asia Pacific Geriatric Care Services Market Analysis 2017-2021 and Forecast 2022-2032, By Country
12.1. Historical Market Size Value (US$ Mn) Trend Analysis By Market Taxonomy, 2017-2021
12.2. Market Size Value (US$ Mn) Forecast By Market Taxonomy, 2022-2032
12.2.1. By Country
12.2.1.1. China
12.2.1.2. Japan
12.2.1.3. South Korea
12.2.1.4. Rest of Asia Pacific
12.2.2. By Service
12.2.3. By Payment Source
12.2.4. By Application
12.3. Market Attractiveness Analysis
12.3.1. By Country
12.3.2. By Service
12.3.3. By Payment Source
12.3.4. By Application
12.4. Key Takeaways
13. Middle East and Africa Geriatric Care Services Market Analysis 2017-2021 and Forecast 2022-2032, By Country
13.1. Historical Market Size Value (US$ Mn) Trend Analysis By Market Taxonomy, 2017-2021
13.2. Market Size Value (US$ Mn) Forecast By Market Taxonomy, 2022-2032
13.2.1. By Country
13.2.1.1. GCC Countries
13.2.1.2. South Africa
13.2.1.3. Turkey
13.2.1.4. Rest of Middle East and Africa
13.2.2. By Service
13.2.3. By Payment Source
13.2.4. By Application
13.3. Market Attractiveness Analysis
13.3.1. By Country
13.3.2. By Service
13.3.3. By Payment Source
13.3.4. By Application
13.4. Key Takeaways
14. Key Countries Geriatric Care Services Market Analysis
14.1. U.S.
14.1.1. Pricing Analysis
14.1.2. Market Share Analysis, 2021
14.1.2.1. By Service
14.1.2.2. By Payment Source
14.1.2.3. By Application
14.2. Canada
14.2.1. Pricing Analysis
14.2.2. Market Share Analysis, 2021
14.2.2.1. By Service
14.2.2.2. By Payment Source
14.2.2.3. By Application
14.3. Brazil
14.3.1. Pricing Analysis
14.3.2. Market Share Analysis, 2021
14.3.2.1. By Service
14.3.2.2. By Payment Source
14.3.2.3. By Application
14.4. Mexico
14.4.1. Pricing Analysis
14.4.2. Market Share Analysis, 2021
14.4.2.1. By Service
14.4.2.2. By Payment Source
14.4.2.3. By Application
14.5. Germany
14.5.1. Pricing Analysis
14.5.2. Market Share Analysis, 2021
14.5.2.1. By Service
14.5.2.2. By Payment Source
14.5.2.3. By Application
14.6. Italy
14.6.1. Pricing Analysis
14.6.2. Market Share Analysis, 2021
14.6.2.1. By Service
14.6.2.2. By Payment Source
14.6.2.3. By Application
14.7. France
14.7.1. Pricing Analysis
14.7.2. Market Share Analysis, 2021
14.7.2.1. By Service
14.7.2.2. By Payment Source
14.7.2.3. By Application
14.8. U.K.
14.8.1. Pricing Analysis
14.8.2. Market Share Analysis, 2021
14.8.2.1. By Service
14.8.2.2. By Payment Source
14.8.2.3. By Application
14.9. Spain
14.9.1. Pricing Analysis
14.9.2. Market Share Analysis, 2021
14.9.2.1. By Service
14.9.2.2. By Payment Source
14.9.2.3. By Application
14.10. Russia
14.10.1. Pricing Analysis
14.10.2. Market Share Analysis, 2021
14.10.2.1. By Service
14.10.2.2. By Payment Source
14.10.2.3. By Application
14.11. BENELUX
14.11.1. Pricing Analysis
14.11.2. Market Share Analysis, 2021
14.11.2.1. By Service
14.11.2.2. By Payment Source
14.11.2.3. By Application
14.12. China
14.12.1. Pricing Analysis
14.12.2. Market Share Analysis, 2021
14.12.2.1. By Service
14.12.2.2. By Payment Source
14.12.2.3. By Application
14.13. Japan
14.13.1. Pricing Analysis
14.13.2. Market Share Analysis, 2021
14.13.2.1. By Service
14.13.2.2. By Payment Source
14.13.2.3. By Application
14.14. South Korea
14.14.1. Pricing Analysis
14.14.2. Market Share Analysis, 2021
14.14.2.1. By Service
14.14.2.2. By Payment Source
14.14.2.3. By Application
14.15. GCC Countries
14.15.1. Pricing Analysis
14.15.2. Market Share Analysis, 2021
14.15.2.1. By Service
14.15.2.2. By Payment Source
14.15.2.3. By Application
14.16. South Africa
14.16.1. Pricing Analysis
14.16.2. Market Share Analysis, 2021
14.16.2.1. By Service
14.16.2.2. By Payment Source
14.16.2.3. By Application
14.17. Turkey
14.17.1. Pricing Analysis
14.17.2. Market Share Analysis, 2021
14.17.2.1. By Service
14.17.2.2. By Payment Source
14.17.2.3. By Application
15. Market Structure Analysis
15.1. Competition Dashboard
15.2. Competition Benchmarking
15.3. Market Share Analysis of Top Players
15.3.1. By Regional
15.3.2. By Service
15.3.3. By Payment Source
15.3.4. By Application
16. Competition Analysis
16.1. Competition Deep Dive
16.1.1. Amedisys Inc
16.1.1.1. Overview
16.1.1.2. Product Portfolio
16.1.1.3. Profitability by Market Segments
16.1.1.4. Sales Footprint
16.1.1.5. Strategy Overview
16.1.1.5.1. Marketing Strategy
16.1.2. Brookdale Senior Living Inc
16.1.2.1. Overview
16.1.2.2. Product Portfolio
16.1.2.3. Profitability by Market Segments
16.1.2.4. Sales Footprint
16.1.2.5. Strategy Overview
16.1.2.5.1. Marketing Strategy
16.1.3. Econ Healthcare Group
16.1.3.1. Overview
16.1.3.2. Product Portfolio
16.1.3.3. Profitability by Market Segments
16.1.3.4. Sales Footprint
16.1.3.5. Strategy Overview
16.1.3.5.1. Marketing Strategy
16.1.4. Extendicare Inc
16.1.4.1. Overview
16.1.4.2. Product Portfolio
16.1.4.3. Profitability by Market Segments
16.1.4.4. Sales Footprint
16.1.4.5. Strategy Overview
16.1.4.5.1. Marketing Strategy
16.1.5. Genesis HealthCare
16.1.5.1. Overview
16.1.5.2. Product Portfolio
16.1.5.3. Profitability by Market Segments
16.1.5.4. Sales Footprint
16.1.5.5. Strategy Overview
16.1.5.5.1. Marketing Strategy
16.1.6. Home Instead Inc
16.1.6.1. Overview
16.1.6.2. Product Portfolio
16.1.6.3. Profitability by Market Segments
16.1.6.4. Sales Footprint
16.1.6.5. Strategy Overview
16.1.6.5.1. Marketing Strategy
16.1.7. Kindred Healthcare
16.1.7.1. Overview
16.1.7.2. Product Portfolio
16.1.7.3. Profitability by Market Segments
16.1.7.4. Sales Footprint
16.1.7.5. Strategy Overview
16.1.7.5.1. Marketing Strategy
16.1.8. Portea Medical
16.1.8.1. Overview
16.1.8.2. Product Portfolio
16.1.8.3. Profitability by Market Segments
16.1.8.4. Sales Footprint
16.1.8.5. Strategy Overview
16.1.8.5.1. Marketing Strategy
16.1.9. Revera Inc
16.1.9.1. Overview
16.1.9.2. Product Portfolio
16.1.9.3. Profitability by Market Segments
16.1.9.4. Sales Footprint
16.1.9.5. Strategy Overview
16.1.9.5.1. Marketing Strategy
16.1.10. Rosewood Care Group Inc
16.1.10.1. Overview
16.1.10.2. Product Portfolio
16.1.10.3. Profitability by Market Segments
16.1.10.4. Sales Footprint
16.1.10.5. Strategy Overview
16.1.10.5.1. Marketing Strategy
17. Assumptions & Acronyms Used
18. Research Methodology
Let us know your requirement to get
100% FREE customization
Table 01: Global Geriatric Care Services Market Value (US$ Mn) Forecast by Region, 2017-2032
Table 02: Global Geriatric Care Services Market Value (US$ Mn) Forecast by Service , 2017-2032
Table 03: Global Geriatric Care Services Market Value (US$ Mn) Forecast by Payment Source, 2017-2032
Table 04: Global Geriatric Care Services Market Value (US$ Mn) Forecast by Application, 2017-2032
Table 05: North America Geriatric Care Services Market Value (US$ Mn) Forecast by Country, 2017-2032
Table 06: North America Geriatric Care Services Market Value (US$ Mn) Forecast by Service , 2017-2032
Table 07: North America Geriatric Care Services Market Value (US$ Mn) Forecast by Payment Source, 2017-2032
Table 08: North America Geriatric Care Services Market Value (US$ Mn) Forecast by Application, 2017-2032
Table 09: Latin America Geriatric Care Services Market Value (US$ Mn) Forecast by Country, 2017-2032
Table 10: Latin America Geriatric Care Services Market Value (US$ Mn) Forecast by Service , 2017-2032
Table 11: Latin America Geriatric Care Services Market Value (US$ Mn) Forecast by Payment Source, 2017-2032
Table 12: Latin America Geriatric Care Services Market Value (US$ Mn) Forecast by Application, 2017-2032
Table 13: Europe Geriatric Care Services Market Value (US$ Mn) Forecast by Country, 2017-2032
Table 14: Europe Geriatric Care Services Market Value (US$ Mn) Forecast by Service , 2017-2032
Table 15: Europe Geriatric Care Services Market Value (US$ Mn) Forecast by Payment Source, 2017-2032
Table 16: Europe Geriatric Care Services Market Value (US$ Mn) Forecast by Application, 2017-2032
Table 17: Asia Pacific Geriatric Care Services Market Value (US$ Mn) Forecast by Country, 2017-2032
Table 18: Asia Pacific Geriatric Care Services Market Value (US$ Mn) Forecast by Service , 2017-2032
Table 19: Asia Pacific Geriatric Care Services Market Value (US$ Mn) Forecast by Payment Source, 2017-2032
Table 20: Asia Pacific Geriatric Care Services Market Value (US$ Mn) Forecast by Application, 2017-2032
Table 21: Middle East and Africa Geriatric Care Services Market Value (US$ Mn) Forecast by Country, 2017-2032
Table 22: Middle East and Africa Geriatric Care Services Market Value (US$ Mn) Forecast by Service , 2017-2032
Table 23: Middle East and Africa Geriatric Care Services Market Value (US$ Mn) Forecast by Payment Source, 2017-2032
Table 24: Middle East and Africa Geriatric Care Services Market Value (US$ Mn) Forecast by Application, 2017-2032
Find your sweet spots for generating winning opportunities in this market.
Talk to AnalystFigure 01: Global Geriatric Care Services Market Value (US$ Mn) by Service , 2022-2032
Figure 02: Global Geriatric Care Services Market Value (US$ Mn) by Payment Source, 2022-2032
Figure 03: Global Geriatric Care Services Market Value (US$ Mn) by Application, 2022-2032
Figure 04: Global Geriatric Care Services Market Value (US$ Mn) by Region, 2022-2032
Figure 05: Global Geriatric Care Services Market Value (US$ Mn) Analysis by Region, 2017-2032
Figure 06: Global Geriatric Care Services Market Value Share (%) and BPS Analysis by Region, 2022-2032
Figure 07: Global Geriatric Care Services Market Y-o-Y Growth (%) Projections by Region, 2022-2032
Figure 08: Global Geriatric Care Services Market Value (US$ Mn) Analysis by Service , 2017-2032
Figure 09: Global Geriatric Care Services Market Value Share (%) and BPS Analysis by Service , 2022-2032
Figure 10: Global Geriatric Care Services Market Y-o-Y Growth (%) Projections by Service , 2022-2032
Figure 11: Global Geriatric Care Services Market Value (US$ Mn) Analysis by Payment Source, 2017-2032
Figure 12: Global Geriatric Care Services Market Value Share (%) and BPS Analysis by Payment Source, 2022-2032
Figure 13: Global Geriatric Care Services Market Y-o-Y Growth (%) Projections by Payment Source, 2022-2032
Figure 14: Global Geriatric Care Services Market Value (US$ Mn) Analysis by Application, 2017-2032
Figure 15: Global Geriatric Care Services Market Value Share (%) and BPS Analysis by Application, 2022-2032
Figure 16: Global Geriatric Care Services Market Y-o-Y Growth (%) Projections by Application, 2022-2032
Figure 17: Global Geriatric Care Services Market Attractiveness by Service , 2022-2032
Figure 18: Global Geriatric Care Services Market Attractiveness by Payment Source, 2022-2032
Figure 19: Global Geriatric Care Services Market Attractiveness by Application, 2022-2032
Figure 20: Global Geriatric Care Services Market Attractiveness by Region, 2022-2032
Figure 21: North America Geriatric Care Services Market Value (US$ Mn) by Service , 2022-2032
Figure 22: North America Geriatric Care Services Market Value (US$ Mn) by Payment Source, 2022-2032
Figure 23: North America Geriatric Care Services Market Value (US$ Mn) by Application, 2022-2032
Figure 24: North America Geriatric Care Services Market Value (US$ Mn) by Country, 2022-2032
Figure 25: North America Geriatric Care Services Market Value (US$ Mn) Analysis by Country, 2017-2032
Figure 26: North America Geriatric Care Services Market Value Share (%) and BPS Analysis by Country, 2022-2032
Figure 27: North America Geriatric Care Services Market Y-o-Y Growth (%) Projections by Country, 2022-2032
Figure 28: North America Geriatric Care Services Market Value (US$ Mn) Analysis by Service , 2017-2032
Figure 29: North America Geriatric Care Services Market Value Share (%) and BPS Analysis by Service , 2022-2032
Figure 30: North America Geriatric Care Services Market Y-o-Y Growth (%) Projections by Service , 2022-2032
Figure 31: North America Geriatric Care Services Market Value (US$ Mn) Analysis by Payment Source, 2017-2032
Figure 32: North America Geriatric Care Services Market Value Share (%) and BPS Analysis by Payment Source, 2022-2032
Figure 33: North America Geriatric Care Services Market Y-o-Y Growth (%) Projections by Payment Source, 2022-2032
Figure 34: North America Geriatric Care Services Market Value (US$ Mn) Analysis by Application, 2017-2032
Figure 35: North America Geriatric Care Services Market Value Share (%) and BPS Analysis by Application, 2022-2032
Figure 36: North America Geriatric Care Services Market Y-o-Y Growth (%) Projections by Application, 2022-2032
Figure 37: North America Geriatric Care Services Market Attractiveness by Service , 2022-2032
Figure 38: North America Geriatric Care Services Market Attractiveness by Payment Source, 2022-2032
Figure 39: North America Geriatric Care Services Market Attractiveness by Application, 2022-2032
Figure 40: North America Geriatric Care Services Market Attractiveness by Country, 2022-2032
Figure 41: Latin America Geriatric Care Services Market Value (US$ Mn) by Service , 2022-2032
Figure 42: Latin America Geriatric Care Services Market Value (US$ Mn) by Payment Source, 2022-2032
Figure 43: Latin America Geriatric Care Services Market Value (US$ Mn) by Application, 2022-2032
Figure 44: Latin America Geriatric Care Services Market Value (US$ Mn) by Country, 2022-2032
Figure 45: Latin America Geriatric Care Services Market Value (US$ Mn) Analysis by Country, 2017-2032
Figure 46: Latin America Geriatric Care Services Market Value Share (%) and BPS Analysis by Country, 2022-2032
Figure 47: Latin America Geriatric Care Services Market Y-o-Y Growth (%) Projections by Country, 2022-2032
Figure 48: Latin America Geriatric Care Services Market Value (US$ Mn) Analysis by Service , 2017-2032
Figure 49: Latin America Geriatric Care Services Market Value Share (%) and BPS Analysis by Service , 2022-2032
Figure 50: Latin America Geriatric Care Services Market Y-o-Y Growth (%) Projections by Service , 2022-2032
Figure 51: Latin America Geriatric Care Services Market Value (US$ Mn) Analysis by Payment Source, 2017-2032
Figure 52: Latin America Geriatric Care Services Market Value Share (%) and BPS Analysis by Payment Source, 2022-2032
Figure 53: Latin America Geriatric Care Services Market Y-o-Y Growth (%) Projections by Payment Source, 2022-2032
Figure 54: Latin America Geriatric Care Services Market Value (US$ Mn) Analysis by Application, 2017-2032
Figure 55: Latin America Geriatric Care Services Market Value Share (%) and BPS Analysis by Application, 2022-2032
Figure 56: Latin America Geriatric Care Services Market Y-o-Y Growth (%) Projections by Application, 2022-2032
Figure 57: Latin America Geriatric Care Services Market Attractiveness by Service , 2022-2032
Figure 58: Latin America Geriatric Care Services Market Attractiveness by Payment Source, 2022-2032
Figure 59: Latin America Geriatric Care Services Market Attractiveness by Application, 2022-2032
Figure 60: Latin America Geriatric Care Services Market Attractiveness by Country, 2022-2032
Figure 61: Europe Geriatric Care Services Market Value (US$ Mn) by Service , 2022-2032
Figure 62: Europe Geriatric Care Services Market Value (US$ Mn) by Payment Source, 2022-2032
Figure 63: Europe Geriatric Care Services Market Value (US$ Mn) by Application, 2022-2032
Figure 64: Europe Geriatric Care Services Market Value (US$ Mn) by Country, 2022-2032
Figure 65: Europe Geriatric Care Services Market Value (US$ Mn) Analysis by Country, 2017-2032
Figure 66: Europe Geriatric Care Services Market Value Share (%) and BPS Analysis by Country, 2022-2032
Figure 67: Europe Geriatric Care Services Market Y-o-Y Growth (%) Projections by Country, 2022-2032
Figure 68: Europe Geriatric Care Services Market Value (US$ Mn) Analysis by Service , 2017-2032
Figure 69: Europe Geriatric Care Services Market Value Share (%) and BPS Analysis by Service , 2022-2032
Figure 70: Europe Geriatric Care Services Market Y-o-Y Growth (%) Projections by Service , 2022-2032
Figure 71: Europe Geriatric Care Services Market Value (US$ Mn) Analysis by Payment Source, 2017-2032
Figure 72: Europe Geriatric Care Services Market Value Share (%) and BPS Analysis by Payment Source, 2022-2032
Figure 73: Europe Geriatric Care Services Market Y-o-Y Growth (%) Projections by Payment Source, 2022-2032
Figure 74: Europe Geriatric Care Services Market Value (US$ Mn) Analysis by Application, 2017-2032
Figure 75: Europe Geriatric Care Services Market Value Share (%) and BPS Analysis by Application, 2022-2032
Figure 76: Europe Geriatric Care Services Market Y-o-Y Growth (%) Projections by Application, 2022-2032
Figure 77: Europe Geriatric Care Services Market Attractiveness by Service , 2022-2032
Figure 78: Europe Geriatric Care Services Market Attractiveness by Payment Source, 2022-2032
Figure 79: Europe Geriatric Care Services Market Attractiveness by Application, 2022-2032
Figure 80: Europe Geriatric Care Services Market Attractiveness by Country, 2022-2032
Figure 81: Asia Pacific Geriatric Care Services Market Value (US$ Mn) by Service , 2022-2032
Figure 82: Asia Pacific Geriatric Care Services Market Value (US$ Mn) by Payment Source, 2022-2032
Figure 83: Asia Pacific Geriatric Care Services Market Value (US$ Mn) by Application, 2022-2032
Figure 84: Asia Pacific Geriatric Care Services Market Value (US$ Mn) by Country, 2022-2032
Figure 85: Asia Pacific Geriatric Care Services Market Value (US$ Mn) Analysis by Country, 2017-2032
Figure 86: Asia Pacific Geriatric Care Services Market Value Share (%) and BPS Analysis by Country, 2022-2032
Figure 87: Asia Pacific Geriatric Care Services Market Y-o-Y Growth (%) Projections by Country, 2022-2032
Figure 88: Asia Pacific Geriatric Care Services Market Value (US$ Mn) Analysis by Service , 2017-2032
Figure 89: Asia Pacific Geriatric Care Services Market Value Share (%) and BPS Analysis by Service , 2022-2032
Figure 90: Asia Pacific Geriatric Care Services Market Y-o-Y Growth (%) Projections by Service , 2022-2032
Figure 91: Asia Pacific Geriatric Care Services Market Value (US$ Mn) Analysis by Payment Source, 2017-2032
Figure 92: Asia Pacific Geriatric Care Services Market Value Share (%) and BPS Analysis by Payment Source, 2022-2032
Figure 93: Asia Pacific Geriatric Care Services Market Y-o-Y Growth (%) Projections by Payment Source, 2022-2032
Figure 94: Asia Pacific Geriatric Care Services Market Value (US$ Mn) Analysis by Application, 2017-2032
Figure 95: Asia Pacific Geriatric Care Services Market Value Share (%) and BPS Analysis by Application, 2022-2032
Figure 96: Asia Pacific Geriatric Care Services Market Y-o-Y Growth (%) Projections by Application, 2022-2032
Figure 97: Asia Pacific Geriatric Care Services Market Attractiveness by Service , 2022-2032
Figure 98: Asia Pacific Geriatric Care Services Market Attractiveness by Payment Source, 2022-2032
Figure 99: Asia Pacific Geriatric Care Services Market Attractiveness by Application, 2022-2032
Figure 100: Asia Pacific Geriatric Care Services Market Attractiveness by Country, 2022-2032
Figure 101: Middle East and Africa Geriatric Care Services Market Value (US$ Mn) by Service , 2022-2032
Figure 102: Middle East and Africa Geriatric Care Services Market Value (US$ Mn) by Payment Source, 2022-2032
Figure 103: Middle East and Africa Geriatric Care Services Market Value (US$ Mn) by Application, 2022-2032
Figure 104: Middle East and Africa Geriatric Care Services Market Value (US$ Mn) by Country, 2022-2032
Figure 105: Middle East and Africa Geriatric Care Services Market Value (US$ Mn) Analysis by Country, 2017-2032
Figure 106: Middle East and Africa Geriatric Care Services Market Value Share (%) and BPS Analysis by Country, 2022-2032
Figure 107: Middle East and Africa Geriatric Care Services Market Y-o-Y Growth (%) Projections by Country, 2022-2032
Figure 108: Middle East and Africa Geriatric Care Services Market Value (US$ Mn) Analysis by Service , 2017-2032
Figure 109: Middle East and Africa Geriatric Care Services Market Value Share (%) and BPS Analysis by Service , 2022-2032
Figure 110: Middle East and Africa Geriatric Care Services Market Y-o-Y Growth (%) Projections by Service , 2022-2032
Figure 111: Middle East and Africa Geriatric Care Services Market Value (US$ Mn) Analysis by Payment Source, 2017-2032
Figure 112: Middle East and Africa Geriatric Care Services Market Value Share (%) and BPS Analysis by Payment Source, 2022-2032
Figure 113: Middle East and Africa Geriatric Care Services Market Y-o-Y Growth (%) Projections by Payment Source, 2022-2032
Figure 114: Middle East and Africa Geriatric Care Services Market Value (US$ Mn) Analysis by Application, 2017-2032
Figure 115: Middle East and Africa Geriatric Care Services Market Value Share (%) and BPS Analysis by Application, 2022-2032
Figure 116: Middle East and Africa Geriatric Care Services Market Y-o-Y Growth (%) Projections by Application, 2022-2032
Figure 117: Middle East and Africa Geriatric Care Services Market Attractiveness by Service , 2022-2032
Figure 118: Middle East and Africa Geriatric Care Services Market Attractiveness by Payment Source, 2022-2032
Figure 119: Middle East and Africa Geriatric Care Services Market Attractiveness by Application, 2022-2032
Figure 120: Middle East and Africa Geriatric Care Services Market Attractiveness by Country, 2022-2032
Need specific information?
Request CustomizationExplore Healthcare Insights
View Reports