Lip Care Market Size and Share Forecast Outlook 2025 to 2035

A valuation of USD 4,806.5 million has been projected for the lip care market in 2025, with the figure expected to advance to USD 10,904.3 million by 2035. This rise of over USD 6,000 million reflects a near doubling of market size within a decade, supported by a CAGR of 8.5%. The consistent growth trajectory highlights not only expanding consumer demand but also the deepening influence of wellness and skincare integration into daily routines.
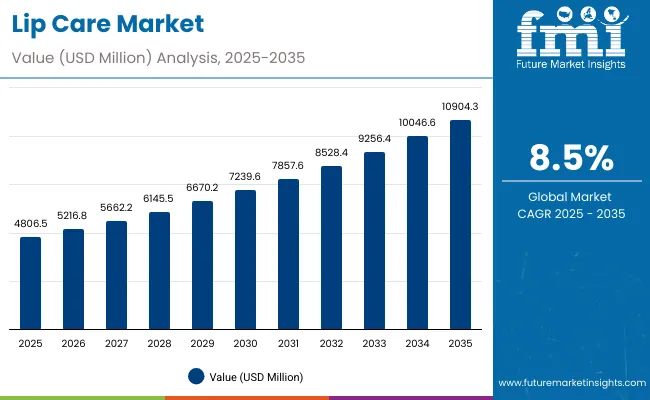
Quick Stats for Lip Care Market

  • Lip Care Market Value (2025): USD 4,806.5 million
  • Lip Care Market Forecast Value (2035): USD 10,904.3 million
  • Lip Care Market Forecast CAGR (2025 to 2035): 8.5%
  • Leading Segment in Lip Care Market (2025): Repair and Healing Function (53.0%)
  • Key Growth Regions in Lip Care Market: Asia-Pacific, North America, Europe
  • Top Key Players in Lip Care Market: Nivea, Maybelline, EOS, Carmex, Burt’s Bees, ChapStick, Vaseline, Laneige, Clinique, Fresh

Lip Care Market

Lip Care Market Key Takeaways

Metric Value
Lip Care Market Estimated Value in (2025E) USD 4,806.5 million
Lip Care Market Forecast Value in (2035F) USD 10,904.3 million
Forecast CAGR (2025 to 2035) 8.50%

From 2025 to 2030, the market is forecasted to move from USD 4,806.5 million to USD 7,239.6 million, contributing USD 2,433.1 million, which accounts for nearly 40% of the decade’s incremental growth. This period is expected to be shaped by rising adoption of moisturizing and repair-focused formulations, which address dryness and long-term lip health. Distribution through e-commerce platforms will strengthen this phase, enabling rapid reach among digital-first consumers.

The second half of the assessment, spanning 2030 to 2035, is anticipated to add USD 3,664.7 million, equivalent to nearly 60% of the decade’s expansion. The market is forecasted to leap from USD 7,239.6 million in 2030 to USD 10,904.3 million by 2035, fueled by accelerated premiumization, clean-label claims, and rising popularity of natural actives such as shea butter and beeswax. By function, repair and healing is projected to dominate with 53.0% share in 2025, while e-commerce is set to lead the distribution channels with 59.0%, reflecting shifting consumer purchasing behavior toward convenience-driven options.

From 2020 to 2024, steady progress was observed in the lip care industry, with demand influenced by heightened awareness of preventive skincare and increased product diversification. By 2025, the market is expected to reach USD 4,806.5 million, laying the foundation for accelerated growth. Over the next decade, value is forecasted to more than double, attaining USD 10,904.3 million by 2035. This expansion will be fueled by consumer preference for natural actives, dermatologist-tested claims, and e-commerce-led accessibility.

The competitive structure is anticipated to remain fragmented, with established brands such as Burt’s Bees and Nivea consolidating their positions, while digital-first and premium players intensify market rivalry. Differentiation is projected to be achieved not only through product innovation but also via sustainability-led packaging, clean-label formulations, and omnichannel strategies. Emerging entrants are expected to leverage niche opportunities in vegan and fragrance-free categories, reshaping the competitive advantage toward innovation ecosystems and consumer-driven personalization.

Why the Lip Care Market is growing?

Growth of the lip care market is being propelled by rising awareness of preventive skincare and the essential role of lip health in overall beauty routines. Demand is being stimulated by consumer preference for natural and organic ingredients, as shea butter, beeswax, and plant oils are increasingly being integrated into formulations. Expansion of e-commerce platforms has enabled broader accessibility, allowing premium, vegan, and fragrance-free options to reach global audiences more effectively.

Urbanization and lifestyle shifts have elevated the incidence of dryness and environmental damage, leading to heightened demand for repair and healing solutions, which dominate the functional category. Innovation in clean-label and dermatologist-tested products is anticipated to strengthen consumer trust, particularly across Asia-Pacific and Europe. Sustainability-driven packaging and premium positioning are expected to further enhance adoption. With younger demographics embracing digital-first shopping and premium wellness products, the market is projected to sustain robust momentum over the forecast period.

Segmental Analysis

The lip care market is segmented by product type, function, and active ingredient, highlighting the diverse factors shaping consumer adoption. Product types such as balms and other advanced formats capture distinct usage preferences, while functions like moisturizing and repair define the value proposition for different consumer needs. Active ingredient selection, ranging from shea butter to beeswax and plant oils, reflects growing demand for natural, effective, and safe solutions. Together, these segments illustrate how evolving beauty trends, health awareness, and sustainability considerations are expected to reshape the market outlook across the forecast period.
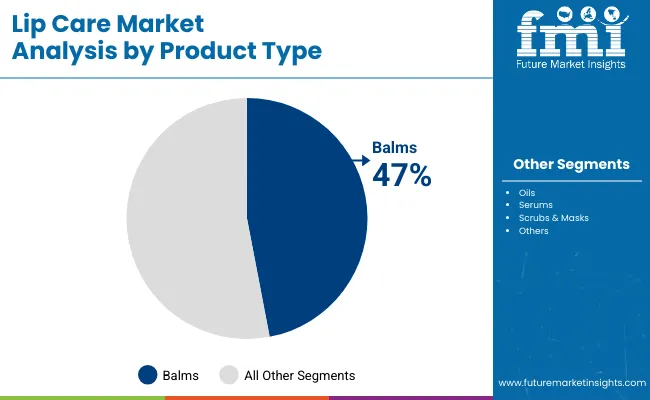
Insights into the Product Type Segment with Balms and Others Shaping Market Share

Lip Care Market By Product

Product Type Market Value Share, 2025
Balms 47%
Others 53.0%

Balms are projected to hold 47.0% share in 2025 with USD 588.9 million, while the "others" category is expected to dominate with 53.0% share, equivalent to USD 2,547.45 million. The preference for balms will be supported by their simplicity and daily-use nature, while diversified offerings including oils, serums, and scrubs are forecasted to accelerate growth. Functional innovation and premium positioning are anticipated to strengthen the "others" segment, with consumers seeking multi-benefit and natural-based formulations. Increasing demand for targeted solutions such as serums and overnight masks is likely to diversify this segment further. Over the decade, the balance between traditional balm formats and advanced product innovations is expected to define long-term value creation.
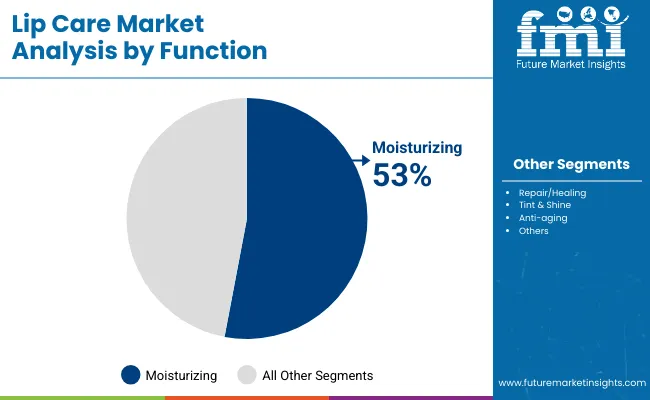
Insights into the Function Segment with Moisturizing Leading Adoption

Lip Care Market By Function

Function Market Value Share, 2025
Moisturizing 53%
Others 47.0%

Moisturizing is forecasted to dominate the function segment with 53.0% share in 2025, valued at USD 566.7 million, while the "others" group will capture 47.0% share, equal to USD 2,259.06 million. The dominance of moisturizing is expected to be reinforced by its core role in protecting against dryness and enhancing lip hydration. Increasing environmental stressors, such as urban pollution and weather fluctuations, are anticipated to keep moisturizing as the essential consumer choice. Meanwhile, the "others" category is projected to gain traction through claims of repair, tint, shine, and anti-aging, appealing to consumers who demand both aesthetics and wellness. This balance is forecasted to expand the functional diversity of lip care products, shaping strong future adoption.
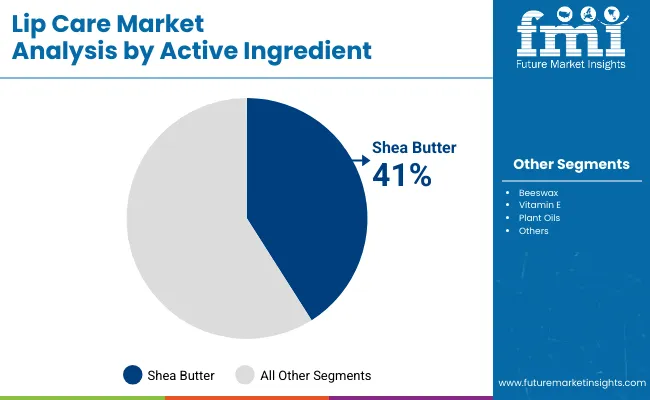
Insights into the Active Ingredient Segment with Shea Butter Driving Growth

Lip Care Market By Active Ingrediant

Active Ingredient Market Value Share, 2025
Shea butter 41%
Others 59.0%

Shea butter is projected to secure 41.0% share in 2025 with USD 533.3 million, while the "others" segment is expected to dominate with 59.0% share, amounting to USD 2,835.84 million. The popularity of shea butter will be sustained by its reputation for deep moisturization and natural healing, particularly appealing to premium and clean-label categories. The "others" segment, comprising beeswax, vitamin E, and plant oils, is forecasted to expand more strongly, driven by vegan, natural, and dermatologist-tested positioning. The ability of these ingredients to provide protective, reparative, and anti-aging benefits is anticipated to enhance consumer trust. Ingredient innovation, coupled with sustainability in sourcing, is projected to shape the competitive edge in this segment.

What are the Drivers, Restraints, and Key Trends of the Lip Care Market?

Intensified consumer emphasis on wellness, natural formulations, and digital accessibility has been observed as key factors shaping the lip care market, although constraints linked to cost-sensitive markets and sustainability expectations continue to challenge consistent adoption across regions.

Digital-First Retail Transformation

Expansion of digital ecosystems is expected to redefine how lip care products are purchased, experienced, and recommended. The rise of algorithm-driven personalization in e-commerce and mobile applications has allowed lip care offerings to be curated according to consumer profiles, climate conditions, and lifestyle preferences. Subscription-based models, dynamic bundling, and virtual try-on technologies are anticipated to accelerate discovery and repeat purchases.

This transformation is not only reshaping sales channels but also building direct-to-consumer intimacy, enabling premium and niche players to capture traction beyond physical retail limitations. The structural shift towards digital-first engagement is projected to create a differentiated growth trajectory, as purchasing power increasingly consolidates online, where transparency, peer validation, and instant gratification dominate decision-making.

Sustainability and Packaging Complexity

Sustainability expectations have emerged as both a driver of innovation and a restraint on scalability. Although recyclable and biodegradable packaging solutions are being pursued, significant cost and infrastructure challenges are limiting widespread implementation. Regulatory tightening in regions such as Europe and North America is anticipated to increase compliance burdens, particularly for mass-market producers.

At the same time, consumers are increasingly discerning about lifecycle impacts, pushing brands to align packaging with eco-conscious values without compromising performance or affordability. This dual pressure has created a structural restraint, as failure to align sustainability with scale risks reputational setbacks and erodes brand trust. The inability to harmonize functionality, safety, and eco-compliance is projected to delay adoption in cost-sensitive markets, slowing the pace of industry-wide transition.
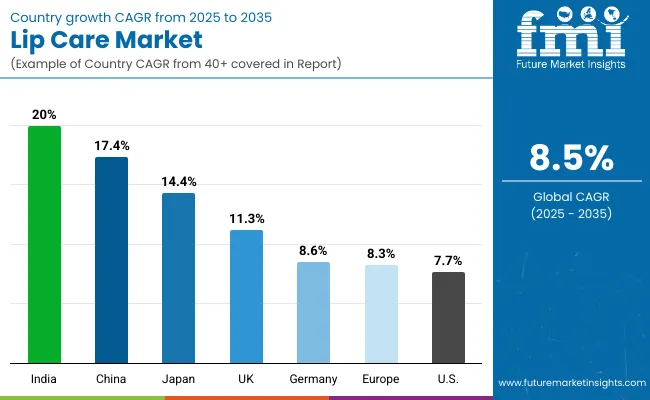
Analysis of Lip Care Market By Key Countries

Lip Care Market By Country

Countries CAGR
China 17.4%
USA 7.7%
India 20.0%
UK 11.3%
Germany 8.6%
Japan 14.4%

The global lip care market demonstrates clear country-level variations in growth, influenced by consumer behavior, regulatory frameworks, and evolving lifestyle dynamics. Asia-Pacific is expected to emerge as the fastest-expanding region, anchored by India with a CAGR of 20.0% and China with 17.4%. India’s rapid momentum is projected to be reinforced by increasing urbanization, rising demand for dermatologist-tested and fragrance-free formulations, and widespread digital adoption that brings premium products within consumer reach. China’s strong performance is anticipated to be supported by growing preference for natural and organic lip care, along with a rising middle-class population willing to pay for premium and eco-conscious brands.

Japan, with a CAGR of 14.4%, is forecasted to remain a sophisticated market where beauty-conscious consumers will drive uptake of multifunctional and advanced formulations. In Europe, the UK is projected to grow at 11.3%, while Germany is expected to expand at 8.6%, with clean-label regulations and sustainability mandates acting as catalysts for adoption. The USA is estimated to record a relatively moderate CAGR of 7.7%, reflecting maturity in consumer penetration yet steady expansion through e-commerce-led convenience and premiumization trends. These disparities highlight how regional dynamics will shape strategic opportunities for global and regional players across the forecast horizon.
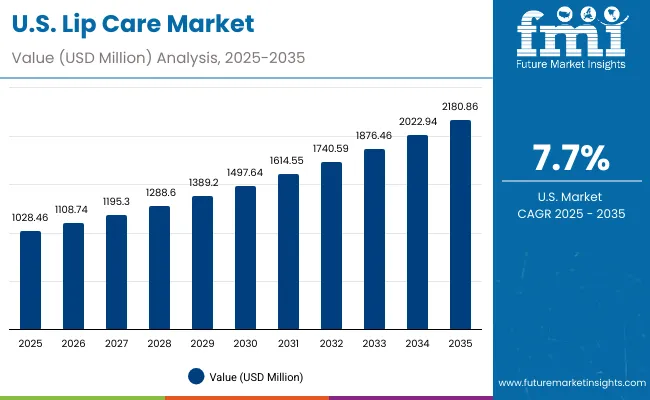
Sales Outlook for Lip Care in the United States

Lip Care Market Usa

Year USA Lip Care Market (USD Million)
2025 1,028.46
2026 1,108.74
2027 1,195.30
2028 1,288.60
2029 1,389.20
2030 1,497.64
2031 1,614.55
2032 1,740.59
2033 1,876.46
2034 2,022.94
2035 2,180.86

The lip care market in the United States is forecasted to grow at a CAGR of 7.7% from 2025 to 2035, expanding from USD 1,028.46 million to USD 2,180.86 million. Growth is anticipated to be reinforced by increasing consumer preference for clean-label and dermatologist-tested formulations, particularly those addressing hydration, repair, and anti-aging needs. E-commerce penetration and the popularity of subscription-based beauty boxes are expected to accelerate product accessibility and brand diversification. Premiumization trends, along with sustainability-focused packaging, are forecasted to shape consumer loyalty in an already mature market.

  • Moisturizing and repair-focused solutions are expected to remain central to demand.
  • Digital-first retail strategies and sustainability-led packaging innovations are projected to elevate adoption.

Growth and Expansion Outlook for Lip Care Market in the United Kingdom

The lip care market in the United Kingdom is projected to expand at a CAGR of 11.3% during 2025-2035, supported by increasing demand for dermatologist-tested and premium formulations. Value creation is expected to be strongly tied to clean-label compliance, where regulatory mandates encourage safer and transparent ingredients. Consumer preference for multifunctional products addressing hydration and anti-aging is anticipated to reinforce innovation pipelines. E-commerce channels are forecasted to expand reach, particularly through beauty-specific online retailers and subscription services. Sustainability-led packaging and cruelty-free positioning are expected to elevate brand differentiation in a competitive landscape.

  • Dermatologist-tested and clean-label claims are anticipated to sustain long-term consumer trust.
  • E-commerce platforms are projected to drive faster adoption of premium brands.
  • Sustainability initiatives in packaging are expected to redefine competitive positioning.
  • Multifunctional products addressing aesthetics and repair are forecasted to capture growing demand.

Growth and Expansion Outlook for Lip Care Market in India

The lip care market in India is forecasted to record the highest CAGR globally at 20.0% during 2025-2035, reflecting robust expansion driven by urbanization, affordability, and rising skincare awareness. Growth is expected to be supported by demand for fragrance-free and dermatologist-tested products, aligning with increasing sensitivity to ingredient safety. Strong adoption of e-commerce platforms is anticipated to broaden product access, particularly in tier-2 and tier-3 cities. Premiumization trends, once limited to metropolitan markets, are projected to expand nationwide, reinforcing opportunities for both domestic and international players. Local ingredient sourcing and value-driven pricing strategies are forecasted to further accelerate penetration.

  • Dermatologist-tested and fragrance-free claims are expected to dominate demand patterns.
  • Rapid expansion of digital-first retail is anticipated to increase brand visibility.
  • Premiumization beyond metros is projected to broaden consumer reach.
  • Local sourcing and affordability are forecasted to reinforce market accessibility.

Sales Outlook for Lip Care in China

The lip care market in China is projected to expand at a CAGR of 17.4% from 2025 to 2035, supported by rising middle-class income levels and evolving consumer preferences toward natural and organic products. Expansion is expected to be reinforced by regulatory emphasis on safe, transparent ingredients and sustainability-led packaging. Widespread adoption of digital marketplaces, live-streaming channels, and social commerce is anticipated to accelerate brand penetration. Premium and imported lip care products are projected to gain traction among younger demographics, who associate wellness with status-driven consumption. Domestic players are expected to strengthen competitive positioning through cost-effective offerings aligned with traditional herbal actives.
  • Natural and organic lip care is forecasted to dominate consumer interest.
  • Social commerce and live-streaming platforms are expected to enhance adoption.
  • Premium and imported brands are projected to secure higher growth among youth.
  • Domestic innovation leveraging herbal actives is anticipated to strengthen competitiveness.

In-depth Analysis of LIP CARE in Germany

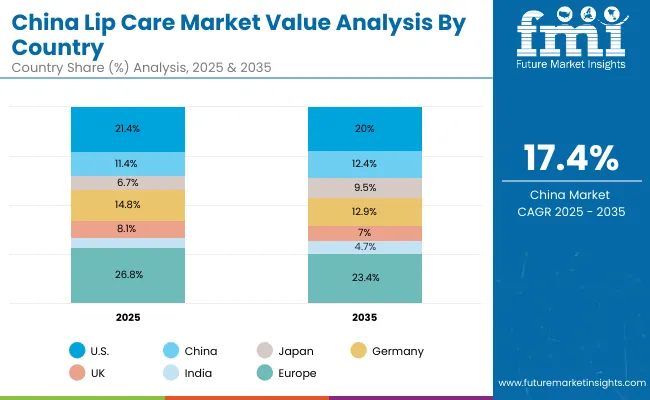
Lip Care Market China

Countries 2025
USA 21.4%
China 11.4%
Japan 6.7%
Germany 14.8%
UK 8.1%
India 5.1%
Countries 2035
USA 20.0%
China 12.4%
Japan 9.5%
Germany 12.9%
UK 7.0%
India 5.7%

The lip care market in Germany is expected to record a CAGR of 8.6% during 2025-2035, reflecting steady growth reinforced by sustainability mandates and high consumer awareness of ingredient safety. Demand is projected to be influenced by dermatologist-tested and fragrance-free claims, aligning with a mature beauty-conscious population. Growth in e-commerce platforms, particularly through direct-to-consumer and subscription-based models, is forecasted to expand convenience-driven adoption. Sustainability expectations are expected to play a decisive role, with eco-friendly packaging and vegan formulations shaping brand loyalty. Premium categories are anticipated to retain momentum, with multifunctional products delivering repair, hydration, and anti-aging benefits.
  • Dermatologist-tested and fragrance-free products are projected to lead adoption.
  • Sustainability and eco-friendly packaging are expected to drive loyalty.
  • Premium categories are forecasted to sustain momentum in mature markets.
  • E-commerce and subscription-based models are anticipated to accelerate convenience-driven sales.

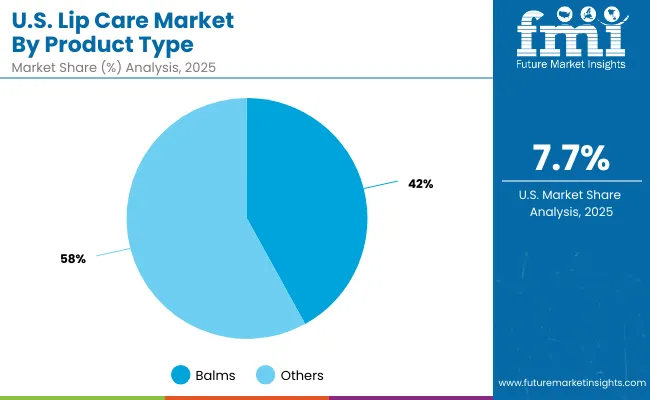
Growth Outlook for Lip Care Market in USA

Lip Care Market Usa 2

USA by product type Market Value Share, 2025
Balms 42%
Others 58.0%

The lip care market in the United States is projected at USD 1,028.46 million in 2025. Balms contribute 42.0%, while the "others" category holds 58.0%, underscoring consumer inclination toward diversified formats beyond traditional products. This preference reflects increasing interest in oils, serums, and scrubs that deliver multi-functional benefits, combining hydration with repair and aesthetic enhancement. The slight dominance of "others" signals a value transition as consumer priorities evolve toward personalized and premiumized options.

These products are anticipated to attract higher engagement in digital-first retail environments, where innovation and convenience drive purchasing decisions. Expanding penetration of clean-label and dermatologist-tested solutions is expected to further accelerate adoption of emerging product types. As health-conscious and sustainability-driven consumers seek greater functionality, the shift from single-use formats to advanced alternatives is projected to define the competitive structure of the USA market.
  • Market in the United States is valued at USD 1,028.46 million in 2025
  • Others segment leads balms at 58.0% vs 42.0%
  • Growth supported by multifunctional, premium, and dermatologist-tested innovations
  • Digital-first retail adoption is expected to amplify product diversification

Opportunity Analysis of China Lip Care Market

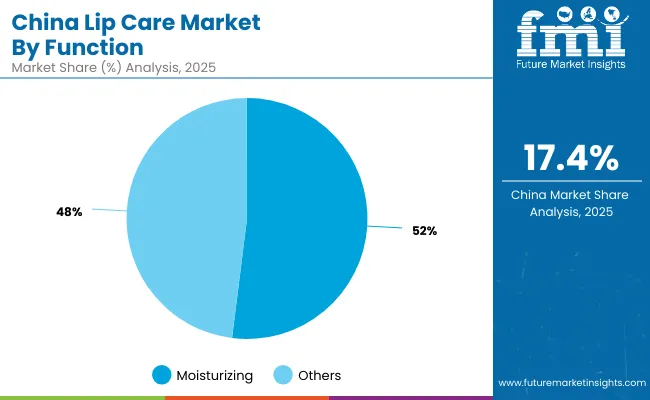
Lip Care Market China 2

China by Function Market Value Share, 2025
Moisturizing 52%
Others 48.0%

The lip care market in China is projected at USD 548.62 million in 2025. Moisturizing products contribute 52.0%, valued at USD 285.3 million, while the "others" segment holds 48.0%, equivalent to USD 263.34 million. The dominance of moisturizing products reflects heightened consumer focus on hydration and protection, particularly in urban regions where pollution and climate conditions elevate skin sensitivity.

The near balance between moisturizing and other functional categories signals strong diversification potential, with repair, tint, shine, and anti-aging attributes expected to gain traction among younger demographics. Digital-first retail ecosystems, including social commerce and live-streaming platforms, are anticipated to accelerate awareness and adoption of these functional innovations. As clean-label claims and natural actives gain momentum, function-based differentiation is projected to remain a decisive growth driver across China’s evolving beauty landscape.
  • Market in China is projected at USD 548.62 million in 2025
  • Moisturizing leads with 52.0% share against 48.0% for others
  • Urbanization and pollution-driven skincare concerns are expected to sustain demand
  • Social commerce and digital ecosystems are projected to expand functional adoption

Competitive Landscape of Lip Care Market

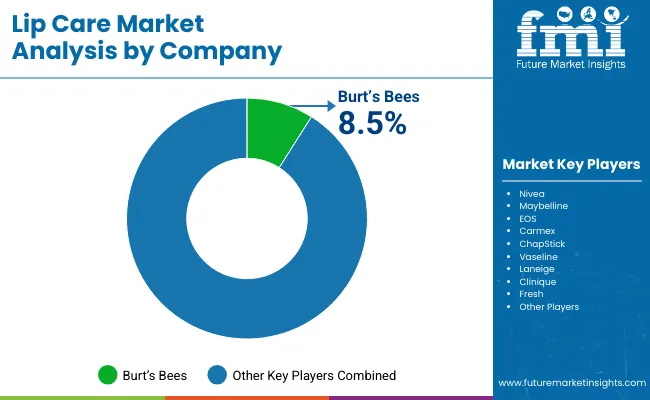
Lip Care Market By Company

The lip care market is moderately fragmented, with global brands, regional innovators, and niche-focused specialists competing for share across both mass and premium categories. Burt’s Bees holds the leading global share at 8.5% in 2025, positioning itself as the dominant player in the market. Its strength is anticipated to be reinforced by strong consumer loyalty toward natural and eco-conscious formulations, as well as investments in sustainable packaging. The remainder of the market, representing 91.5%, is distributed across a wide pool of multinational brands and emerging regional companies.

Established players such as Nivea, Maybelline, EOS, Carmex, Vaseline, Laneige, Clinique, and Fresh are expected to maintain significant presence, each leveraging distinct strategies in clean-label innovation, digital-first retail, and multifunctional product development. Regional specialists are projected to capitalize on local preferences for herbal actives, vegan positioning, and price-sensitive offerings, ensuring competitive intensity remains high.

Differentiation in this market is shifting away from basic hydration claims toward integrated value propositions combining repair, anti-aging, and premium aesthetics. Brands are anticipated to pursue omnichannel distribution, influencer-driven marketing, and sustainability-focused storytelling to build long-term equity. With consumer priorities aligning around wellness, personalization, and eco-friendly commitments, competition is projected to intensify further.

Key Developments in Lip Care Market

  • In May 2025, e.l.f. Beauty acquired Rhode (Hailey Bieber’s brand) for USD 1 billion. This transaction was followed by plans for Rhode to enter Sephora stores in the United States and UK later in 2025.
  • In July 2025, Sweet July by Ayesha Curry partnered with Garden Creamery to launch a tropical-flavored lip care line under the "Sweet July lip treatment" banner. The limited-edition product was designed to combine flavor appeal with treatment benefits, leveraging lifestyle branding and summer seasonality.

Scope of the Report

Item Value
Market Size & Forecast USD 4,806.5 million (2025); USD 10,904.3 million (2035); CAGR 8.5% (2025-2035)
Product Type Balms; Others (oils, serums, scrubs, masks)
Function Moisturizing; Repair/Healing; Tint & Shine; Anti-aging
Active Ingredient Shea butter; Beeswax; Vitamin E; Plant oils (coconut, almond, jojoba)
Distribution Channel Mass retail; E-commerce; Pharmacies; Specialty beauty retail
Claims Natural/organic; Vegan; Fragrance-free; Dermatologist-tested
Regions Covered North America; Europe; Asia-Pacific; Latin America; Middle East & Africa
Countries Covered United States; Canada; Germany; France; United Kingdom; China; Japan; India; Brazil; South Africa
Key Companies Profiled Burt’s Bees; Nivea; Maybelline; EOS; Carmex; ChapStick; Vaseline; Laneige; Clinique; Fresh
Competitive Share (Global, 2025) Burt’s Bees 8.5%; Others 91.5%
Country Growth Benchmarks (CAGR 2025-2035) India 20.0%; China 17.4%; Japan 14.4%; UK 11.3%; Germany 8.6%; USA 7.7%
USA Product Type Split (2025) Balms 42.0% (USD 432.0 million); Others 58.0% (USD 596.51 million)
China Function Split (2025) Moisturizing 52.0% (USD 285.3 million); Others 48.0% (USD 263.34 million)
Growth Drivers (Snapshot) Clean-label and dermatologist-tested preferences; premiumization; natural actives (shea butter, plant oils); e-commerce subscriptions and DTC expansion
Restraints (Snapshot) Sustainability and packaging cost trade-offs; price sensitivity in mass segments; compliance alignment across regions
Key Trends Multifunctional formulas (repair + tint/shine); eco-friendly packaging; influencer/social commerce; personalization via digital skin diagnostics
Additional Attributes Dollar sales by product type/function/channel; segmentation by claims; subscription/cohort retention metrics; sustainability impact tracking (recyclability, refill systems)

Key Segments

By Product Type:

  • Balms
  • Oils
  • Serums
  • Scrubs & masks

By Function:

  • Moisturizing
  • Repair/healing
  • Tint & shine
  • Anti-aging

By Active Ingredient:

  • Shea butter
  • Beeswax
  • Vitamin E
  • Plant oils (coconut, almond, jojoba)

By Channel:

  • Mass retail
  • E-commerce
  • Pharmacies
  • Specialty beauty retail

By Claim:

  • Natural/organic
  • Vegan
  • Fragrance-free
  • Dermatologist-tested

By Region:

  • North America
  • Latin America
  • Europe
  • East Asia
  • South Asia & Pacific
  • Middle East and Africa

Table of Content

  1. Executive Summary
    • Global Market Outlook
    • Demand-side Trends
    • Supply-side Trends
    • Technology Roadmap Analysis
    • Analysis and Recommendations
  2. Market Overview
    • Market Coverage / Taxonomy
    • Market Definition / Scope / Limitations
  3. Market Background
    • Market Dynamics
      • Drivers
      • Restraints
      • Opportunity
      • Trends
    • Scenario Forecast
      • Demand in Optimistic Scenario
      • Demand in Likely Scenario
      • Demand in Conservative Scenario
    • Opportunity Map Analysis
    • Product Life Cycle Analysis
    • Supply Chain Analysis
      • Supply Side Participants and their Roles
        • Producers
        • Mid-Level Participants (Traders/ Agents/ Brokers)
        • Wholesalers and Distributors
      • Value Added and Value Created at Node in the Supply Chain
      • List of Raw Material Suppliers
      • List of Existing and Potential Buyer’s
    • Investment Feasibility Matrix
    • Value Chain Analysis
      • Profit Margin Analysis
      • Wholesalers and Distributors
      • Retailers
    • PESTLE and Porter’s Analysis
    • Regulatory Landscape
      • By Key Regions
      • By Key Countries
    • Regional Parent Market Outlook
    • Production and Consumption Statistics
    • Import and Export Statistics
  4. Global Market Analysis 2020 to 2024 and Forecast, 2025 to 2035
    • Historical Market Size Value (USD Million) & Volume (Units) Analysis, 2020 to 2024
    • Current and Future Market Size Value (USD Million) & Volume (Units) Projections, 2025 to 2035
      • Y-o-Y Growth Trend Analysis
      • Absolute $ Opportunity Analysis
  5. Global Market Analysis 2020 to 2024 and Forecast 2025 to 2035, By Product Type
    • Introduction / Key Findings
    • Historical Market Size Value (USD Million) & Volume (Units) Analysis By Product Type, 2020 to 2024
    • Current and Future Market Size Value (USD Million) & Volume (Units) Analysis and Forecast By Product Type, 2025 to 2035
      • Balms
      • Oils
      • Serums
      • Scrubs & masks
    • Y-o-Y Growth Trend Analysis By Product Type, 2020 to 2024
    • Absolute $ Opportunity Analysis By Product Type, 2025 to 2035
  6. Global Market Analysis 2020 to 2024 and Forecast 2025 to 2035, By Function
    • Introduction / Key Findings
    • Historical Market Size Value (USD Million) & Volume (Units) Analysis By Function, 2020 to 2024
    • Current and Future Market Size Value (USD Million) & Volume (Units) Analysis and Forecast By Function, 2025 to 2035
      • Moisturizing
      • Repair/healing
      • Tint & shine
      • Anti-aging
    • Y-o-Y Growth Trend Analysis By Function, 2020 to 2024
    • Absolute $ Opportunity Analysis By Function, 2025 to 2035
  7. Global Market Analysis 2020 to 2024 and Forecast 2025 to 2035, By Active Ingredient
    • Introduction / Key Findings
    • Historical Market Size Value (USD Million) & Volume (Units) Analysis By Active Ingredient, 2020 to 2024
    • Current and Future Market Size Value (USD Million) & Volume (Units) Analysis and Forecast By Active Ingredient, 2025 to 2035
      • Shea butter
      • Beeswax
      • Vitamin E
      • Plant oils (coconut, almond, jojoba)
    • Y-o-Y Growth Trend Analysis By Active Ingredient, 2020 to 2024
    • Absolute $ Opportunity Analysis By Active Ingredient, 2025 to 2035
  8. Global Market Analysis 2020 to 2024 and Forecast 2025 to 2035, By Channel
    • Introduction / Key Findings
    • Historical Market Size Value (USD Million) & Volume (Units) Analysis By Channel, 2020 to 2024
    • Current and Future Market Size Value (USD Million) & Volume (Units) Analysis and Forecast By Channel, 2025 to 2035
      • Mass retail
      • E-commerce
      • Pharmacies
      • Specialty beauty retail
    • Y-o-Y Growth Trend Analysis By Channel, 2020 to 2024
    • Absolute $ Opportunity Analysis By Channel, 2025 to 2035
  9. Global Market Analysis 2020 to 2024 and Forecast 2025 to 2035, By Claim
    • Introduction / Key Findings
    • Historical Market Size Value (USD Million) & Volume (Units) Analysis By Claim, 2020 to 2024
    • Current and Future Market Size Value (USD Million) & Volume (Units) Analysis and Forecast By Claim, 2025 to 2035
      • Natural/organic
      • Vegan
      • Fragrance-free
      • Dermatologist-tested
    • Y-o-Y Growth Trend Analysis By Claim, 2020 to 2024
    • Absolute $ Opportunity Analysis By Claim, 2025 to 2035
  10. Global Market Analysis 2020 to 2024 and Forecast 2025 to 2035, By Region
    • Introduction
    • Historical Market Size Value (USD Million) & Volume (Units) Analysis By Region, 2020 to 2024
    • Current Market Size Value (USD Million) & Volume (Units) Analysis and Forecast By Region, 2025 to 2035
      • North America
      • Latin America
      • Europe
      • East Asia
      • South Asia & Pacific
      • Middle East and Africa
    • Market Attractiveness Analysis By Region
  11. North America Market Analysis 2020 to 2024 and Forecast 2025 to 2035, By Country
    • Historical Market Size Value (USD Million) & Volume (Units) Trend Analysis By Market Taxonomy, 2020 to 2024
    • Market Size Value (USD Million) & Volume (Units) Forecast By Market Taxonomy, 2025 to 2035
      • By Country
        • USA
        • Canada
      • By Product Type
      • By Function
      • By Active Ingredient
      • By Channel
      • By Claim
    • Market Attractiveness Analysis
      • By Country
      • By Product Type
      • By Function
      • By Active Ingredient
      • By Channel
      • By Claim
    • Key Takeaways
  12. Latin America Market Analysis 2020 to 2024 and Forecast 2025 to 2035, By Country
    • Historical Market Size Value (USD Million) & Volume (Units) Trend Analysis By Market Taxonomy, 2020 to 2024
    • Market Size Value (USD Million) & Volume (Units) Forecast By Market Taxonomy, 2025 to 2035
      • By Country
        • Brazil
        • Mexico
        • Colombia
        • Rest of Latin America
      • By Product Type
      • By Function
      • By Active Ingredient
      • By Channel
      • By Claim
    • Market Attractiveness Analysis
      • By Country
      • By Product Type
      • By Function
      • By Active Ingredient
      • By Channel
      • By Claim
    • Key Takeaways
  13. Europe Market Analysis 2020 to 2024 and Forecast 2025 to 2035, By Country
    • Historical Market Size Value (USD Million) & Volume (Units) Trend Analysis By Market Taxonomy, 2020 to 2024
    • Market Size Value (USD Million) & Volume (Units) Forecast By Market Taxonomy, 2025 to 2035
      • By Country
        • Germany
        • UK
        • France
        • Italy
        • Spain
        • Belgium
        • Netherlands
        • Nordic
        • Switzerland
        • Russia
        • Poland
        • Rest of Europe
      • By Product Type
      • By Function
      • By Active Ingredient
      • By Channel
      • By Claim
    • Market Attractiveness Analysis
      • By Country
      • By Product Type
      • By Function
      • By Active Ingredient
      • By Channel
      • By Claim
    • Key Takeaways
  14. East Asia Market Analysis 2020 to 2024 and Forecast 2025 to 2035, By Country
    • Historical Market Size Value (USD Million) & Volume (Units) Trend Analysis By Market Taxonomy, 2020 to 2024
    • Market Size Value (USD Million) & Volume (Units) Forecast By Market Taxonomy, 2025 to 2035
      • By Country
        • China
        • Japan
        • South Korea
      • By Product Type
      • By Function
      • By Active Ingredient
      • By Channel
      • By Claim
    • Market Attractiveness Analysis
      • By Country
      • By Product Type
      • By Function
      • By Active Ingredient
      • By Channel
      • By Claim
    • Key Takeaways
  15. South Asia & Pacific Market Analysis 2020 to 2024 and Forecast 2025 to 2035, By Country
    • Historical Market Size Value (USD Million) & Volume (Units) Trend Analysis By Market Taxonomy, 2020 to 2024
    • Market Size Value (USD Million) & Volume (Units) Forecast By Market Taxonomy, 2025 to 2035
      • By Country
        • India
        • Thailand
        • Malaysia
        • Indonesia
        • Singapore
        • Vietnam
        • Australia
        • New Zealand
        • Rest of South Asia
      • By Product Type
      • By Function
      • By Active Ingredient
      • By Channel
      • By Claim
    • Market Attractiveness Analysis
      • By Country
      • By Product Type
      • By Function
      • By Active Ingredient
      • By Channel
      • By Claim
    • Key Takeaways
  16. Middle East and Africa Market Analysis 2020 to 2024 and Forecast 2025 to 2035, By Country
    • Historical Market Size Value (USD Million) & Volume (Units) Trend Analysis By Market Taxonomy, 2020 to 2024
    • Market Size Value (USD Million) & Volume (Units) Forecast By Market Taxonomy, 2025 to 2035
      • By Country
        • Turkey
        • UAE
        • Saudi Arabia
        • Israel
        • Other GCC Countries
        • North Africa
        • South Africa
      • By Product Type
      • By Function
      • By Active Ingredient
      • By Channel
      • By Claim
    • Market Attractiveness Analysis
      • By Country
      • By Product Type
      • By Function
      • By Active Ingredient
      • By Channel
      • By Claim
    • Key Takeaways
  17. Key Countries Market Analysis
    • USA
      • Pricing Analysis
      • Market Share Analysis, 2024
        • By Product Type
        • By Function
        • By Active Ingredient
        • By Channel
        • By Claim
    • Canada
      • Pricing Analysis
      • Market Share Analysis, 2024
        • By Product Type
        • By Function
        • By Active Ingredient
        • By Channel
        • By Claim
    • Brazil
      • Pricing Analysis
      • Market Share Analysis, 2024
        • By Product Type
        • By Function
        • By Active Ingredient
        • By Channel
        • By Claim
    • Mexico
      • Pricing Analysis
      • Market Share Analysis, 2024
        • By Product Type
        • By Function
        • By Active Ingredient
        • By Channel
        • By Claim
    • Colombia
      • Pricing Analysis
      • Market Share Analysis, 2024
        • By Product Type
        • By Function
        • By Active Ingredient
        • By Channel
        • By Claim
    • Germany
      • Pricing Analysis
      • Market Share Analysis, 2024
        • By Product Type
        • By Function
        • By Active Ingredient
        • By Channel
        • By Claim
    • UK
      • Pricing Analysis
      • Market Share Analysis, 2024
        • By Product Type
        • By Function
        • By Active Ingredient
        • By Channel
        • By Claim
    • France
      • Pricing Analysis
      • Market Share Analysis, 2024
        • By Product Type
        • By Function
        • By Active Ingredient
        • By Channel
        • By Claim
    • Italy
      • Pricing Analysis
      • Market Share Analysis, 2024
        • By Product Type
        • By Function
        • By Active Ingredient
        • By Channel
        • By Claim
    • Spain
      • Pricing Analysis
      • Market Share Analysis, 2024
        • By Product Type
        • By Function
        • By Active Ingredient
        • By Channel
        • By Claim
    • Belgium
      • Pricing Analysis
      • Market Share Analysis, 2024
        • By Product Type
        • By Function
        • By Active Ingredient
        • By Channel
        • By Claim
    • Netherlands
      • Pricing Analysis
      • Market Share Analysis, 2024
        • By Product Type
        • By Function
        • By Active Ingredient
        • By Channel
        • By Claim
    • Nordic
      • Pricing Analysis
      • Market Share Analysis, 2024
        • By Product Type
        • By Function
        • By Active Ingredient
        • By Channel
        • By Claim
    • Switzerland
      • Pricing Analysis
      • Market Share Analysis, 2024
        • By Product Type
        • By Function
        • By Active Ingredient
        • By Channel
        • By Claim
    • Russia
      • Pricing Analysis
      • Market Share Analysis, 2024
        • By Product Type
        • By Function
        • By Active Ingredient
        • By Channel
        • By Claim
    • Poland
      • Pricing Analysis
      • Market Share Analysis, 2024
        • By Product Type
        • By Function
        • By Active Ingredient
        • By Channel
        • By Claim
    • China
      • Pricing Analysis
      • Market Share Analysis, 2024
        • By Product Type
        • By Function
        • By Active Ingredient
        • By Channel
        • By Claim
    • Japan
      • Pricing Analysis
      • Market Share Analysis, 2024
        • By Product Type
        • By Function
        • By Active Ingredient
        • By Channel
        • By Claim
    • South Korea
      • Pricing Analysis
      • Market Share Analysis, 2024
        • By Product Type
        • By Function
        • By Active Ingredient
        • By Channel
        • By Claim
    • India
      • Pricing Analysis
      • Market Share Analysis, 2024
        • By Product Type
        • By Function
        • By Active Ingredient
        • By Channel
        • By Claim
    • Thailand
      • Pricing Analysis
      • Market Share Analysis, 2024
        • By Product Type
        • By Function
        • By Active Ingredient
        • By Channel
        • By Claim
    • Indonesia
      • Pricing Analysis
      • Market Share Analysis, 2024
        • By Product Type
        • By Function
        • By Active Ingredient
        • By Channel
        • By Claim
    • Australia
      • Pricing Analysis
      • Market Share Analysis, 2024
        • By Product Type
        • By Function
        • By Active Ingredient
        • By Channel
        • By Claim
    • New Zealand
      • Pricing Analysis
      • Market Share Analysis, 2024
        • By Product Type
        • By Function
        • By Active Ingredient
        • By Channel
        • By Claim
    • Turkey
      • Pricing Analysis
      • Market Share Analysis, 2024
        • By Product Type
        • By Function
        • By Active Ingredient
        • By Channel
        • By Claim
    • UAE
      • Pricing Analysis
      • Market Share Analysis, 2024
        • By Product Type
        • By Function
        • By Active Ingredient
        • By Channel
        • By Claim
    • Saudi Arabia
      • Pricing Analysis
      • Market Share Analysis, 2024
        • By Product Type
        • By Function
        • By Active Ingredient
        • By Channel
        • By Claim
    • Israel
      • Pricing Analysis
      • Market Share Analysis, 2024
        • By Product Type
        • By Function
        • By Active Ingredient
        • By Channel
        • By Claim
    • North Africa
      • Pricing Analysis
      • Market Share Analysis, 2024
        • By Product Type
        • By Function
        • By Active Ingredient
        • By Channel
        • By Claim
    • South Africa
      • Pricing Analysis
      • Market Share Analysis, 2024
        • By Product Type
        • By Function
        • By Active Ingredient
        • By Channel
        • By Claim
  18. Market Structure Analysis
    • Competition Dashboard
    • Competition Benchmarking
    • Market Share Analysis of Top Players
      • By Regional
      • By Product Type
      • By Function
      • By Active Ingredient
      • By Channel
      • By Claim
  19. Competition Analysis
    • Competition Deep Dive
      • Nivea
        • Overview
        • Product Portfolio
        • Profitability by Market Segments (Product/Age /Sales Channel/Region)
        • Sales Footprint
        • Strategy Overview
          • Marketing Strategy
          • Product Strategy
          • Channel Strategy
      • Maybelline
        • Overview
        • Product Portfolio
        • Profitability by Market Segments (Product/Age /Sales Channel/Region)
        • Sales Footprint
        • Strategy Overview
          • Marketing Strategy
          • Product Strategy
          • Channel Strategy
      • EOS
        • Overview
        • Product Portfolio
        • Profitability by Market Segments (Product/Age /Sales Channel/Region)
        • Sales Footprint
        • Strategy Overview
          • Marketing Strategy
          • Product Strategy
          • Channel Strategy
      • Carmex
        • Overview
        • Product Portfolio
        • Profitability by Market Segments (Product/Age /Sales Channel/Region)
        • Sales Footprint
        • Strategy Overview
          • Marketing Strategy
          • Product Strategy
          • Channel Strategy
      • Burt’s Bees
        • Overview
        • Product Portfolio
        • Profitability by Market Segments (Product/Age /Sales Channel/Region)
        • Sales Footprint
        • Strategy Overview
          • Marketing Strategy
          • Product Strategy
          • Channel Strategy
      • ChapStick
        • Overview
        • Product Portfolio
        • Profitability by Market Segments (Product/Age /Sales Channel/Region)
        • Sales Footprint
        • Strategy Overview
          • Marketing Strategy
          • Product Strategy
          • Channel Strategy
      • Vaseline
        • Overview
        • Product Portfolio
        • Profitability by Market Segments (Product/Age /Sales Channel/Region)
        • Sales Footprint
        • Strategy Overview
          • Marketing Strategy
          • Product Strategy
          • Channel Strategy
      • Laneige
        • Overview
        • Product Portfolio
        • Profitability by Market Segments (Product/Age /Sales Channel/Region)
        • Sales Footprint
        • Strategy Overview
          • Marketing Strategy
          • Product Strategy
          • Channel Strategy
      • Clinique
        • Overview
        • Product Portfolio
        • Profitability by Market Segments (Product/Age /Sales Channel/Region)
        • Sales Footprint
        • Strategy Overview
          • Marketing Strategy
          • Product Strategy
          • Channel Strategy
      • Fresh
        • Overview
        • Product Portfolio
        • Profitability by Market Segments (Product/Age /Sales Channel/Region)
        • Sales Footprint
        • Strategy Overview
          • Marketing Strategy
          • Product Strategy
          • Channel Strategy
      • Others
        • Overview
        • Product Portfolio
        • Profitability by Market Segments (Product/Age /Sales Channel/Region)
        • Sales Footprint
        • Strategy Overview
          • Marketing Strategy
          • Product Strategy
          • Channel Strategy
  20. Assumptions & Acronyms Used
  21. Research Methodology

List of Tables

  • Table 1: Global Market Value (USD Million) Forecast by Region, 2020-2035
  • Table 2: Global Market Volume (Units) Forecast by Region, 2020-2035
  • Table 3: Global Market Value (USD Million) Forecast by Product Type, 2020-2035
  • Table 4: Global Market Volume (Units) Forecast by Product Type, 2020-2035
  • Table 5: Global Market Value (USD Million) Forecast by Function, 2020-2035
  • Table 6: Global Market Volume (Units) Forecast by Function, 2020-2035
  • Table 7: Global Market Value (USD Million) Forecast by Active Ingredient, 2020-2035
  • Table 8: Global Market Volume (Units) Forecast by Active Ingredient, 2020-2035
  • Table 9: Global Market Value (USD Million) Forecast by Channel, 2020-2035
  • Table 10: Global Market Volume (Units) Forecast by Channel, 2020-2035
  • Table 11: Global Market Value (USD Million) Forecast by Claim, 2020-2035
  • Table 12: Global Market Volume (Units) Forecast by Claim, 2020-2035
  • Table 13: North America Market Value (USD Million) Forecast by Country, 2020-2035
  • Table 14: North America Market Volume (Units) Forecast by Country, 2020-2035
  • Table 15: North America Market Value (USD Million) Forecast by Product Type, 2020-2035
  • Table 16: North America Market Volume (Units) Forecast by Product Type, 2020-2035
  • Table 17: North America Market Value (USD Million) Forecast by Function, 2020-2035
  • Table 18: North America Market Volume (Units) Forecast by Function, 2020-2035
  • Table 19: North America Market Value (USD Million) Forecast by Active Ingredient, 2020-2035
  • Table 20: North America Market Volume (Units) Forecast by Active Ingredient, 2020-2035
  • Table 21: North America Market Value (USD Million) Forecast by Channel, 2020-2035
  • Table 22: North America Market Volume (Units) Forecast by Channel, 2020-2035
  • Table 23: North America Market Value (USD Million) Forecast by Claim, 2020-2035
  • Table 24: North America Market Volume (Units) Forecast by Claim, 2020-2035
  • Table 25: Latin America Market Value (USD Million) Forecast by Country, 2020-2035
  • Table 26: Latin America Market Volume (Units) Forecast by Country, 2020-2035
  • Table 27: Latin America Market Value (USD Million) Forecast by Product Type, 2020-2035
  • Table 28: Latin America Market Volume (Units) Forecast by Product Type, 2020-2035
  • Table 29: Latin America Market Value (USD Million) Forecast by Function, 2020-2035
  • Table 30: Latin America Market Volume (Units) Forecast by Function, 2020-2035
  • Table 31: Latin America Market Value (USD Million) Forecast by Active Ingredient, 2020-2035
  • Table 32: Latin America Market Volume (Units) Forecast by Active Ingredient, 2020-2035
  • Table 33: Latin America Market Value (USD Million) Forecast by Channel, 2020-2035
  • Table 34: Latin America Market Volume (Units) Forecast by Channel, 2020-2035
  • Table 35: Latin America Market Value (USD Million) Forecast by Claim, 2020-2035
  • Table 36: Latin America Market Volume (Units) Forecast by Claim, 2020-2035
  • Table 37: Europe Market Value (USD Million) Forecast by Country, 2020-2035
  • Table 38: Europe Market Volume (Units) Forecast by Country, 2020-2035
  • Table 39: Europe Market Value (USD Million) Forecast by Product Type, 2020-2035
  • Table 40: Europe Market Volume (Units) Forecast by Product Type, 2020-2035
  • Table 41: Europe Market Value (USD Million) Forecast by Function, 2020-2035
  • Table 42: Europe Market Volume (Units) Forecast by Function, 2020-2035
  • Table 43: Europe Market Value (USD Million) Forecast by Active Ingredient, 2020-2035
  • Table 44: Europe Market Volume (Units) Forecast by Active Ingredient, 2020-2035
  • Table 45: Europe Market Value (USD Million) Forecast by Channel, 2020-2035
  • Table 46: Europe Market Volume (Units) Forecast by Channel, 2020-2035
  • Table 47: Europe Market Value (USD Million) Forecast by Claim, 2020-2035
  • Table 48: Europe Market Volume (Units) Forecast by Claim, 2020-2035
  • Table 49: East Asia Market Value (USD Million) Forecast by Country, 2020-2035
  • Table 50: East Asia Market Volume (Units) Forecast by Country, 2020-2035
  • Table 51: East Asia Market Value (USD Million) Forecast by Product Type, 2020-2035
  • Table 52: East Asia Market Volume (Units) Forecast by Product Type, 2020-2035
  • Table 53: East Asia Market Value (USD Million) Forecast by Function, 2020-2035
  • Table 54: East Asia Market Volume (Units) Forecast by Function, 2020-2035
  • Table 55: East Asia Market Value (USD Million) Forecast by Active Ingredient, 2020-2035
  • Table 56: East Asia Market Volume (Units) Forecast by Active Ingredient, 2020-2035
  • Table 57: East Asia Market Value (USD Million) Forecast by Channel, 2020-2035
  • Table 58: East Asia Market Volume (Units) Forecast by Channel, 2020-2035
  • Table 59: East Asia Market Value (USD Million) Forecast by Claim, 2020-2035
  • Table 60: East Asia Market Volume (Units) Forecast by Claim, 2020-2035
  • Table 61: South Asia & Pacific Market Value (USD Million) Forecast by Country, 2020-2035
  • Table 62: South Asia & Pacific Market Volume (Units) Forecast by Country, 2020-2035
  • Table 63: South Asia & Pacific Market Value (USD Million) Forecast by Product Type, 2020-2035
  • Table 64: South Asia & Pacific Market Volume (Units) Forecast by Product Type, 2020-2035
  • Table 65: South Asia & Pacific Market Value (USD Million) Forecast by Function, 2020-2035
  • Table 66: South Asia & Pacific Market Volume (Units) Forecast by Function, 2020-2035
  • Table 67: South Asia & Pacific Market Value (USD Million) Forecast by Active Ingredient, 2020-2035
  • Table 68: South Asia & Pacific Market Volume (Units) Forecast by Active Ingredient, 2020-2035
  • Table 69: South Asia & Pacific Market Value (USD Million) Forecast by Channel, 2020-2035
  • Table 70: South Asia & Pacific Market Volume (Units) Forecast by Channel, 2020-2035
  • Table 71: South Asia & Pacific Market Value (USD Million) Forecast by Claim, 2020-2035
  • Table 72: South Asia & Pacific Market Volume (Units) Forecast by Claim, 2020-2035
  • Table 73: Middle East and Africa Market Value (USD Million) Forecast by Country, 2020-2035
  • Table 74: Middle East and Africa Market Volume (Units) Forecast by Country, 2020-2035
  • Table 75: Middle East and Africa Market Value (USD Million) Forecast by Product Type, 2020-2035
  • Table 76: Middle East and Africa Market Volume (Units) Forecast by Product Type, 2020-2035
  • Table 77: Middle East and Africa Market Value (USD Million) Forecast by Function, 2020-2035
  • Table 78: Middle East and Africa Market Volume (Units) Forecast by Function, 2020-2035
  • Table 79: Middle East and Africa Market Value (USD Million) Forecast by Active Ingredient, 2020-2035
  • Table 80: Middle East and Africa Market Volume (Units) Forecast by Active Ingredient, 2020-2035
  • Table 81: Middle East and Africa Market Value (USD Million) Forecast by Channel, 2020-2035
  • Table 82: Middle East and Africa Market Volume (Units) Forecast by Channel, 2020-2035
  • Table 83: Middle East and Africa Market Value (USD Million) Forecast by Claim, 2020-2035
  • Table 84: Middle East and Africa Market Volume (Units) Forecast by Claim, 2020-2035

List of Figures

  • Figure 1: Global Market Value (USD Million) by Product Type, 2025-2035
  • Figure 2: Global Market Value (USD Million) by Function, 2025-2035
  • Figure 3: Global Market Value (USD Million) by Active Ingredient, 2025-2035
  • Figure 4: Global Market Value (USD Million) by Channel, 2025-2035
  • Figure 5: Global Market Value (USD Million) by Claim, 2025-2035
  • Figure 6: Global Market Value (USD Million) by Region, 2025-2035
  • Figure 7: Global Market Value (USD Million) Analysis by Region, 2020-2035
  • Figure 8: Global Market Volume (Units) Analysis by Region, 2020-2035
  • Figure 9: Global Market Value Share (%) and BPS Analysis by Region, 2025-2035
  • Figure 10: Global Market Y-o-Y Growth (%) Projections by Region, 2025-2035
  • Figure 11: Global Market Value (USD Million) Analysis by Product Type, 2020-2035
  • Figure 12: Global Market Volume (Units) Analysis by Product Type, 2020-2035
  • Figure 13: Global Market Value Share (%) and BPS Analysis by Product Type, 2025-2035
  • Figure 14: Global Market Y-o-Y Growth (%) Projections by Product Type, 2025-2035
  • Figure 15: Global Market Value (USD Million) Analysis by Function, 2020-2035
  • Figure 16: Global Market Volume (Units) Analysis by Function, 2020-2035
  • Figure 17: Global Market Value Share (%) and BPS Analysis by Function, 2025-2035
  • Figure 18: Global Market Y-o-Y Growth (%) Projections by Function, 2025-2035
  • Figure 19: Global Market Value (USD Million) Analysis by Active Ingredient, 2020-2035
  • Figure 20: Global Market Volume (Units) Analysis by Active Ingredient, 2020-2035
  • Figure 21: Global Market Value Share (%) and BPS Analysis by Active Ingredient, 2025-2035
  • Figure 22: Global Market Y-o-Y Growth (%) Projections by Active Ingredient, 2025-2035
  • Figure 23: Global Market Value (USD Million) Analysis by Channel, 2020-2035
  • Figure 24: Global Market Volume (Units) Analysis by Channel, 2020-2035
  • Figure 25: Global Market Value Share (%) and BPS Analysis by Channel, 2025-2035
  • Figure 26: Global Market Y-o-Y Growth (%) Projections by Channel, 2025-2035
  • Figure 27: Global Market Value (USD Million) Analysis by Claim, 2020-2035
  • Figure 28: Global Market Volume (Units) Analysis by Claim, 2020-2035
  • Figure 29: Global Market Value Share (%) and BPS Analysis by Claim, 2025-2035
  • Figure 30: Global Market Y-o-Y Growth (%) Projections by Claim, 2025-2035
  • Figure 31: Global Market Attractiveness by Product Type, 2025-2035
  • Figure 32: Global Market Attractiveness by Function, 2025-2035
  • Figure 33: Global Market Attractiveness by Active Ingredient, 2025-2035
  • Figure 34: Global Market Attractiveness by Channel, 2025-2035
  • Figure 35: Global Market Attractiveness by Claim, 2025-2035
  • Figure 36: Global Market Attractiveness by Region, 2025-2035
  • Figure 37: North America Market Value (USD Million) by Product Type, 2025-2035
  • Figure 38: North America Market Value (USD Million) by Function, 2025-2035
  • Figure 39: North America Market Value (USD Million) by Active Ingredient, 2025-2035
  • Figure 40: North America Market Value (USD Million) by Channel, 2025-2035
  • Figure 41: North America Market Value (USD Million) by Claim, 2025-2035
  • Figure 42: North America Market Value (USD Million) by Country, 2025-2035
  • Figure 43: North America Market Value (USD Million) Analysis by Country, 2020-2035
  • Figure 44: North America Market Volume (Units) Analysis by Country, 2020-2035
  • Figure 45: North America Market Value Share (%) and BPS Analysis by Country, 2025-2035
  • Figure 46: North America Market Y-o-Y Growth (%) Projections by Country, 2025-2035
  • Figure 47: North America Market Value (USD Million) Analysis by Product Type, 2020-2035
  • Figure 48: North America Market Volume (Units) Analysis by Product Type, 2020-2035
  • Figure 49: North America Market Value Share (%) and BPS Analysis by Product Type, 2025-2035
  • Figure 50: North America Market Y-o-Y Growth (%) Projections by Product Type, 2025-2035
  • Figure 51: North America Market Value (USD Million) Analysis by Function, 2020-2035
  • Figure 52: North America Market Volume (Units) Analysis by Function, 2020-2035
  • Figure 53: North America Market Value Share (%) and BPS Analysis by Function, 2025-2035
  • Figure 54: North America Market Y-o-Y Growth (%) Projections by Function, 2025-2035
  • Figure 55: North America Market Value (USD Million) Analysis by Active Ingredient, 2020-2035
  • Figure 56: North America Market Volume (Units) Analysis by Active Ingredient, 2020-2035
  • Figure 57: North America Market Value Share (%) and BPS Analysis by Active Ingredient, 2025-2035
  • Figure 58: North America Market Y-o-Y Growth (%) Projections by Active Ingredient, 2025-2035
  • Figure 59: North America Market Value (USD Million) Analysis by Channel, 2020-2035
  • Figure 60: North America Market Volume (Units) Analysis by Channel, 2020-2035
  • Figure 61: North America Market Value Share (%) and BPS Analysis by Channel, 2025-2035
  • Figure 62: North America Market Y-o-Y Growth (%) Projections by Channel, 2025-2035
  • Figure 63: North America Market Value (USD Million) Analysis by Claim, 2020-2035
  • Figure 64: North America Market Volume (Units) Analysis by Claim, 2020-2035
  • Figure 65: North America Market Value Share (%) and BPS Analysis by Claim, 2025-2035
  • Figure 66: North America Market Y-o-Y Growth (%) Projections by Claim, 2025-2035
  • Figure 67: North America Market Attractiveness by Product Type, 2025-2035
  • Figure 68: North America Market Attractiveness by Function, 2025-2035
  • Figure 69: North America Market Attractiveness by Active Ingredient, 2025-2035
  • Figure 70: North America Market Attractiveness by Channel, 2025-2035
  • Figure 71: North America Market Attractiveness by Claim, 2025-2035
  • Figure 72: North America Market Attractiveness by Country, 2025-2035
  • Figure 73: Latin America Market Value (USD Million) by Product Type, 2025-2035
  • Figure 74: Latin America Market Value (USD Million) by Function, 2025-2035
  • Figure 75: Latin America Market Value (USD Million) by Active Ingredient, 2025-2035
  • Figure 76: Latin America Market Value (USD Million) by Channel, 2025-2035
  • Figure 77: Latin America Market Value (USD Million) by Claim, 2025-2035
  • Figure 78: Latin America Market Value (USD Million) by Country, 2025-2035
  • Figure 79: Latin America Market Value (USD Million) Analysis by Country, 2020-2035
  • Figure 80: Latin America Market Volume (Units) Analysis by Country, 2020-2035
  • Figure 81: Latin America Market Value Share (%) and BPS Analysis by Country, 2025-2035
  • Figure 82: Latin America Market Y-o-Y Growth (%) Projections by Country, 2025-2035
  • Figure 83: Latin America Market Value (USD Million) Analysis by Product Type, 2020-2035
  • Figure 84: Latin America Market Volume (Units) Analysis by Product Type, 2020-2035
  • Figure 85: Latin America Market Value Share (%) and BPS Analysis by Product Type, 2025-2035
  • Figure 86: Latin America Market Y-o-Y Growth (%) Projections by Product Type, 2025-2035
  • Figure 87: Latin America Market Value (USD Million) Analysis by Function, 2020-2035
  • Figure 88: Latin America Market Volume (Units) Analysis by Function, 2020-2035
  • Figure 89: Latin America Market Value Share (%) and BPS Analysis by Function, 2025-2035
  • Figure 90: Latin America Market Y-o-Y Growth (%) Projections by Function, 2025-2035
  • Figure 91: Latin America Market Value (USD Million) Analysis by Active Ingredient, 2020-2035
  • Figure 92: Latin America Market Volume (Units) Analysis by Active Ingredient, 2020-2035
  • Figure 93: Latin America Market Value Share (%) and BPS Analysis by Active Ingredient, 2025-2035
  • Figure 94: Latin America Market Y-o-Y Growth (%) Projections by Active Ingredient, 2025-2035
  • Figure 95: Latin America Market Value (USD Million) Analysis by Channel, 2020-2035
  • Figure 96: Latin America Market Volume (Units) Analysis by Channel, 2020-2035
  • Figure 97: Latin America Market Value Share (%) and BPS Analysis by Channel, 2025-2035
  • Figure 98: Latin America Market Y-o-Y Growth (%) Projections by Channel, 2025-2035
  • Figure 99: Latin America Market Value (USD Million) Analysis by Claim, 2020-2035
  • Figure 100: Latin America Market Volume (Units) Analysis by Claim, 2020-2035
  • Figure 101: Latin America Market Value Share (%) and BPS Analysis by Claim, 2025-2035
  • Figure 102: Latin America Market Y-o-Y Growth (%) Projections by Claim, 2025-2035
  • Figure 103: Latin America Market Attractiveness by Product Type, 2025-2035
  • Figure 104: Latin America Market Attractiveness by Function, 2025-2035
  • Figure 105: Latin America Market Attractiveness by Active Ingredient, 2025-2035
  • Figure 106: Latin America Market Attractiveness by Channel, 2025-2035
  • Figure 107: Latin America Market Attractiveness by Claim, 2025-2035
  • Figure 108: Latin America Market Attractiveness by Country, 2025-2035
  • Figure 109: Europe Market Value (USD Million) by Product Type, 2025-2035
  • Figure 110: Europe Market Value (USD Million) by Function, 2025-2035
  • Figure 111: Europe Market Value (USD Million) by Active Ingredient, 2025-2035
  • Figure 112: Europe Market Value (USD Million) by Channel, 2025-2035
  • Figure 113: Europe Market Value (USD Million) by Claim, 2025-2035
  • Figure 114: Europe Market Value (USD Million) by Country, 2025-2035
  • Figure 115: Europe Market Value (USD Million) Analysis by Country, 2020-2035
  • Figure 116: Europe Market Volume (Units) Analysis by Country, 2020-2035
  • Figure 117: Europe Market Value Share (%) and BPS Analysis by Country, 2025-2035
  • Figure 118: Europe Market Y-o-Y Growth (%) Projections by Country, 2025-2035
  • Figure 119: Europe Market Value (USD Million) Analysis by Product Type, 2020-2035
  • Figure 120: Europe Market Volume (Units) Analysis by Product Type, 2020-2035
  • Figure 121: Europe Market Value Share (%) and BPS Analysis by Product Type, 2025-2035
  • Figure 122: Europe Market Y-o-Y Growth (%) Projections by Product Type, 2025-2035
  • Figure 123: Europe Market Value (USD Million) Analysis by Function, 2020-2035
  • Figure 124: Europe Market Volume (Units) Analysis by Function, 2020-2035
  • Figure 125: Europe Market Value Share (%) and BPS Analysis by Function, 2025-2035
  • Figure 126: Europe Market Y-o-Y Growth (%) Projections by Function, 2025-2035
  • Figure 127: Europe Market Value (USD Million) Analysis by Active Ingredient, 2020-2035
  • Figure 128: Europe Market Volume (Units) Analysis by Active Ingredient, 2020-2035
  • Figure 129: Europe Market Value Share (%) and BPS Analysis by Active Ingredient, 2025-2035
  • Figure 130: Europe Market Y-o-Y Growth (%) Projections by Active Ingredient, 2025-2035
  • Figure 131: Europe Market Value (USD Million) Analysis by Channel, 2020-2035
  • Figure 132: Europe Market Volume (Units) Analysis by Channel, 2020-2035
  • Figure 133: Europe Market Value Share (%) and BPS Analysis by Channel, 2025-2035
  • Figure 134: Europe Market Y-o-Y Growth (%) Projections by Channel, 2025-2035
  • Figure 135: Europe Market Value (USD Million) Analysis by Claim, 2020-2035
  • Figure 136: Europe Market Volume (Units) Analysis by Claim, 2020-2035
  • Figure 137: Europe Market Value Share (%) and BPS Analysis by Claim, 2025-2035
  • Figure 138: Europe Market Y-o-Y Growth (%) Projections by Claim, 2025-2035
  • Figure 139: Europe Market Attractiveness by Product Type, 2025-2035
  • Figure 140: Europe Market Attractiveness by Function, 2025-2035
  • Figure 141: Europe Market Attractiveness by Active Ingredient, 2025-2035
  • Figure 142: Europe Market Attractiveness by Channel, 2025-2035
  • Figure 143: Europe Market Attractiveness by Claim, 2025-2035
  • Figure 144: Europe Market Attractiveness by Country, 2025-2035
  • Figure 145: East Asia Market Value (USD Million) by Product Type, 2025-2035
  • Figure 146: East Asia Market Value (USD Million) by Function, 2025-2035
  • Figure 147: East Asia Market Value (USD Million) by Active Ingredient, 2025-2035
  • Figure 148: East Asia Market Value (USD Million) by Channel, 2025-2035
  • Figure 149: East Asia Market Value (USD Million) by Claim, 2025-2035
  • Figure 150: East Asia Market Value (USD Million) by Country, 2025-2035
  • Figure 151: East Asia Market Value (USD Million) Analysis by Country, 2020-2035
  • Figure 152: East Asia Market Volume (Units) Analysis by Country, 2020-2035
  • Figure 153: East Asia Market Value Share (%) and BPS Analysis by Country, 2025-2035
  • Figure 154: East Asia Market Y-o-Y Growth (%) Projections by Country, 2025-2035
  • Figure 155: East Asia Market Value (USD Million) Analysis by Product Type, 2020-2035
  • Figure 156: East Asia Market Volume (Units) Analysis by Product Type, 2020-2035
  • Figure 157: East Asia Market Value Share (%) and BPS Analysis by Product Type, 2025-2035
  • Figure 158: East Asia Market Y-o-Y Growth (%) Projections by Product Type, 2025-2035
  • Figure 159: East Asia Market Value (USD Million) Analysis by Function, 2020-2035
  • Figure 160: East Asia Market Volume (Units) Analysis by Function, 2020-2035
  • Figure 161: East Asia Market Value Share (%) and BPS Analysis by Function, 2025-2035
  • Figure 162: East Asia Market Y-o-Y Growth (%) Projections by Function, 2025-2035
  • Figure 163: East Asia Market Value (USD Million) Analysis by Active Ingredient, 2020-2035
  • Figure 164: East Asia Market Volume (Units) Analysis by Active Ingredient, 2020-2035
  • Figure 165: East Asia Market Value Share (%) and BPS Analysis by Active Ingredient, 2025-2035
  • Figure 166: East Asia Market Y-o-Y Growth (%) Projections by Active Ingredient, 2025-2035
  • Figure 167: East Asia Market Value (USD Million) Analysis by Channel, 2020-2035
  • Figure 168: East Asia Market Volume (Units) Analysis by Channel, 2020-2035
  • Figure 169: East Asia Market Value Share (%) and BPS Analysis by Channel, 2025-2035
  • Figure 170: East Asia Market Y-o-Y Growth (%) Projections by Channel, 2025-2035
  • Figure 171: East Asia Market Value (USD Million) Analysis by Claim, 2020-2035
  • Figure 172: East Asia Market Volume (Units) Analysis by Claim, 2020-2035
  • Figure 173: East Asia Market Value Share (%) and BPS Analysis by Claim, 2025-2035
  • Figure 174: East Asia Market Y-o-Y Growth (%) Projections by Claim, 2025-2035
  • Figure 175: East Asia Market Attractiveness by Product Type, 2025-2035
  • Figure 176: East Asia Market Attractiveness by Function, 2025-2035
  • Figure 177: East Asia Market Attractiveness by Active Ingredient, 2025-2035
  • Figure 178: East Asia Market Attractiveness by Channel, 2025-2035
  • Figure 179: East Asia Market Attractiveness by Claim, 2025-2035
  • Figure 180: East Asia Market Attractiveness by Country, 2025-2035
  • Figure 181: South Asia & Pacific Market Value (USD Million) by Product Type, 2025-2035
  • Figure 182: South Asia & Pacific Market Value (USD Million) by Function, 2025-2035
  • Figure 183: South Asia & Pacific Market Value (USD Million) by Active Ingredient, 2025-2035
  • Figure 184: South Asia & Pacific Market Value (USD Million) by Channel, 2025-2035
  • Figure 185: South Asia & Pacific Market Value (USD Million) by Claim, 2025-2035
  • Figure 186: South Asia & Pacific Market Value (USD Million) by Country, 2025-2035
  • Figure 187: South Asia & Pacific Market Value (USD Million) Analysis by Country, 2020-2035
  • Figure 188: South Asia & Pacific Market Volume (Units) Analysis by Country, 2020-2035
  • Figure 189: South Asia & Pacific Market Value Share (%) and BPS Analysis by Country, 2025-2035
  • Figure 190: South Asia & Pacific Market Y-o-Y Growth (%) Projections by Country, 2025-2035
  • Figure 191: South Asia & Pacific Market Value (USD Million) Analysis by Product Type, 2020-2035
  • Figure 192: South Asia & Pacific Market Volume (Units) Analysis by Product Type, 2020-2035
  • Figure 193: South Asia & Pacific Market Value Share (%) and BPS Analysis by Product Type, 2025-2035
  • Figure 194: South Asia & Pacific Market Y-o-Y Growth (%) Projections by Product Type, 2025-2035
  • Figure 195: South Asia & Pacific Market Value (USD Million) Analysis by Function, 2020-2035
  • Figure 196: South Asia & Pacific Market Volume (Units) Analysis by Function, 2020-2035
  • Figure 197: South Asia & Pacific Market Value Share (%) and BPS Analysis by Function, 2025-2035
  • Figure 198: South Asia & Pacific Market Y-o-Y Growth (%) Projections by Function, 2025-2035
  • Figure 199: South Asia & Pacific Market Value (USD Million) Analysis by Active Ingredient, 2020-2035
  • Figure 200: South Asia & Pacific Market Volume (Units) Analysis by Active Ingredient, 2020-2035
  • Figure 201: South Asia & Pacific Market Value Share (%) and BPS Analysis by Active Ingredient, 2025-2035
  • Figure 202: South Asia & Pacific Market Y-o-Y Growth (%) Projections by Active Ingredient, 2025-2035
  • Figure 203: South Asia & Pacific Market Value (USD Million) Analysis by Channel, 2020-2035
  • Figure 204: South Asia & Pacific Market Volume (Units) Analysis by Channel, 2020-2035
  • Figure 205: South Asia & Pacific Market Value Share (%) and BPS Analysis by Channel, 2025-2035
  • Figure 206: South Asia & Pacific Market Y-o-Y Growth (%) Projections by Channel, 2025-2035
  • Figure 207: South Asia & Pacific Market Value (USD Million) Analysis by Claim, 2020-2035
  • Figure 208: South Asia & Pacific Market Volume (Units) Analysis by Claim, 2020-2035
  • Figure 209: South Asia & Pacific Market Value Share (%) and BPS Analysis by Claim, 2025-2035
  • Figure 210: South Asia & Pacific Market Y-o-Y Growth (%) Projections by Claim, 2025-2035
  • Figure 211: South Asia & Pacific Market Attractiveness by Product Type, 2025-2035
  • Figure 212: South Asia & Pacific Market Attractiveness by Function, 2025-2035
  • Figure 213: South Asia & Pacific Market Attractiveness by Active Ingredient, 2025-2035
  • Figure 214: South Asia & Pacific Market Attractiveness by Channel, 2025-2035
  • Figure 215: South Asia & Pacific Market Attractiveness by Claim, 2025-2035
  • Figure 216: South Asia & Pacific Market Attractiveness by Country, 2025-2035
  • Figure 217: Middle East and Africa Market Value (USD Million) by Product Type, 2025-2035
  • Figure 218: Middle East and Africa Market Value (USD Million) by Function, 2025-2035
  • Figure 219: Middle East and Africa Market Value (USD Million) by Active Ingredient, 2025-2035
  • Figure 220: Middle East and Africa Market Value (USD Million) by Channel, 2025-2035
  • Figure 221: Middle East and Africa Market Value (USD Million) by Claim, 2025-2035
  • Figure 222: Middle East and Africa Market Value (USD Million) by Country, 2025-2035
  • Figure 223: Middle East and Africa Market Value (USD Million) Analysis by Country, 2020-2035
  • Figure 224: Middle East and Africa Market Volume (Units) Analysis by Country, 2020-2035
  • Figure 225: Middle East and Africa Market Value Share (%) and BPS Analysis by Country, 2025-2035
  • Figure 226: Middle East and Africa Market Y-o-Y Growth (%) Projections by Country, 2025-2035
  • Figure 227: Middle East and Africa Market Value (USD Million) Analysis by Product Type, 2020-2035
  • Figure 228: Middle East and Africa Market Volume (Units) Analysis by Product Type, 2020-2035
  • Figure 229: Middle East and Africa Market Value Share (%) and BPS Analysis by Product Type, 2025-2035
  • Figure 230: Middle East and Africa Market Y-o-Y Growth (%) Projections by Product Type, 2025-2035
  • Figure 231: Middle East and Africa Market Value (USD Million) Analysis by Function, 2020-2035
  • Figure 232: Middle East and Africa Market Volume (Units) Analysis by Function, 2020-2035
  • Figure 233: Middle East and Africa Market Value Share (%) and BPS Analysis by Function, 2025-2035
  • Figure 234: Middle East and Africa Market Y-o-Y Growth (%) Projections by Function, 2025-2035
  • Figure 235: Middle East and Africa Market Value (USD Million) Analysis by Active Ingredient, 2020-2035
  • Figure 236: Middle East and Africa Market Volume (Units) Analysis by Active Ingredient, 2020-2035
  • Figure 237: Middle East and Africa Market Value Share (%) and BPS Analysis by Active Ingredient, 2025-2035
  • Figure 238: Middle East and Africa Market Y-o-Y Growth (%) Projections by Active Ingredient, 2025-2035
  • Figure 239: Middle East and Africa Market Value (USD Million) Analysis by Channel, 2020-2035
  • Figure 240: Middle East and Africa Market Volume (Units) Analysis by Channel, 2020-2035
  • Figure 241: Middle East and Africa Market Value Share (%) and BPS Analysis by Channel, 2025-2035
  • Figure 242: Middle East and Africa Market Y-o-Y Growth (%) Projections by Channel, 2025-2035
  • Figure 243: Middle East and Africa Market Value (USD Million) Analysis by Claim, 2020-2035
  • Figure 244: Middle East and Africa Market Volume (Units) Analysis by Claim, 2020-2035
  • Figure 245: Middle East and Africa Market Value Share (%) and BPS Analysis by Claim, 2025-2035
  • Figure 246: Middle East and Africa Market Y-o-Y Growth (%) Projections by Claim, 2025-2035
  • Figure 247: Middle East and Africa Market Attractiveness by Product Type, 2025-2035
  • Figure 248: Middle East and Africa Market Attractiveness by Function, 2025-2035
  • Figure 249: Middle East and Africa Market Attractiveness by Active Ingredient, 2025-2035
  • Figure 250: Middle East and Africa Market Attractiveness by Channel, 2025-2035
  • Figure 251: Middle East and Africa Market Attractiveness by Claim, 2025-2035
  • Figure 252: Middle East and Africa Market Attractiveness by Country, 2025-2035

Frequently Asked Questions

How big is the Lip Care Market in 2025?

The global Lip Care Market is estimated to be valued at USD 4,806.5 million in 2025.

What will be the size of the Lip Care Market in 2035?

The market size for the Lip Care Market is projected to reach USD 10,904.3 million by 2035.

How much will be the Lip Care Market growth between 2025 and 2035?

The Lip Care Market is expected to grow at a CAGR of 8.5% between 2025 and 2035.

What are the key product types in the Lip Care Market?

The key product types in the Lip Care Market are balms, oils, serums, scrubs, and masks.

Which product type will contribute significant share in the Lip Care Market in 2025?

In terms of product type, the “others” category, including oils, serums, and scrubs, is projected to command 53.0% share in the Lip Care Market in 2025.

Explore Similar Insights

Future Market Insights

Lip Care Market

Chat With

MaRIA

Hi There, I am MaRIA, Your Market Research Intelligence Assistant. How may I help you?