Reports

- Global Locations -

Headquarters

Future Market Insights, Inc.

Christiana Corporate, 200
Continental Drive, Suite 401,
Newark, Delaware - 19713,
United States

T: +1-845-579-5705

Americas

Future Market Insights, Inc.

616 Corporate Way, Suite 2-9018,
Valley Cottage, NY 10989, United States

T: +1-347-918-3531

MEA

Future Market Insights

1602-6 Jumeirah Bay X2 Tower, Plot No: JLT-PH2-X2A,
Jumeirah Lakes Towers, Dubai,
United Arab Emirates

Europe

Future Market Insights

3rd Floor, 207 Regent Street,
W1B 3HH London
United Kingdom

T: + 44 (0) 20 8123 9659
D: +44 (0) 20 3287 4268

Asia Pacific

Future Market Insights

IndiaLand Global Tech Park, Unit UG-1, Behind Grand HighStreet, Phase 1, Hinjawadi, MH, Pune – 411057, India

Lip Fillers Market Outlook (2022 to 2028)

The global Lip Fillers Market is currently valued at around US$ 1.3 Billion and is anticipated to progress at a CAGR of 3.8% to reach US$ 1.63 Billion by 2028.

Attribute Details
Lip Fillers Market Size (2022) US$ 1.3 Billion
Sales Forecast (2028) US$ 1.63 Billion
Global Market Growth Rate (2022 to 2028) 3.8% CAGR
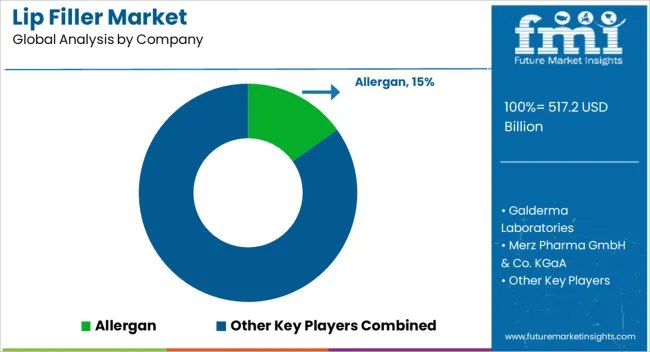
Share of Top 5 Lip Filler Manufacturers 50%

Sales of lip fillers accounted for around 22.8% share of the global Botox treatment market in 2021. Hyaluronic acid lip fillers are expected to remain a prominent application area to provide investments to lip filler manufacturers.

Don't pay for what you don't need

Customize your report by selecting specific countries or regions and save 30%!

How The Market Progressed Till June 2022?

Particulars Details
H1, 2021 3.59%
H1, 2022 Projected 3.65%
H1, 2022 Outlook 3.25%
BPS Change - H1, 2022 (O) – H1, 2022 (P) (-) 40 ↓
BPS Change – H1, 2022 (O) – H1, 2021 (-) 34 ↓

The global market for lip fillers is subject to changes as per the macroeconomic and industry standards in regard to product licensing, funding, and grants for pipelined products, as well as regulatory compliance, and reimbursement for payers.

The comparative analysis and market growth rate of the global lip fillers market as studied by Future Market Insights will show a negative BPS growth in the H1-2022 outlook as compared to H1-2022 projected period by 40 BPS, and, a decline in BPS values is expected in H1-2022 over H1- 2021 duration with 34 Basis Point Share (BPS).

The associated decline in the BPS values is because of a decline in medical tourism, thus displaying a reduction in the adoption of dermal cosmetic procedures during the initial half of the global COVID-19 pandemic. However, with the current global scenario, the increase in the number of dermal filler procedures is set to rise, hence expected to promote a positive market outlook.

Key developments in the market include the introduction of hyaluronic acid-based lip fillers, and the advancements in lip filler techniques, such as the use of a microcannula with distinct entry points for enhanced outcomes.

Lip Fillers Market

Demand Analysis of Lip Fillers from 2014 to 2021 Vs Market Projections for 2022 to 2028

Increase in Number of Aesthetic Treatments to Boost Demand for Lip Fillers

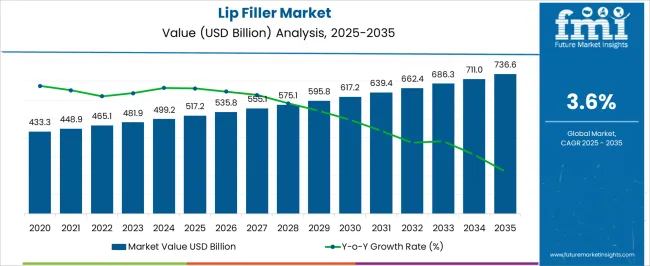
Global lip filler consumption witnessed a growth rate of 3.1% over the historical period of 2014 to 2021.

Among the aesthetic treatments performed worldwide, the demand for non-invasive procedures is more and is rising by double digits. The low complexity of the procedure, the possibility for reversal of the procedure, and less time taken as compared to other surgical aesthetic treatments are factors boosting demand for non-invasive aesthetic procedures, and eventually, for advanced lip filler procedures.

Companies have adopted various unique and alternative methods for financing surgical and non-surgical aesthetic treatments, which has made several procedures affordable. However, customers of companies such as Patient Payment Solutions and Care Credit are aware of the fact that cosmetic procedures are not covered under insurance and all expenses are paid out of pocket.

On the other hand, technological advancements are revolutionizing the beauty industry with cutting-edge treatments and procedures, thus enhancing aesthetic improvements, which is boosting the number of lip filler procedures.

Ever since 'selfie' has come out as one of the most popular hashtags across social media platforms, the obsession with voluminous and contoured lips has gained new heights, thereby making social media rank among the biggest growth catalysts in the lip fillers market space.

Consumers of aesthetic products have become very receptive to dermal fillers. The age range for medical aesthetics continues and has been further extended. Younger patients in the age group of the early 20s to 30s have started realizing the benefits of early intervention to suspend signs of aging.

Brands developing dermal filler solutions continue to focus on social media marketing for devising influential campaigns, which, in turn, would help them to get hold of larger customer bases.

Improvements in cosmetic procedures have led to a higher demand for lip filler procedures. The development of advanced lip fillers with a focus on stabilizing main ingredients and further cross-linking with the gel medium so as to prolong their effect are among the focus areas of manufacturers.

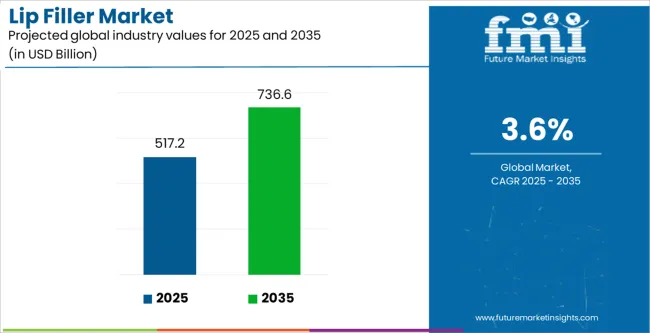
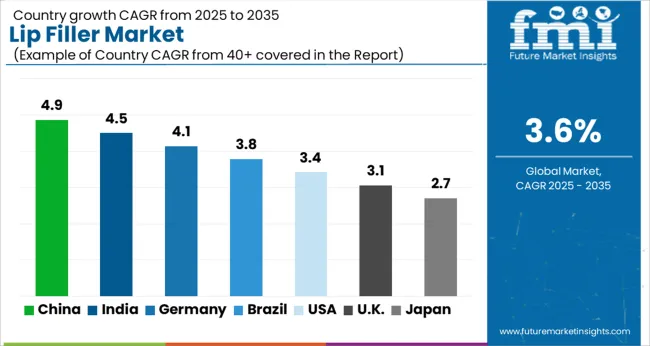
The global lip fillers market is projected to expand at a 3.8% CAGR from 2022 to 2028.

Sabyasachi Ghosh
Sabyasachi Ghosh

Principal Consultant

Talk to Analyst

Find your sweet spots for generating winning opportunities in this market.

Which Trends are Likely to Shape Market Growth?

The millennial age group will be a lucrative category for lip filler manufacturers to capitalize on, as mostly, this age group is more self-conscious about their appearance and is opting more for these procedures to get appealing makeovers. Offering a wide range of safe and effective treatment options will remain key for suppliers of lip fillers. Market players can also draw upon the mega-trend of personalization via tailor-made lip filler solutions, which will definitely help them increase their revenue and profits.

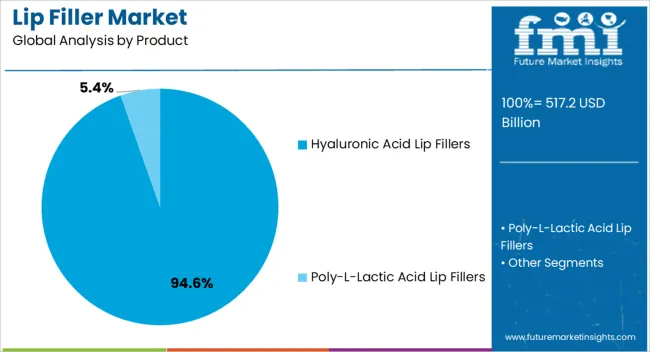
FMI’s research study opines that lip augmentation with hyaluronic acid-based solutions will remain the most frequently requested procedure in aesthetic practices. This can be gauged by the fact that in 2019, hyaluronic acid will surpass Poly-L-Lactic Acid to account for 94% of the global lip fillers-derived business value.

Which is the Dominant Regional Market for Lip Fillers?

Research and Development Activities for Better Outcomes After Lip Filler Procedures Increasing in North America

North America, due to the strong presence of lip fillers, is estimated to continue to be a prominent regional market for manufacturers of lip fillers.

Rising research & development activities after lip filler procedures, the highest per capita spending power, increased technological innovation, and rising consumer knowledge and understanding are driving the market growth in the region.

Market expansion is expected to be supported by the growing need for flawless looks and confidence derived from physical attributes. A key growth factor is the establishment and expansion of healthcare plans for different lip filler procedures.

Get the data you need at a Fraction of the cost

Personalize your report by choosing insights you need
and save 40%!

Country-wise Analysis

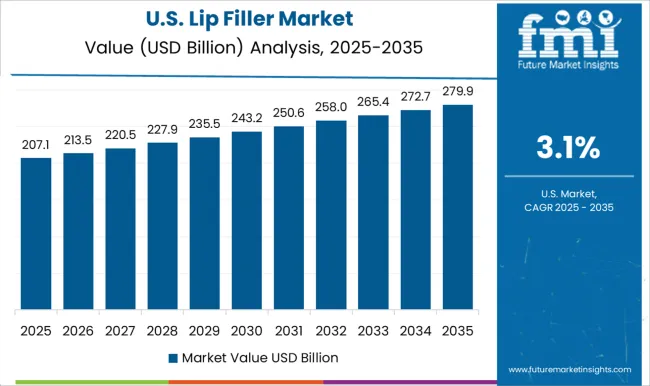
Where Does the USA Stand in the Global Lip Fillers Market?

Non-invasive Lip Fillers Revolutionizing Cosmetic Dermatology in the USA

Leading manufacturers of non-invasive lip fillers are presently prioritizing new product launches and organizing special events to increase training in medical aesthetics, which is expected to significantly boost the adoption of lip fillers in the USA

Recent approvals by FDA have further pushed the commercialization of non-invasive lip fillers, making it one of the fastest-growing facial treatments in the USA

How is the Lip Fillers Market Faring in China?

Social Media Influencing the Young Generation for Lip Augmentation

Companies active in the lip fillers market are eyeing significant expansion opportunities in China. Consumers across China continue to be at the forefront of the demand for various types of lip augmentation procedures, which collectively make China no less than a gold mine of growth and expansion opportunities for companies producing lip fillers.

Social media and celebrities have made it sound like a routine. Patients are taking care of the facial volume and loss associated with aging. Rising individual expenditure on lip augmentation procedures is expected to increase the demand for lip fillers in China.

Category-wise Insights

Which is the Most Preferred Lip Filler Product?

Shift from Silicone to Hyaluronic Acid Lip Fillers Augmenting Market Growth

Hyaluronic acid lip fillers are projected to account for over 93.7% of the global market share in 2022. Lip augmentation with hyaluronic acid-based solutions will remain the most frequently requested procedure in aesthetic practices.

The use of liquid silicone for lip augmentation is losing its space in the consumer space, as dermal fillers are overshadowing the former with high convenience and enhanced outcomes. Considering the fact that hyaluronic acid products are a naturally-occurring compound found in human bodies, hyaluronic acid lip fillers pose minimum to no risks, unlike silicone injections that are unsafe in most cases.

In addition, hyaluronic acid also has a moisture-retaining effect that keeps the lips soft and makes them look hydrated, which is also a key attraction of hyaluronic acid lip fillers. However, voluminous lips offered by hyaluronic acid-based solutions do come at a heavy price, for the fact that the use of these fillers triggers minor to major complications in rare cases.

Vascular occlusion is one of the serious complications associated with the use of hyaluronic acid lip fillers, which can potentially harm blood vessels via clot formations.

Which End User Will Emerge as a Key Market Contributor?

Lip Fillers Carving an Attractive Niche in Hospitals with Emergence of Safer & Effective Procedures

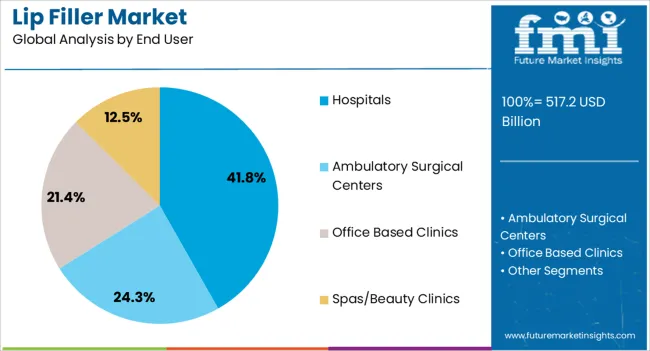
Lip fillers have gained immense popularity among all other types of lip augmentation procedures, for the fact that they can be easily availed at affordable prices at nearby hospitals.

Hospitals continue to remain at the forefront of the demand for lip filler solutions, thereby making them an attractive end-user target for market players to aim at. Market players are zooming in on their focus on long-term contracts with hospitals, which will be a key factor in ensuring continued profitability and long-term growth.

Competitive Landscape

Manufacturers are entering into long-term contracts with hospitals, surgical centers, and spas & beauty clinics, which ensures continued revenue growth for market players. Also, a handful of manufacturers are launching permanent lip fillers that can be tailored to meet every individual patient’s requirements and needs, considering the fact that personalization is emerging as the new normal across every industry.

Market players’ focus on mergers & acquisitions will remain intact, with the primary objective of attaining high growth via combined expertise and a shared pool of resources.

Lip Fillers Industry Report Scope

Attribute Details
Forecast Period 2022 to 2028
Historical Data Available for 2014 to 2021
Market Analysis Value in US$ Million
Key Regions Covered
  • North America
  • Latin America
  • Europe
  • East Asia
  • South Asia & Pacific
  • Middle East & Africa (MEA)
Key Countries Covered
  • USA
  • Canada
  • Mexico
  • Brazil
  • Mexico
  • Argentina
  • Germany
  • Italy
  • France
  • United Kingdom
  • Nordic
  • Spain
  • Japan
  • China
  • India
  • Malaysia
  • Thailand
  • Australia
  • GCC Countries
  • South Africa
  • Turkey
Key Market Segments Covered
  • Product
  • End User
  • Region
Key Companies Profiled
Pricing Available upon Request

Key Segments of Lip Fillers Industry Analysis

Lip Fillers Market by Product:

  • Hyaluronic Acid Lip Fillers
  • Poly-L-Lactic Acid Lip Fillers

Lip Fillers Market by End User:

  • Hospitals
  • Ambulatory Surgical Centers
  • Office Based Clinics
  • Spas/Beauty Clinics

Lip Fillers Market by Region:

  • North America
  • Latin America
  • Europe
  • East Asia
  • South Asia & Pacific
  • Middle East & Africa (MEA)

Frequently Asked Questions

What are the key drivers for the lip fillers market?

The growing urge to look good and increasing non-surgical cosmetic procedures are factors driving lip fillers market growth.

What is the size of the lip fillers market?

The global lip fillers market is estimated at US$ 1.3 Billion at the end of 2022.

Which are the leading players in the lip fillers market?

Major suppliers of lip fillers are ALLERGAN, Galderma Laboratories, Merz Pharma GmbH & Co. KGaA, Laboratoire Vivacy SAS, and DR. Korman.

Which segment has the largest market share of lip fillers?

Hyaluronic acid lip fillers account for 93.7% share of the global market.

What is the projected CAGR for the lip fillers market?

The global lip fillers market is projected to register a CAGR of 3.8% from 2022 to 2028.

Table of Content

1. Executive Summary | Lip Fillers Market

    1.1. Global Market Outlook

    1.2. Trends

    1.3. Technology Roadmap

    1.4. Analysis and Recommendations

2. Market Overview

    2.1. Market Coverage / Taxonomy

    2.2. Market Definition / Scope / Limitations

3. Key Market Trends

    3.1. Key Trends Impacting the Market

    3.2. Product Innovation / Development Trends

4. Key Success Factors

    4.1. Product Adoption / Usage Analysis

    4.2. Iceberg Analysis

    4.3. Key Promotional Strategies, By Manufacturers

    4.4. Comparison of top products

    4.5. Supply Chain Analysis

5. Global Market Demand (in Volume Units) Analysis 2014 to 2021 and Forecast, 2022 to 2029

    5.1. Historical Market Volume (Units) Analysis, 2014 to 2021

    5.2. Current and Future Market Volume (Units) Projections, 2022 to 2029

        5.2.1. Y-o-Y Growth Trend Analysis

        5.2.2. Absolute $ Opportunity Analysis

6. Global Market - Pricing Analysis

    6.1. Regional Pricing Analysis By Product Type

    6.2. Pricing Break-up

        6.2.1. Manufacturer-Level Pricing

        6.2.2. Distributor Level Pricing

    6.3. Global Average Pricing Analysis Benchmark

7. Global Market Demand (in Value or Size in US$ Million) Analysis 2014 to 2021 and Forecast, 2022 to 2029

    7.1. Historical Market Value (US$ Million) Analysis, 2014 to 2021

    7.2. Current and Future Market Value (US$ Million) Projections, 2022 to 2029

        7.2.1. Y-o-Y Growth Trend Analysis

        7.2.2. Absolute $ Opportunity Analysis

8. Market Background

    8.1. Macro-Economic Factors

        8.1.1. Global GDP Growth Outlook

        8.1.2. Global Healthcare Industry Market Outlook

    8.2. Forecast Factors - Relevance & Impact

        8.2.1. Increasing intensity in Research And Development

        8.2.2. Increasing Road Accidents

        8.2.3. Increasing Rate of Bone fractures and bone reconstructive surgeries

    8.3. Value Chain

    8.4. Market Dynamics

        8.4.1. Drivers

        8.4.2. Restraints

        8.4.3. Opportunity Analysis

9. Global Market Analysis 2014 to 2021 and Forecast 2022 to 2029, by Product Type 

    9.1. Introduction / Key Findings

    9.2. Historical Market Size (US$ Million) Analysis By Product Type, 2014 to 2021

    9.3. Current and Future Market Size (US$ Million) Analysis and Forecast By Product Type, 2022 to 2029

        9.3.1. Hyaluronic Acid

        9.3.2. Poly-L-Lactic Acid

    9.4. Market Attractiveness Analysis By Product Type

10. Global Market Analysis 2014 to 2021 and Forecast ­, by End User

    10.1. Introduction / Key Findings

    10.2. Historical Market Size (US$ Million) Analysis By End User, 2014 to 2021

    10.3. Current and Future Market Size (US$ Million) Analysis and Forecast By End User, 2022 to 2029

        10.3.1. Hospitals

        10.3.2. Ambulatory Surgical Centres

        10.3.3. Office-Based Clinics

        10.3.4. Spas/Beauty Clinics

    10.4. Market Attractiveness Analysis By End User

11. Global Market Analysis 2014 to 2021 and Forecast 2022 to 2029, by Region

    11.1. Introduction

    11.2. Historical Market Size (US$ Million) Analysis By Region, 2014 to 2021

    11.3. Current Market Size (US$ Million) Analysis and Forecast By Region, 2022 to 2029

        11.3.1. North America

        11.3.2. Latin America

        11.3.3. Europe

        11.3.4. Middle East and Africa (MEA)

        11.3.5. East Asia

        11.3.6. South Asia

        11.3.7. Oceania

    11.4. Market Attractiveness Analysis By Region

12. North America Market Analysis 2014 to 2021 and Forecast 2022 to 2029

    12.1. Introduction

    12.2. Pricing Analysis

    12.3. Historical Market Size (US$ Million) Trend Analysis By Market Taxonomy, 2014 to 2021

    12.4. Market Size (US$ Million) Forecast By Market Taxonomy, 2022 to 2029

        12.4.1. By Country

            12.4.1.1. USA

            12.4.1.2. Canada

        12.4.2. By Product Type

        12.4.3. By End User

    12.5. Market Attractiveness Analysis

        12.5.1. By Country

        12.5.2. By Product Type

        12.5.3. By End User

    12.6. Key Market Participants - Intensity Mapping

    12.7. Drivers and Restraints - Impact Analysis

13. Latin America Market Analysis 2014 to 2021 and Forecast 2022 to 2029

    13.1. Introduction

    13.2. Pricing Analysis

    13.3. Historical Market Size (US$ Million) Trend Analysis By Market Taxonomy, 2014 to 2021

    13.4. Market Size (US$ Million) Forecast By Market Taxonomy, 2022 to 2029

        13.4.1. By Country

            13.4.1.1. Brazil

            13.4.1.2. Mexico

            13.4.1.3. Rest of Latin America

        13.4.2. By Product Type

        13.4.3. By End User

    13.5. Market Attractiveness Analysis

        13.5.1. By Country

        13.5.2. By Product Type

        13.5.3. By End User

    13.6. Key Market Participants - Intensity Mapping

    13.7. Drivers and Restraints - Impact Analysis

14. Europe Market Analysis 2014 to 2021 and Forecast 2022 to 2029

    14.1. Introduction

    14.2. Pricing Analysis

    14.3. Historical Market Size (US$ Million) Trend Analysis By Market Taxonomy, 2014 to 2021

    14.4. Market Size (US$ Million) Forecast By Market Taxonomy, 2022 to 2029

        14.4.1. By Country

            14.4.1.1. Germany

            14.4.1.2. Italy

            14.4.1.3. France

            14.4.1.4. United Kingdom

            14.4.1.5. Spain

            14.4.1.6. BENELUX

            14.4.1.7. Russia

            14.4.1.8. Rest of Europe

        14.4.2. By Product Type

        14.4.3. By End User

    14.5. Market Attractiveness Analysis

        14.5.1. By Country

        14.5.2. By Product Type

        14.5.3. By End User

    14.6. Key Market Participants - Intensity Mapping

    14.7. Drivers and Restraints - Impact Analysis

15. Drivers and Restraints - Impact Analysis South Asia Market Analysis 2014 to 2021 and Forecast 2022 to 2029

    15.1. Introduction

    15.2. Pricing Analysis

    15.3. Historical Market Size (US$ Million) Trend Analysis By Market Taxonomy, 2014 to 2021

    15.4. Market Size (US$ Million) Forecast By Market Taxonomy, 2022 to 2029

        15.4.1. By Country

            15.4.1.1. India

            15.4.1.2. Thailand

            15.4.1.3. Indonesia

            15.4.1.4. Malaysia

            15.4.1.5. Rest of South Asia

        15.4.2. By Product Type

        15.4.3. By End User

    15.5. Market Attractiveness Analysis

        15.5.1. By Country

        15.5.2. By Product Type

        15.5.3. By End User

    15.6. Key Market Participants - Intensity Mapping

    15.7. Drivers and Restraints - Impact Analysis

16. East Asia Market Analysis 2014 to 2021 and Forecast 2022 to 2029

    16.1. Introduction

    16.2. Pricing Analysis

    16.3. Historical Market Size (US$ Million) Trend Analysis By Market Taxonomy, 2014 to 2021

    16.4. Market Size (US$ Million) Forecast By Market Taxonomy, 2022 to 2029

        16.4.1. By Country

            16.4.1.1. China

            16.4.1.2. Japan

            16.4.1.3. South Korea

        16.4.2. By Product Type

        16.4.3. By End User

    16.5. Market Attractiveness Analysis

        16.5.1. By Country

        16.5.2. By Product Type

        16.5.3. By End User

    16.6. Key Market Participants - Intensity Mapping

    16.7. Drivers and Restraints - Impact Analysis

17. Oceania Market Analysis 2014 to 2021 and Forecast 2022 to 2029

    17.1. Introduction

    17.2. Pricing Analysis

    17.3. Historical Market Size (US$ Million) Trend Analysis By Market Taxonomy, 2014 to 2021

    17.4. Market Size (US$ Million) Forecast By Market Taxonomy, 2022 to 2029

        17.4.1. By Country

            17.4.1.1. Australia

            17.4.1.2. New Zealand

        17.4.2. By Product Type

        17.4.3. By End User

    17.5. Market Attractiveness Analysis

        17.5.1. By Country

        17.5.2. By Product Type

        17.5.3. By End User

    17.6. Key Market Participants - Intensity Mapping

    17.7. Drivers and Restraints - Impact Analysis

18. Middle East and Africa Market Analysis 2014 to 2021 and Forecast 2022 to 2029

    18.1. Introduction

    18.2. Pricing Analysis

    18.3. Historical Market Size (US$ Million) Trend Analysis By Market Taxonomy, 2014 to 2021

    18.4. Market Size (US$ Million) Forecast By Market Taxonomy, 2022 to 2029

        18.4.1. By Country

            18.4.1.1. GCC Countries

            18.4.1.2. Turkey

            18.4.1.3. Northern Africa

            18.4.1.4. South Africa

            18.4.1.5. Rest of Middle East and Africa

        18.4.2. By Product Type

        18.4.3. By End User

    18.5. Market Attractiveness Analysis

        18.5.1. By Country

        18.5.2. By Product Type

        18.5.3. By End User

    18.6. Key Market Participants - Intensity Mapping

    18.7. Drivers and Restraints - Impact Analysis

19. Emerging Countries Market Analysis 2014 to 2021 and Forecast 2022 to 2029

    19.1. Introduction

        19.1.1. Market Value Proportion Analysis, By Key Countries

        19.1.2. Global Vs. Country Growth Comparison

    19.2. Brazil Market Analysis

        19.2.1. Introduction

        19.2.2. PESTEL Analysis

        19.2.3. Market Value Proportion Analysis by Market Taxonomy

        19.2.4. Market Value (US$ Million) Analysis and Forecast by Market Taxonomy

            19.2.4.1. By Product Type

            19.2.4.2. By End User

    19.3. South Korea Market Analysis

        19.3.1. Introduction

        19.3.2. Pricing Analysis

        19.3.3. PESTEL Analysis

        19.3.4. Market Value Proportion Analysis by Market Taxonomy

        19.3.5. Market and Value (US$ Million) Analysis and Forecast by Market Taxonomy

            19.3.5.1. By Product Type

            19.3.5.2. By End User

    19.4. Thailand Market Analysis

        19.4.1. Introduction

        19.4.2. Pricing Analysis

        19.4.3. PESTEL Analysis

        19.4.4. Market Value Proportion Analysis by Market Taxonomy

        19.4.5. Market Value (US$ Million) Analysis and Forecast by Market Taxonomy

            19.4.5.1. By Product Type

            19.4.5.2. By End User

20. Market Structure Analysis

    20.1. Market Analysis by Tier of Companies

    20.2. Market Concentration

    20.3. Market Share Analysis of Top Players

    20.4. Market Presence Analysis

        20.4.1. By Regional footprint of Players

        20.4.2. By Product foot print by Players

21. Competition Analysis

    21.1. Competition Dashboard

    21.2. Competition Benchmarking

    21.3. Competition Deep Dive

        21.3.1. Allergan

            21.3.1.1. Overview

            21.3.1.2. Product Portfolio

            21.3.1.3. Profitability by Market Segments (Product/Channel/Region)

            21.3.1.4. Sales Footprint

            21.3.1.5. Strategy Overview

                21.3.1.5.1. Marketing Strategy

                21.3.1.5.2. Product Strategy

                21.3.1.5.3. Channel Strategy

        21.3.2. Galderma laboratories

            21.3.2.1. Overview

            21.3.2.2. Product Portfolio

            21.3.2.3. Profitability by Market Segments (Product/Channel/Region)

            21.3.2.4. Sales Footprint

            21.3.2.5. Strategy Overview

                21.3.2.5.1. Marketing Strategy

                21.3.2.5.2. Product Strategy

                21.3.2.5.3. Channel Strategy

        21.3.3. Merz Pharma GmbH & Co. KGaA

            21.3.3.1. Overview

            21.3.3.2. Product Portfolio

            21.3.3.3. Profitability by Market Segments (Product/Channel/Region)

            21.3.3.4. Sales Footprint

            21.3.3.5. Strategy Overview

                21.3.3.5.1. Marketing Strategy

                21.3.3.5.2. Product Strategy

                21.3.3.5.3. Channel Strategy

        21.3.4. TEOXANE Laboratories

            21.3.4.1. Overview

            21.3.4.2. Product Portfolio

            21.3.4.3. Profitability by Market Segments (Product/Channel/Region)

            21.3.4.4. Sales Footprint

            21.3.4.5. Strategy Overview

                21.3.4.5.1. Marketing Strategy

                21.3.4.5.2. Product Strategy

                21.3.4.5.3. Channel Strategy

        21.3.5. Bohus BioTech AB

            21.3.5.1. Overview

            21.3.5.2. Product Portfolio

            21.3.5.3. Profitability by Market Segments (Product/Channel/Region)

            21.3.5.4. Sales Footprint

            21.3.5.5. Strategy Overview

                21.3.5.5.1. Marketing Strategy

                21.3.5.5.2. Product Strategy

                21.3.5.5.3. Channel Strategy

        21.3.6. Bioha Laboratories

            21.3.6.1. Overview

            21.3.6.2. Product Portfolio

            21.3.6.3. Profitability by Market Segments (Product/Channel/Region)

            21.3.6.4. Sales Footprint

            21.3.6.5. Strategy Overview

                21.3.6.5.1. Marketing Strategy

                21.3.6.5.2. Product Strategy

                21.3.6.5.3. Channel Strategy

        21.3.7. Aquamid

            21.3.7.1. Overview

            21.3.7.2. Product Portfolio

            21.3.7.3. Profitability by Market Segments (Product/Channel/Region)

            21.3.7.4. Sales Footprint

            21.3.7.5. Strategy Overview

                21.3.7.5.1. Marketing Strategy

                21.3.7.5.2. Product Strategy

                21.3.7.5.3. Channel Strategy

        21.3.8. Laboratoires Vivacy SAS

            21.3.8.1. Overview

            21.3.8.2. Product Portfolio

            21.3.8.3. Profitability by Market Segments (Product/Channel/Region)

            21.3.8.4. Sales Footprint

            21.3.8.5. Strategy Overview

                21.3.8.5.1. Marketing Strategy

                21.3.8.5.2. Product Strategy

                21.3.8.5.3. Channel Strategy

        21.3.9. Zimmer Aesthetics

            21.3.9.1. Overview

            21.3.9.2. Product Portfolio

            21.3.9.3. Profitability by Market Segments (Product/Channel/Region)

            21.3.9.4. Sales Footprint

            21.3.9.5. Strategy Overview

                21.3.9.5.1. Marketing Strategy

                21.3.9.5.2. Product Strategy

                21.3.9.5.3. Channel Strategy

        21.3.10. ADODERM GmbH

            21.3.10.1. Overview

            21.3.10.2. Product Portfolio

            21.3.10.3. Profitability by Market Segments (Product/Channel/Region)

            21.3.10.4. Sales Footprint

            21.3.10.5. Strategy Overview

                21.3.10.5.1. Marketing Strategy

                21.3.10.5.2. Product Strategy

                21.3.10.5.3. Channel Strategy

        21.3.11. Anika Therapeutics, Inc.

            21.3.11.1. Overview

            21.3.11.2. Product Portfolio

            21.3.11.3. Profitability by Market Segments (Product/Channel/Region)

            21.3.11.4. Sales Footprint

            21.3.11.5. Strategy Overview

                21.3.11.5.1. Marketing Strategy

                21.3.11.5.2. Product Strategy

                21.3.11.5.3. Channel Strategy

22. Assumptions and Acronyms Used

23. Research Methodology

Don't pay for what you don't need

Customize your report by selecting specific countries or regions and save 30%!

List of Tables

Table 01: Global Market (US$ Million) Analysis 2014 to 2021 and Forecast 2022 to 2029, By Product Type

Table 02: Global Market (US$ Million) Analysis 2014 to 2021 and Forecast 2022 to 2029, By End User

Table 03: Global Market (US$ Million) Analysis 2014 to 2021 and Forecast 2022 to 2029, By Region

Table 04: North America Market (US$ Million) Analysis 2014 to 2021 and Forecast 2022 to 2029, By Country

Table 05: North America Market (US$ Million) Analysis 2014 to 2021 and Forecast 2022 to 2029, By Product Type

Table 06: North America Market Volume (Units ‘000) Analysis 2014 to 2021 and Forecast 2022 to 2029, By Product Type

Table 07: North America Market (US$ Million) Analysis 2014 to 2021 and Forecast 2022 to 2029, By End User

Table 08: Latin America Market (US$ Million) Analysis 2014 to 2021 and Forecast 2022 to 2029, By Country

Table 09: Latin America Market (US$ Million) Analysis 2014 to 2021 and Forecast 2022 to 2029, By Product Type

Table 10: Latin America Market Volume (Units ‘000) Analysis 2014 to 2021 and Forecast 2022 to 2029, By Product Type

Table 11: Latin America Market (US$ Million) Analysis 2014 to 2021 and Forecast 2022 to 2029, By End User

Table 12: Europe Market (US$ Million) Analysis 2014 to 2021 and Forecast 2022 to 2029, By Country

Table 13: Europe Market (US$ Million) Analysis 2014 to 2021 and Forecast 2022 to 2029, By Product Type

Table 14: Europe Market Volume (Units ‘000) Analysis 2014 to 2021 and Forecast 2022 to 2029, By Product Type

Table 15: Europe Market (US$ Million) Analysis 2014 to 2021 and Forecast 2022 to 2029, By End User

Table 16: South Asia Market (US$ Million) Analysis 2014 to 2021 and Forecast 2022 to 2029, By Country

Table 17: South Asia Market (US$ Million) Analysis 2014 to 2021 and Forecast 2022 to 2029, By Product Type

Table 18: South Asia Market Volume (Units ‘000) Analysis 2014 to 2021 and Forecast 2022 to 2029, By Product Type

Table 19: South Asia Market (US$ Million) Analysis 2014 to 2021 and Forecast 2022 to 2029, By End User

Table 20: East Asia Market (US$ Million) Analysis 2014 to 2021 and Forecast 2022 to 2029, By Country

Table 21: East Asia Market (US$ Million) Analysis 2014 to 2021 and Forecast 2022 to 2029, By Product Type

Table 22: East Asia Market Volume (Units ‘000) Analysis 2014 to 2021 and Forecast 2022 to 2029, By Product Type

Table 23: East Asia Market (US$ Million) Analysis 2014 to 2021 and Forecast 2022 to 2029, By End User

Table 24: Oceania Market (US$ Million) Analysis 2014 to 2021 and Forecast 2022 to 2029, By Country

Table 25: Oceania Market (US$ Million) Analysis 2014 to 2021 and Forecast 2022 to 2029, By Product Type

Table 26: Oceania Market Volume (Units ‘000) Analysis 2014 to 2021 and Forecast 2022 to 2029, By Product Type

Table 27: Oceania Market (US$ Million) Analysis 2014 to 2021 and Forecast 2022 to 2029, By End User

Table 28: MEA Market (US$ Million) Analysis 2014 to 2021 and Forecast 2022 to 2029, By Country

Table 29: MEA Market (US$ Million) Analysis 2014 to 2021 and Forecast 2022 to 2029, By Product Type

Table 30: MEA Market Volume (Units ‘000) Analysis 2014 to 2021 and Forecast 2022 to 2029, By Product Type

Table 31: MEA Market (US$ Million) Analysis 2014 to 2021 and Forecast 2022 to 2029, By End User

Table 32: Global Market Value (US$ Million) Analysis 2014 to 2021 and Forecast 2022 to 2029 by Region

Table 33: Brazil Market (US$ Million) Analysis 2014 to 2021 and Forecast 2022 to 2029, By Product Type

Table 34: Brazil Market Volume (Units ‘000) Analysis 2014 to 2021 and Forecast 2022 to 2029, By Product Type

Table 35: Brazil Market (US$ Million) Analysis 2014 to 2021 and Forecast 2022 to 2029, By End User

Table 36: Thailand Market (US$ Million) Analysis 2014 to 2021 and Forecast 2022 to 2029, By Product Type

Table 37: Thailand Market Volume (Units ‘000) Analysis 2014 to 2021 and Forecast 2022 to 2029, By Product Type

Table 38: Thailand Market (US$ Million) Analysis 2014 to 2021 and Forecast 2022 to 2029, By End User

Table 39: South Korea Market (US$ Million) Analysis 2014 to 2021 and Forecast 2022 to 2029, By Product Type

Table 40: South Korea Market Volume (Units ‘000) Analysis 2014 to 2021 and Forecast 2022 to 2029, By Product Type

Table 41: South Korea Market (US$ Million) Analysis 2014 to 2021 and Forecast 2022 to 2029, By End User
Sabyasachi Ghosh
Sabyasachi Ghosh

Principal Consultant

Talk to Analyst

Find your sweet spots for generating winning opportunities in this market.

List of Charts

Figure 01: Market Share, 2022 & 2028

Figure 02: Global Volume Analysis (Units ‘000), 2014 to 2021

Figure 03: Global Volume Forecast (Units ‘000), 2022 to 2029

Figure 04: Regional Average Pricing Analysis (US$) of Hyaluronic Acid, (2021)

Figure 05: Regional Average Pricing Analysis (US$) of Poly-L-Lactic Acid, (2021)

Figure 06: Global Market Value Analysis and Forecast, 2022 to 2029 (US$ Million)

Figure 07: Global Market Absolute $ Opportunity (US$ Million), 2014 to 2021

Figure 08: Global Market Absolute $ Opportunity (US$ Million), 2022 to 2029

Figure 09: World GDP (Nominal) by Selected Economies, 2017

Figure 10: Global Healthcare Expenditure in US$ Bn (2013 to 2020)

Figure 11: Market (US$ Million) Analysis, Hyaluronic Acid segment, 2014 to 2021

Figure 12: Market Y-o-Y Growth (%), by Hyaluronic Acid segment, 2022 to 2029

Figure 13: Market (US$ Million) Analysis, by Poly-L-Lactic Acid segment, 2014 to 2021

Figure 14: Market Y-o-Y Growth (%), by Poly-L-Lactic Acid segment, 2022 to 2029

Figure 15: Market (US$ Million) Analysis, by Hospitals segment, 2014 to 2021

Figure 16: Market Y-o-Y Growth (%), by Hospitals segment, 2022 to 2029

Figure 17: Market (US$ Million) Analysis, by Ambulatory Surgical Centers segment, 2014 to 2021

Figure 18: Market Y-o-Y Growth (%), by Ambulatory Surgical Centers segment, 2022 to 2029

Figure 19: Market (US$ Million) Analysis, by Office-Based Clinics segment, 2014 to 2021

Figure 20: Market Y-o-Y Growth (%), by Office Based Clinics segment, 2022 to 2029

Figure 21: Market (US$ Million) Analysis, by Spas/Beauty Clinics segment, 2014 to 2021

Figure 22: Market Y-o-Y Growth (%), by Spas/Beauty Clinics segment, 2022 to 2029

Figure 23: Global Market Attractiveness Analysis, By Product Type

Figure 24: Global Market Attractiveness Analysis, By End User

Figure 25: Global Market Attractiveness Analysis, By Region

Figure 26: North America Market share, by Product Type (2021)

Figure 27: North America Market, Snapshot

Figure 28: North America Market (US$ Million), 2014 to 2021

Figure 29: North America Market (US$) & Y-o-Y Growth (%), 2022 to 2029

Figure 30: North America Market Attractiveness Analysis, By Product Type

Figure 31: North America Market Attractiveness Analysis, By End User

Figure 32: North America Market Attractiveness Analysis, By Country

Figure 33: Latin America Market share, by Product Type (2021)

Figure 34: Latin America Market, Snapshot

Figure 35: Latin America Market (US$ Million), 2014 to 2021

Figure 36: Latin America Market (US$) & Y-o-Y Growth (%), 2022 to 2029

Figure 37: Latin America Market Attractiveness Analysis, By Product Type

Figure 38: Latin America Market Attractiveness Analysis, By End User

Figure 39: Latin America Market Attractiveness Analysis, By Country

Figure 40: Europe Market share, by Product Type (2021)

Figure 41: Europe Market, Snapshot

Figure 42: Europe Market (US$ Million), 2014 to 2021

Figure 43: Europe Market (US$) & Y-o-Y Growth (%), 2022 to 2029

Figure 44: Europe Market Attractiveness Analysis, By Product Type

Figure 45: Europe Market Attractiveness Analysis, By End User

Figure 46: Europe Market Attractiveness Analysis, By Country

Figure 47: South Asia Market share, by Product Type (2021)

Figure 48: South Asia Market, Snapshot

Figure 49: South Asia Market (US$ Million), 2014 to 2021

Figure 50: South Asia Market (US$) & Y-o-Y Growth (%), 2022 to 2029

Figure 51: South Asia Market Attractiveness Analysis, By Product Type

Figure 52: South Asia Market Attractiveness Analysis, By End User

Figure 53: South Asia Market Attractiveness Analysis, By Country

Figure 54: East Asia Market share, by Product Type (2021)

Figure 55: East Asia Market, Snapshot

Figure 56: East Asia Market (US$ Million), 2014 to 2021

Figure 57: East Asia Market (US$) & Y-o-Y Growth (%), 2022 to 2029

Figure 58: East Asia Market Attractiveness Analysis, By Product Type

Figure 59: East Asia Market Attractiveness Analysis, By End User

Figure 60: East Asia Market Attractiveness Analysis, By Country

Figure 61: Oceania Market share, by Product Type (2021)

Figure 62: Oceania Market, Snapshot

Figure 63: Oceania Market (US$ Million), 2014 to 2021

Figure 64: Oceania Market (US$) & Y-o-Y Growth (%), 2022 to 2029

Figure 65: Oceania Market Attractiveness Analysis, By Product Type

Figure 66: Oceania Market Attractiveness Analysis, By End User

Figure 67: Oceania Market Attractiveness Analysis, By Country

Figure 68: MEA Market share, by Product Type (2021)

Figure 69: MEA Market, Snapshot

Figure 70: MEA Market (US$ Million), 2014 to 2021

Figure 71: MEA Market (US$) & Y-o-Y Growth (%), 2022 to 2029

Figure 72: MEA Market Attractiveness Analysis, By Product Type

Figure 73: MEA Market Attractiveness Analysis, By End User

Figure 74: MEA Market Attractiveness Analysis, By Country

Figure 75: Emerging Countries Market Value Share (2019A)

Figure 76: Emerging Countries Market Value (US$ Million) by Key Countries, 2018A, 2023F & 2029E

Figure 77: Brazil Value (US$ Million) Analysis, 2014 to 2021

Figure 78: Brazil Value (US$ Million) & Y-o-Y Growth (%), 2022 to 2029

Figure 79: Thailand Value (US$ Million) Analysis, 2014 to 2021

Figure 80: Thailand Value (US$ Million) & Y-o-Y Growth (%), 2022 to 2029

Figure 81: South Korea Value (US$ Million) Analysis, 2014 to 2021

Figure 82: South Korea Value (US$ Million) & Y-o-Y Growth (%), 2022 to 2029

Recommendations

Healthcare

Dermal Filler Market

Published : January 2024

Healthcare

Dermatology Devices Market

Published : September 2023

Healthcare

Dermatology Lasers Market

Published : March 2023

Healthcare

Dermal Fillers and Botulinum Toxin Market

Published : October 2022

Explore Healthcare Insights

View Reports