Haircare Supplement Market Size and Share Forecast Outlook 2025 to 2035

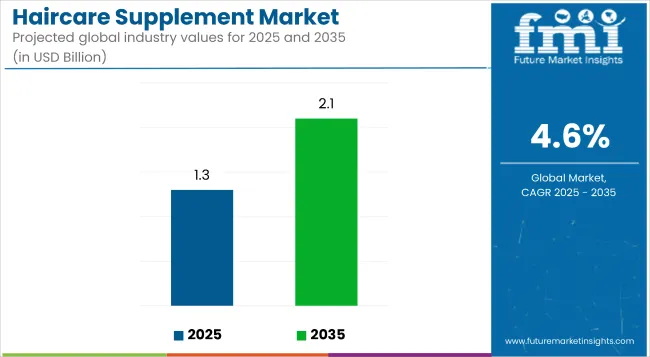
The global haircare supplement market is valued at USD 1.3 billion in 2025 and is slated to reach USD 2.1 billion by 2035, reflecting a CAGR of 4.6%. Growth is expected to be driven by increasing hair and scalp-related issues caused by air pollution and lifestyle factors.
Quick Stats for Haircare Supplement Market

  • Market Value (2025): USD 1.3 billion
  • Forecast Value (2035): USD 2.1 billion
  • Forecast CAGR: 4.6%
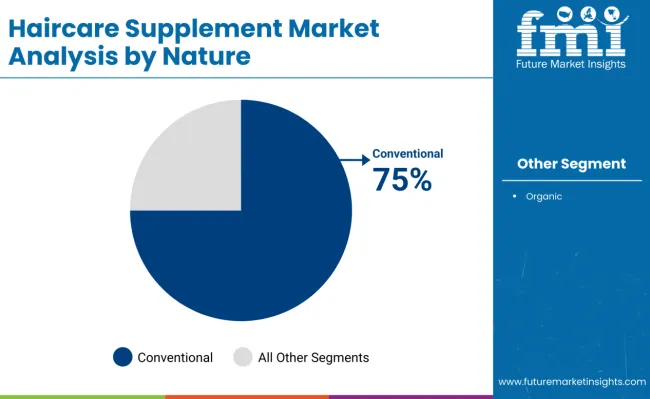
  • Nature Segment in 2025: Conventional (75% Market Share)
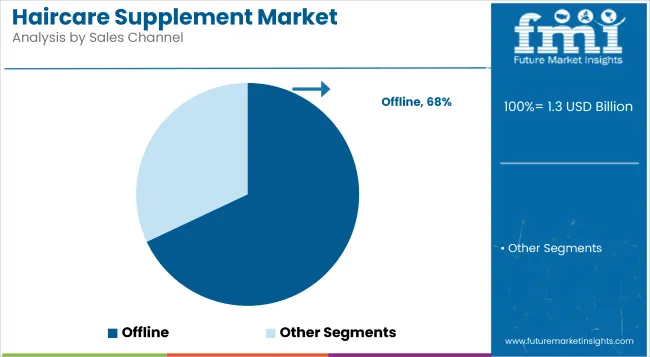
  • Top Sales Channel: Offline (68% Market Share)
  • Key Growth Region: East Asia (Japan is the fastest-growing market with 5.2% CAGR)

Haircare Supplement Market

Metric Value
Market Value (2025) USD 1.3 billion
Market Value (2035) USD 2.1 billion
CAGR (2025 to 2035) 4.6%

Rising consumer awareness of beauty and grooming, combined with the demand for supplements supporting hair regrowth and strength, is also expected to propel the market. Additionally, the growing popularity of influencer marketing is enhancing market penetration and brand visibility.

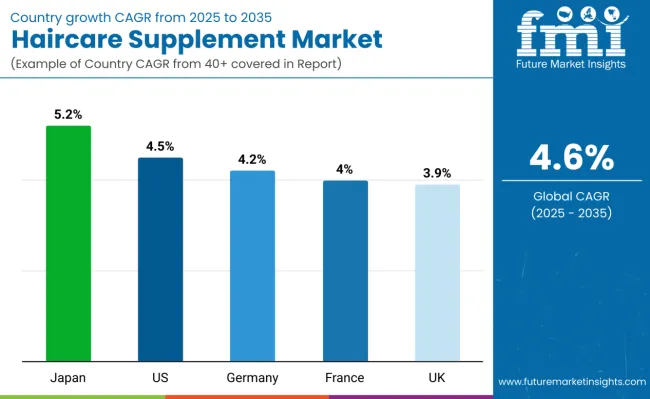
Japan is projected to grow at a CAGR of 5.2% from 2025 to 2035, driven by an ageing population demanding collagen-based beauty supplements. The USA is expected to register a CAGR of 4.5%, supported by high consumer spending on wellness products and the popularity of biotin gummies.

Germany is forecasted to grow at a CAGR of 4.2%, driven by demand for collagen and vitamin-based supplements with clinically validated formulations. In 2025, the conventional segment is projected to lead the nature category with a 75% share, while the offline segment will dominate sales channels with a 68% share.

The market holds a relatively small but steadily growing percentage within its parent markets. In the global nutraceuticals market, haircare supplements contribute less than 1%, reflecting their niche positioning. Within the dietary supplements market, haircare supplements account for around 0.5% to 1%, driven by increasing demand for beauty-from-within products.

In the broader personal care and beauty market, their share remains minimal but is rising as consumers increasingly integrate ingestible beauty supplements alongside topical treatments to achieve holistic hair health and grooming goals.

Analyzing Haircare Supplement Market by Top Investment Segments

The market segments include type, nature, form, functionality, sales channel, and region. The type segment covers biotin, vitamin A, saw palmetto extract, vitamin D, folic acid, vitamin E, collagen, omega-3 fatty acids, vitamin B complex, and vitamin C. The nature segment includes organic and conventional.

The form segment comprises tablets/pills, capsules, liquid, powder, gummies/chewable, and others such as (sprays, soft gels, effervescent tablets, and hair supplement drops). The functionality segment includes hair re-growth, hair thinning, hair fall, and dandruff.

The sales channel segment covers offline (hypermarkets/supermarkets, specialty stores, convenience stores, departmental stores, drug stores & pharmacies, health & wellness stores) and online (e-commerce, others). The regional segment includes North America, Latin America, Europe, East Asia, South Asia, Oceania, and the Middle East & Africa.

Biotin to Lead the Type Segment with 28% Market Share in 2025

Haircare Supplement Market Analysis By Type

The biotin segment is expected to continue to be the most profitable within the type category, holding a dominant market share of 28% in 2025.
  • Collagen is witnessing increasing adoption as it supports hair structure, improves strength, and addresses age-related hair thinning, making it popular among elderly consumers.
  • Vitamin E helps repair damaged hair and improve scalp circulation, while omega-3 nourishes hair follicles and enhances shine.

Conventional to Lead the Nature Segment with 75% Market Share in 2025

Haircare Supplement Market Analysis By Natural

The conventional segment is projected to remain the most lucrative within the nature category, accounting for a dominant market share of approximately 75% in 2025.

  • This dominance is driven by the availability, affordability, and consumer trust in conventional haircare supplements.
  • Organic supplements are gaining traction among health-conscious consumers seeking natural and sustainable formulations.

Gummies/Chewables to Lead the Form Segment with 36% Market Share in 2025

Haircare Supplement Market Analysis By Form

The gummies/chewable segment is expected to remain the most lucrative, holding a significant market share of 36% in 2025.

  • This leadership is driven by their palatable taste, ease of consumption, and attractive fruit-based flavours that encourage consistent daily intake among consumers.
  • Liquid haircare supplements are gaining traction among consumers seeking faster absorption, while powders are witnessing steady growth due to their inclusion in functional beverages.

Hair Re-growth to Lead the Functionality Segment with 42% Market Share in 2025

Haircare Supplement Market Analysis By Functionality

The hair re-growth segment is poised to remain the most lucrative, holding a considerable market share of 42% in 2025.
  • This dominance is driven by increasing consumer focus on reversing hair loss and enhancing hair density, particularly among ageing populations and individuals experiencing pattern baldness.
  • The dandruff segment is steadily expanding, driven by consumer preference for supplements targeting scalp health, sebum balance, and microbial control to maintain clean, flake-free hair.

Offline to Lead the Sales Channel Segment with 68% Market Share in 2025

Haircare Supplement Market Analysis By Sales Channel

The offline segment is anticipated to remain the most lucrative, holding a substantial market share of 68% in 2025.

  • Hypermarkets and supermarkets attract consumers with diverse product options and promotional offers, while specialty stores and health & wellness stores cater to premium and niche supplement demands.
  • The online segment is witnessing rapid growth, driven by rising e-commerce penetration, convenient home delivery, and discount offers.

Top Haircare Supplement Market Dynamics

The global market is growing steadily, driven by rising consumer demand for beauty-from-within solutions, increasing prevalence of hair thinning and hair fall issues, and advancements in biotin, collagen, and multivitamin formulations targeting hair regrowth and scalp health.
Recent Trends in the Haircare Supplement Market

  • Increasing demand for gummies and chewable hair supplements with natural fruit flavours.
  • Rising consumer preference for collagen-based supplements targeting hair thinning and ageing concerns.
  • Surge in influencer marketing and social media endorsements driving product visibility.
  • Growing launches of personalised haircare supplements tailored to individual needs.

Challenges in the Haircare Supplement Market

  • Stringent regulatory approvals are delaying new product launches.
  • High raw material costs are affecting profit margins for manufacturers.
  • Limited consumer awareness in developing regions restricts market penetration.
  • Intense market competition leading to price pressures and brand dilution.

Analyzing Top Countries Producing and Supplying Haircare Supplement Products

Japan is projected to lead the market with the highest CAGR of 5.2% from 2025 to 2035, driven by its ageing population and demand for collagen-based beauty supplements. The USA follows with a 4.5% CAGR, supported by premium spending on biotin and collagen products.

Germany is expected to grow at a 4.2% CAGR, driven by collagen supplement adoption and gummies’ popularity. France is projected to expand at 4.0% CAGR, supported by rising beauty consciousness and organic supplement demand. The UK shows stable growth at 3.9% CAGR, driven by clean beauty trends and vegan formulations gaining traction.

The report covers an in-depth analysis of 40+ countries; five top-performing OECD countries are highlighted below.

USA Haircare Supplement Market Analysis

The USA haircare supplement market is anticipated to grow at a CAGR of 4.5% from 2025 to 2035.

  • Rising preference for biotin and collagen hair supplements.
  • Strong presence of key players like Nutrafol and Capillus.
  • Growing demand for clean-label and organic formulations.
  • High R&D investments in haircare supplement innovations.

Haircare Supplement Demand Analysis in the UK

Sales of haircare supplements in the UK are projected to grow at a CAGR of 3.9% from 2025 to 2035.

  • Growing popularity of vegan and cruelty-free supplements.
  • Rising consumer focus on clean beauty and wellness.
  • Expansion of e-commerce sales channels for supplements.
  • Emerging startups offering personalised haircare formulations.

Haircare Supplement Demand Analysis in Germany

Germany’s haircare supplement revenue is expected to grow at a CAGR of 4.2% from 2025 to 2035.

  • Increasing adoption of collagen supplements for hair and skin health.
  • Strong presence of premium hair supplement brands.
  • Expansion of specialty beauty and wellness stores.
  • Growing demand for clinically tested haircare supplements.

France Haircare Supplement Market Analysis

The haircare supplement revenue in France is expected to grow at a CAGR of 4.0% from 2025 to 2035.

  • Growing demand for natural and organic hair supplements.
  • Expansion of pharmacy and wellness retail channels.
  • Rising popularity of supplements targeting hair regrowth.
  • Strong focus on biotin and vitamin-based formulations.

Japan Haircare Supplement Market Analysis

Japan’s haircare supplement revenue is projected to grow at a CAGR of 5.2% from 2025 to 2035.
  • Rising demand for collagen-infused hair supplements.
  • Growing consumer preference for functional beauty foods.
  • Expansion of online and convenience store distribution.
  • Strong innovation in hair health and anti-ageing supplement products.

Leading Haircare Supplement Producers and Suppliers

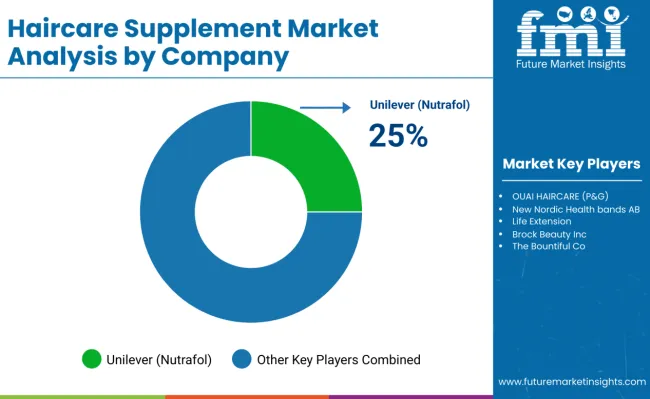
The market is moderately fragmented, with key global players and emerging brands competing through innovation, strategic partnerships, and targeted pricing strategies. Leading companies include OUAI HAIRCARE (P&G), New Nordic Health bands AB, and Nutraceutical Wellness Inc. (Unilever), which hold substantial market shares due to their strong brand recognition, extensive distribution networks, and investment in clinically backed formulations.

For example, OUAI HAIRCARE focuses on premium hair health supplements targeting millennial consumers, while Nutraceutical Wellness Inc., under Unilever, is expanding its product lines to include personalised hair and beauty supplements.

Recent Haircare Supplement Industry News

  • In November 2024, Hum Nutrition, a wellness brand, introduced its newest offering: the Hair Strong Capsule. Clinically tested, this innovative formula is proven to boost hair growth while enhancing strength, providing a comprehensive solution for healthier, more resilient hair.

Haircare Supplement Market Report Scope

Report Attributes Details
Current Total Market Size (2025) USD 1.3 billion
Projected Market Size (2035) USD 2.1 billion
CAGR (2025 to 2035) 4.6%
Base Year for Estimation 2024
Historical Period 2020 to 2024
Projections Period 2025 to 2035
Market Analysis Parameters Revenue in USD billions/Volume in Units
By Type Biotin, Vitamin A, Saw Palmetto Extract, Vitamin D, Folic Acid, Vitamin E, Collagen, Omega-3 Fatty Acids, Vitamin B Complex, Vitamin C
By Nature Organic, Conventional
By Form Tablets/Pills, Capsules, Liquid, Powder, Gummies/Chewable, Others (Sprays, Soft Gels, Effervescent Tablets, and Hair Supplement Drops)
By Functionality Hair Re-growth, Hair Thinning, Hair Fall, Dandruff
By Sales Channel Offline (Hypermarkets/Supermarkets, Specialty Stores, Convenience Stores, Departmental Stores, Drug Stores & Pharmacies, Health & Wellness Stores), Online (E-commerce, Brand Websites, D2C Platforms)
Regions Covered North America, Latin America, Western Europe, Eastern Europe, East Asia, South Asia & Pacific, Middle East & Africa
Countries Covered United States, Canada, United Kingdom, Germany, France, China, Japan, South Korea, Brazil, Australia
Key Players OUAI HAIRCARE (P&G), New Nordic Health bands AB, Nutraceutical Wellness Inc. (Unilever), Life Extension, Brock Beauty Inc., The Bountiful Co., Source Naturals, Inc., Viva Naturals, Nutra Champs, GNC Holdings, Inc. (Harbin Pharmaceutical Group)
Additional Attributes Dollar sales by value, market share analysis by region, and country-wise analysis

Key Segmentation

By Type:

  • Biotin
  • Vitamin A
  • Saw Palmetto Extract
  • Vitamin D
  • Folic Acid
  • Vitamin E
  • Collagen
  • Omega-3 Fatty Acids
  • Vitamin B Complex
  • Vitamin C

By Nature:

  • Organic
  • Conventional

By Form:

  • Tablets / Pills
  • Capsules
  • Liquid
  • Powder
  • Gummies / Chewable
  • Others

By Functionality:

  • Hair Re-growth
  • Hair Thinning
  • Hair Fall
  • Dandruff

By Sales Channel:

  • Offline
    • Hypermarkets / Supermarkets
    • Specialty Stores
    • Convenience Stores
    • Departmental Stores
    • Drug Stores & Pharmacies
    • Health & Wellness Stores
  • Online
    • E-commerce
    • Others

By Region:

  • North America
  • Latin America
  • Europe
  • East Asia
  • South Asia
  • Oceania
  • Middle East & Africa

Table of Content

  1. Executive Summary
    • Global Market Outlook
    • Demand-side Trends
    • Supply-side Trends
    • Technology Roadmap Analysis
    • Analysis and Recommendations
  2. Market Overview
    • Market Coverage/Taxonomy
    • Market Definition/Scope/Limitations
  3. Market Background
    • Market Dynamics
      • Drivers
      • Restraints
      • Opportunity
      • Trends
    • Scenario Forecast
      • Demand in Optimistic Scenario
      • Demand in Likely Scenario
      • Demand in Conservative Scenario
    • Opportunity Map Analysis
    • Product Life Cycle Analysis
    • Supply Chain Analysis
      • Supply Side Participants and their Roles
        • Producers
        • Mid-Level Participants (Traders/ Agents/ Brokers)
        • Wholesalers and Distributors
      • Value Added and Value Created at Node in the Supply Chain
      • List of Raw Material Suppliers
      • List of Existing and Potential Buyer’s
    • Investment Feasibility Matrix
    • Value Chain Analysis
      • Profit Margin Analysis
      • Wholesalers and Distributors
      • Retailers
    • PESTLE and Porter’s Analysis
    • Regulatory Landscape
      • By Key Regions
      • By Key Countries
    • Regional Parent Market Outlook
    • Production and Consumption Statistics
    • Import and Export Statistics
  4. Global Market Analysis 2020 to 2024 and Forecast, 2025 to 2035
    • Historical Market Size Value (USD Billion) & Volume (Units) Analysis, 2020 to 2024
    • Current and Future Market Size Value (USD Billion) & Volume (Units) Projections, 2025 to 2035
      • Y-o-Y Growth Trend Analysis
      • Absolute $ Opportunity Analysis
  5. Global Market Pricing Analysis 2020 to 2024 and Forecast 2025 to 2035
  6. Global Market Analysis 2020 to 2024 and Forecast 2025 to 2035, By Type
    • Introduction/Key Findings
    • Historical Market Size Value (USD Billion) & Volume (Units) Analysis By Type, 2020 to 2024
    • Current and Future Market Size Value (USD Billion) & Volume (Units) Analysis and Forecast By Type, 2025 to 2035
      • Biotin
      • Vitamin A
      • Saw Palmetto Extract
      • Vitamin D
      • Folic Acid
      • Vitamin E
      • Collagen
      • Omega-3 Fatty Acids
      • Vitamin B Complex
      • Vitamin C
    • Y-o-Y Growth Trend Analysis By Type, 2020 to 2024
    • Absolute $ Opportunity Analysis By Type, 2025 to 2035
  7. Global Market Analysis 2020 to 2024 and Forecast 2025 to 2035, By Nature
    • Introduction/Key Findings
    • Historical Market Size Value (USD Billion) & Volume (Units) Analysis By Nature, 2020 to 2024
    • Current and Future Market Size Value (USD Billion) & Volume (Units) Analysis and Forecast By Nature, 2025 to 2035
      • Organic
      • Conventional
    • Y-o-Y Growth Trend Analysis By Nature, 2020 to 2024
    • Absolute $ Opportunity Analysis By Nature, 2025 to 2035
  8. Global Market Analysis 2020 to 2024 and Forecast 2025 to 2035, By Form
    • Introduction/Key Findings
    • Historical Market Size Value (USD Billion) & Volume (Units) Analysis By Form, 2020 to 2024
    • Current and Future Market Size Value (USD Billion) & Volume (Units) Analysis and Forecast By Form, 2025 to 2035
      • Tablets/Pills
      • Capsules
      • Liquid
      • Powder
      • Gummies/Chewable
      • Others
        • Sprays
        • Soft Gels
        • Effervescent Tablets
        • Hair Supplement Drops
    • Y-o-Y Growth Trend Analysis By Form, 2020 to 2024
    • Absolute $ Opportunity Analysis By Form, 2025 to 2035
  9. Global Market Analysis 2020 to 2024 and Forecast 2025 to 2035, By Functionality
    • Introduction/Key Findings
    • Historical Market Size Value (USD Billion) & Volume (Units) Analysis By Functionality, 2020 to 2024
    • Current and Future Market Size Value (USD Billion) & Volume (Units) Analysis and Forecast By Functionality, 2025 to 2035
      • Hair Re-growth
      • Hair Thinning
      • Hair Fall
      • Dandruff
    • Y-o-Y Growth Trend Analysis By Functionality, 2020 to 2024
    • Absolute $ Opportunity Analysis By Functionality, 2025 to 2035
  10. Global Market Analysis 2020 to 2024 and Forecast 2025 to 2035, By Sales Channels
    • Introduction/Key Findings
    • Historical Market Size Value (USD Billion) & Volume (Units) Analysis By Sales Channels, 2020 to 2024
    • Current and Future Market Size Value (USD Billion) & Volume (Units) Analysis and Forecast By Sales Channels, 2025 to 2035
      • Offline
        • Hypermarkets/Supermarkets
        • Specialty Stores
        • Convenience Stores
        • Departmental Stores
        • Drug Stores & Pharmacies
        • Health & Wellness Stores
      • Online
        • E-commerce
        • Others (Brand Websites, D2C Platforms)
    • Y-o-Y Growth Trend Analysis By Sales Channels, 2020 to 2024
    • Absolute $ Opportunity Analysis By Sales Channels, 2025 to 2035
  11. Global Market Analysis 2020 to 2024 and Forecast 2025 to 2035, By Region
    • Introduction
    • Historical Market Size Value (USD Billion) & Volume (Units) Analysis By Region, 2020 to 2024
    • Current Market Size Value (USD Billion) & Volume (Units) Analysis and Forecast By Region, 2025 to 2035
      • USA
      • Latin America
      • Western Europe
      • Eastern Europe
      • East Asia
      • South Asia & Pacific
      • Middle East and Africa
    • Market Attractiveness Analysis By Region
  12. USA Market Analysis 2020 to 2024 and Forecast 2025 to 2035, By Country
    • Historical Market Size Value (USD Billion) & Volume (Units) Trend Analysis By Market Taxonomy, 2020 to 2024
    • Market Size Value (USD Billion) & Volume (Units) Forecast By Market Taxonomy, 2025 to 2035
      • By Country
        • Canada
        • Brazil
        • Mexico
        • Argentina
      • By Type
      • By Nature
      • By Form
      • By Functionality
      • By Sales Channels
    • Market Attractiveness Analysis
      • By Country
      • By Type
      • By Nature
      • By Form
      • By Functionality
      • By Sales Channels
    • Key Takeaways
  13. Latin America Market Analysis 2020 to 2024 and Forecast 2025 to 2035, By Country
    • Historical Market Size Value (USD Billion) & Volume (Units) Trend Analysis By Market Taxonomy, 2020 to 2024
    • Market Size Value (USD Billion) & Volume (Units) Forecast By Market Taxonomy, 2025 to 2035
      • By Country
        • Brazil
        • Argentina
        • Rest of LATAM
      • By Type
      • By Nature
      • By Form
      • By Functionality
      • By Sales Channels
    • Market Attractiveness Analysis
      • By Country
      • By Type
      • By Nature
      • By Form
      • By Functionality
      • By Sales Channels
    • Key Takeaways
  14. Western Europe Market Analysis 2020 to 2024 and Forecast 2025 to 2035, By Country
    • Historical Market Size Value (USD Billion) & Volume (Units) Trend Analysis By Market Taxonomy, 2020 to 2024
    • Market Size Value (USD Billion) & Volume (Units) Forecast By Market Taxonomy, 2025 to 2035
      • By Country
        • Germany
        • Italy
        • France
        • UK
        • Spain
        • BENELUX
        • Nordic
        • Rest of W.Europe
      • By Type
      • By Nature
      • By Form
      • By Functionality
      • By Sales Channels
    • Market Attractiveness Analysis
      • By Country
      • By Type
      • By Nature
      • By Form
      • By Functionality
      • By Sales Channels
    • Key Takeaways
  15. Eastern Europe Market Analysis 2020 to 2024 and Forecast 2025 to 2035, By Country
    • Historical Market Size Value (USD Billion) & Volume (Units) Trend Analysis By Market Taxonomy, 2020 to 2024
    • Market Size Value (USD Billion) & Volume (Units) Forecast By Market Taxonomy, 2025 to 2035
      • By Country
        • Russia
        • Hungary
        • Poland
        • Balkan & Baltics
        • Rest of E. Europe
      • By Type
      • By Nature
      • By Form
      • By Functionality
      • By Sales Channels
    • Market Attractiveness Analysis
      • By Country
      • By Type
      • By Nature
      • By Form
      • By Functionality
      • By Sales Channels
    • Key Takeaways
  16. East Asia Market Analysis 2020 to 2024 and Forecast 2025 to 2035, By Country
    • Historical Market Size Value (USD Billion) & Volume (Units) Trend Analysis By Market Taxonomy, 2020 to 2024
    • Market Size Value (USD Billion) & Volume (Units) Forecast By Market Taxonomy, 2025 to 2035
      • By Country
        • China
        • Japan
        • South Korea
      • By Type
      • By Nature
      • By Form
      • By Functionality
      • By Sales Channels
    • Market Attractiveness Analysis
      • By Country
      • By Type
      • By Nature
      • By Form
      • By Functionality
      • By Sales Channels
    • Key Takeaways
  17. South Asia & Pacific Market Analysis 2020 to 2024 and Forecast 2025 to 2035, By Country
    • Historical Market Size Value (USD Billion) & Volume (Units) Trend Analysis By Market Taxonomy, 2020 to 2024
    • Market Size Value (USD Billion) & Volume (Units) Forecast By Market Taxonomy, 2025 to 2035
      • By Country
        • India
        • Australia & New Zealand
        • ASEAN
        • Rest of SAP
      • By Type
      • By Nature
      • By Form
      • By Functionality
      • By Sales Channels
    • Market Attractiveness Analysis
      • By Country
      • By Type
      • By Nature
      • By Form
      • By Functionality
      • By Sales Channels
    • Key Takeaways
  18. Middle East and Africa Market Analysis 2020 to 2024 and Forecast 2025 to 2035, By Country
    • Historical Market Size Value (USD Billion) & Volume (Units) Trend Analysis By Market Taxonomy, 2020 to 2024
    • Market Size Value (USD Billion) & Volume (Units) Forecast By Market Taxonomy, 2025 to 2035
      • By Country
        • GCC Countries
        • Northern Africa
        • South Africa
        • Turkiye
        • Rest of MEA
      • By Type
      • By Nature
      • By Form
      • By Functionality
      • By Sales Channels
    • Market Attractiveness Analysis
      • By Country
      • By Type
      • By Nature
      • By Form
      • By Functionality
      • By Sales Channels
    • Key Takeaways
  19. Key Countries Market Analysis
    • USA
      • Pricing Analysis
      • Market Share Analysis, 2024
        • By Type
        • By Nature
        • By Form
        • By Functionality
        • By Sales Channels
    • Canada
      • Pricing Analysis
      • Market Share Analysis, 2024
        • By Type
        • By Nature
        • By Form
        • By Functionality
        • By Sales Channels
    • Brazil
      • Pricing Analysis
      • Market Share Analysis, 2024
        • By Type
        • By Nature
        • By Form
        • By Functionality
        • By Sales Channels
    • Mexico
      • Pricing Analysis
      • Market Share Analysis, 2024
        • By Type
        • By Nature
        • By Form
        • By Functionality
        • By Sales Channels
    • Argentina
      • Pricing Analysis
      • Market Share Analysis, 2024
        • By Type
        • By Nature
        • By Form
        • By Functionality
        • By Sales Channels
  20. Market Structure Analysis
    • Competition Dashboard
    • Competition Benchmarking
    • Market Share Analysis of Top Players
      • By Regional
      • By Type
      • By Nature
      • By Form
      • By Functionality
      • By Sales Channels
  21. Competition Analysis
    • Competition Deep Dive
      • OUAI HAIRCARE (P&G)
        • Overview
        • Product Portfolio
        • Profitability by Market Segments (Product/Age /Sales Channel/Region)
        • Sales Footprint
        • Strategy Overview
          • Marketing Strategy
          • Product Strategy
          • Channel Strategy
      • New Nordic Healthbands AB
        • Overview
        • Product Portfolio
        • Profitability by Market Segments (Product/Age /Sales Channel/Region)
        • Sales Footprint
        • Strategy Overview
          • Marketing Strategy
          • Product Strategy
          • Channel Strategy
      • Nutraceutical Wellness Inc. (Unilever)
        • Overview
        • Product Portfolio
        • Profitability by Market Segments (Product/Age /Sales Channel/Region)
        • Sales Footprint
        • Strategy Overview
          • Marketing Strategy
          • Product Strategy
          • Channel Strategy
      • Life Extension
        • Overview
        • Product Portfolio
        • Profitability by Market Segments (Product/Age /Sales Channel/Region)
        • Sales Footprint
        • Strategy Overview
          • Marketing Strategy
          • Product Strategy
          • Channel Strategy
      • Brock Beauty Inc.
        • Overview
        • Product Portfolio
        • Profitability by Market Segments (Product/Age /Sales Channel/Region)
        • Sales Footprint
        • Strategy Overview
          • Marketing Strategy
          • Product Strategy
          • Channel Strategy
      • The Bountiful Co.
        • Overview
        • Product Portfolio
        • Profitability by Market Segments (Product/Age /Sales Channel/Region)
        • Sales Footprint
        • Strategy Overview
          • Marketing Strategy
          • Product Strategy
          • Channel Strategy
      • Source Naturals, Inc.
        • Overview
        • Product Portfolio
        • Profitability by Market Segments (Product/Age /Sales Channel/Region)
        • Sales Footprint
        • Strategy Overview
          • Marketing Strategy
          • Product Strategy
          • Channel Strategy
      • Viva Naturals
        • Overview
        • Product Portfolio
        • Profitability by Market Segments (Product/Age /Sales Channel/Region)
        • Sales Footprint
        • Strategy Overview
          • Marketing Strategy
          • Product Strategy
          • Channel Strategy
      • NutraChamps
        • Overview
        • Product Portfolio
        • Profitability by Market Segments (Product/Age /Sales Channel/Region)
        • Sales Footprint
        • Strategy Overview
          • Marketing Strategy
          • Product Strategy
          • Channel Strategy
      • GNC Holdings, Inc. (Harbin Pharmaceutical Group)
        • Overview
        • Product Portfolio
        • Profitability by Market Segments (Product/Age /Sales Channel/Region)
        • Sales Footprint
        • Strategy Overview
          • Marketing Strategy
          • Product Strategy
          • Channel Strategy
  22. Assumptions & Acronyms Used
  23. Research Methodology

List of Tables

  • Table 1: Global Market Value (USD Billion) Forecast by Region, 2020-2035
  • Table 2: Global Market Volume (Units) Forecast by Region, 2020-2035
  • Table 3: Global Market Value (USD Billion) Forecast by Type, 2020-2035
  • Table 4: Global Market Volume (Units) Forecast by Type, 2020-2035
  • Table 5: Global Market Value (USD Billion) Forecast by Nature, 2020-2035
  • Table 6: Global Market Volume (Units) Forecast by Nature, 2020-2035
  • Table 7: Global Market Value (USD Billion) Forecast by Form, 2020-2035
  • Table 8: Global Market Volume (Units) Forecast by Form, 2020-2035
  • Table 9: Global Market Value (USD Billion) Forecast by Functionality, 2020-2035
  • Table 10: Global Market Volume (Units) Forecast by Functionality, 2020-2035
  • Table 11: Global Market Value (USD Billion) Forecast by Sales Channels, 2020-2035
  • Table 12: Global Market Volume (Units) Forecast by Sales Channels, 2020-2035
  • Table 13: USA Market Value (USD Billion) Forecast by Country, 2020-2035
  • Table 14: USA Market Volume (Units) Forecast by Country, 2020-2035
  • Table 15: USA Market Value (USD Billion) Forecast by Type, 2020-2035
  • Table 16: USA Market Volume (Units) Forecast by Type, 2020-2035
  • Table 17: USA Market Value (USD Billion) Forecast by Nature, 2020-2035
  • Table 18: USA Market Volume (Units) Forecast by Nature, 2020-2035
  • Table 19: USA Market Value (USD Billion) Forecast by Form, 2020-2035
  • Table 20: USA Market Volume (Units) Forecast by Form, 2020-2035
  • Table 21: USA Market Value (USD Billion) Forecast by Functionality, 2020-2035
  • Table 22: USA Market Volume (Units) Forecast by Functionality, 2020-2035
  • Table 23: USA Market Value (USD Billion) Forecast by Sales Channels, 2020-2035
  • Table 24: USA Market Volume (Units) Forecast by Sales Channels, 2020-2035
  • Table 25: Latin America Market Value (USD Billion) Forecast by Country, 2020-2035
  • Table 26: Latin America Market Volume (Units) Forecast by Country, 2020-2035
  • Table 27: Latin America Market Value (USD Billion) Forecast by Type, 2020-2035
  • Table 28: Latin America Market Volume (Units) Forecast by Type, 2020-2035
  • Table 29: Latin America Market Value (USD Billion) Forecast by Nature, 2020-2035
  • Table 30: Latin America Market Volume (Units) Forecast by Nature, 2020-2035
  • Table 31: Latin America Market Value (USD Billion) Forecast by Form, 2020-2035
  • Table 32: Latin America Market Volume (Units) Forecast by Form, 2020-2035
  • Table 33: Latin America Market Value (USD Billion) Forecast by Functionality, 2020-2035
  • Table 34: Latin America Market Volume (Units) Forecast by Functionality, 2020-2035
  • Table 35: Latin America Market Value (USD Billion) Forecast by Sales Channels, 2020-2035
  • Table 36: Latin America Market Volume (Units) Forecast by Sales Channels, 2020-2035
  • Table 37: Western Europe Market Value (USD Billion) Forecast by Country, 2020-2035
  • Table 38: Western Europe Market Volume (Units) Forecast by Country, 2020-2035
  • Table 39: Western Europe Market Value (USD Billion) Forecast by Type, 2020-2035
  • Table 40: Western Europe Market Volume (Units) Forecast by Type, 2020-2035
  • Table 41: Western Europe Market Value (USD Billion) Forecast by Nature, 2020-2035
  • Table 42: Western Europe Market Volume (Units) Forecast by Nature, 2020-2035
  • Table 43: Western Europe Market Value (USD Billion) Forecast by Form, 2020-2035
  • Table 44: Western Europe Market Volume (Units) Forecast by Form, 2020-2035
  • Table 45: Western Europe Market Value (USD Billion) Forecast by Functionality, 2020-2035
  • Table 46: Western Europe Market Volume (Units) Forecast by Functionality, 2020-2035
  • Table 47: Western Europe Market Value (USD Billion) Forecast by Sales Channels, 2020-2035
  • Table 48: Western Europe Market Volume (Units) Forecast by Sales Channels, 2020-2035
  • Table 49: Eastern Europe Market Value (USD Billion) Forecast by Country, 2020-2035
  • Table 50: Eastern Europe Market Volume (Units) Forecast by Country, 2020-2035
  • Table 51: Eastern Europe Market Value (USD Billion) Forecast by Type, 2020-2035
  • Table 52: Eastern Europe Market Volume (Units) Forecast by Type, 2020-2035
  • Table 53: Eastern Europe Market Value (USD Billion) Forecast by Nature, 2020-2035
  • Table 54: Eastern Europe Market Volume (Units) Forecast by Nature, 2020-2035
  • Table 55: Eastern Europe Market Value (USD Billion) Forecast by Form, 2020-2035
  • Table 56: Eastern Europe Market Volume (Units) Forecast by Form, 2020-2035
  • Table 57: Eastern Europe Market Value (USD Billion) Forecast by Functionality, 2020-2035
  • Table 58: Eastern Europe Market Volume (Units) Forecast by Functionality, 2020-2035
  • Table 59: Eastern Europe Market Value (USD Billion) Forecast by Sales Channels, 2020-2035
  • Table 60: Eastern Europe Market Volume (Units) Forecast by Sales Channels, 2020-2035
  • Table 61: East Asia Market Value (USD Billion) Forecast by Country, 2020-2035
  • Table 62: East Asia Market Volume (Units) Forecast by Country, 2020-2035
  • Table 63: East Asia Market Value (USD Billion) Forecast by Type, 2020-2035
  • Table 64: East Asia Market Volume (Units) Forecast by Type, 2020-2035
  • Table 65: East Asia Market Value (USD Billion) Forecast by Nature, 2020-2035
  • Table 66: East Asia Market Volume (Units) Forecast by Nature, 2020-2035
  • Table 67: East Asia Market Value (USD Billion) Forecast by Form, 2020-2035
  • Table 68: East Asia Market Volume (Units) Forecast by Form, 2020-2035
  • Table 69: East Asia Market Value (USD Billion) Forecast by Functionality, 2020-2035
  • Table 70: East Asia Market Volume (Units) Forecast by Functionality, 2020-2035
  • Table 71: East Asia Market Value (USD Billion) Forecast by Sales Channels, 2020-2035
  • Table 72: East Asia Market Volume (Units) Forecast by Sales Channels, 2020-2035
  • Table 73: South Asia & Pacific Market Value (USD Billion) Forecast by Country, 2020-2035
  • Table 74: South Asia & Pacific Market Volume (Units) Forecast by Country, 2020-2035
  • Table 75: South Asia & Pacific Market Value (USD Billion) Forecast by Type, 2020-2035
  • Table 76: South Asia & Pacific Market Volume (Units) Forecast by Type, 2020-2035
  • Table 77: South Asia & Pacific Market Value (USD Billion) Forecast by Nature, 2020-2035
  • Table 78: South Asia & Pacific Market Volume (Units) Forecast by Nature, 2020-2035
  • Table 79: South Asia & Pacific Market Value (USD Billion) Forecast by Form, 2020-2035
  • Table 80: South Asia & Pacific Market Volume (Units) Forecast by Form, 2020-2035
  • Table 81: South Asia & Pacific Market Value (USD Billion) Forecast by Functionality, 2020-2035
  • Table 82: South Asia & Pacific Market Volume (Units) Forecast by Functionality, 2020-2035
  • Table 83: South Asia & Pacific Market Value (USD Billion) Forecast by Sales Channels, 2020-2035
  • Table 84: South Asia & Pacific Market Volume (Units) Forecast by Sales Channels, 2020-2035
  • Table 85: Middle East and Africa Market Value (USD Billion) Forecast by Country, 2020-2035
  • Table 86: Middle East and Africa Market Volume (Units) Forecast by Country, 2020-2035
  • Table 87: Middle East and Africa Market Value (USD Billion) Forecast by Type, 2020-2035
  • Table 88: Middle East and Africa Market Volume (Units) Forecast by Type, 2020-2035
  • Table 89: Middle East and Africa Market Value (USD Billion) Forecast by Nature, 2020-2035
  • Table 90: Middle East and Africa Market Volume (Units) Forecast by Nature, 2020-2035
  • Table 91: Middle East and Africa Market Value (USD Billion) Forecast by Form, 2020-2035
  • Table 92: Middle East and Africa Market Volume (Units) Forecast by Form, 2020-2035
  • Table 93: Middle East and Africa Market Value (USD Billion) Forecast by Functionality, 2020-2035
  • Table 94: Middle East and Africa Market Volume (Units) Forecast by Functionality, 2020-2035
  • Table 95: Middle East and Africa Market Value (USD Billion) Forecast by Sales Channels, 2020-2035
  • Table 96: Middle East and Africa Market Volume (Units) Forecast by Sales Channels, 2020-2035

List of Figures

  • Figure 1: Global Market Volume (Units) Forecast 2020-2035
  • Figure 2: Global Market Pricing Analysis
  • Figure 3: Global Market Value (USD Billion) Forecast 2020-2035
  • Figure 4: Global Market Value Share and BPS Analysis by Type, 2025 and 2035
  • Figure 5: Global Market Y-o-Y Growth Comparison by Type, 2025-2035
  • Figure 6: Global Market Attractiveness Analysis by Type
  • Figure 7: Global Market Value Share and BPS Analysis by Nature, 2025 and 2035
  • Figure 8: Global Market Y-o-Y Growth Comparison by Nature, 2025-2035
  • Figure 9: Global Market Attractiveness Analysis by Nature
  • Figure 10: Global Market Value Share and BPS Analysis by Form, 2025 and 2035
  • Figure 11: Global Market Y-o-Y Growth Comparison by Form, 2025-2035
  • Figure 12: Global Market Attractiveness Analysis by Form
  • Figure 13: Global Market Value Share and BPS Analysis by Functionality, 2025 and 2035
  • Figure 14: Global Market Y-o-Y Growth Comparison by Functionality, 2025-2035
  • Figure 15: Global Market Attractiveness Analysis by Functionality
  • Figure 16: Global Market Value Share and BPS Analysis by Sales Channels, 2025 and 2035
  • Figure 17: Global Market Y-o-Y Growth Comparison by Sales Channels, 2025-2035
  • Figure 18: Global Market Attractiveness Analysis by Sales Channels
  • Figure 19: Global Market Value (USD Billion) Share and BPS Analysis by Region, 2025 and 2035
  • Figure 20: Global Market Y-o-Y Growth Comparison by Region, 2025-2035
  • Figure 21: Global Market Attractiveness Analysis by Region
  • Figure 22: USA Market Incremental $ Opportunity, 2025-2035
  • Figure 23: Latin America Market Incremental $ Opportunity, 2025-2035
  • Figure 24: Western Europe Market Incremental $ Opportunity, 2025-2035
  • Figure 25: Eastern Europe Market Incremental $ Opportunity, 2025-2035
  • Figure 26: East Asia Market Incremental $ Opportunity, 2025-2035
  • Figure 27: South Asia & Pacific Market Incremental $ Opportunity, 2025-2035
  • Figure 28: Middle East and Africa Market Incremental $ Opportunity, 2025-2035
  • Figure 29: USA Market Value Share and BPS Analysis by Country, 2025 and 2035
  • Figure 30: USA Market Value Share and BPS Analysis by Type, 2025 and 2035
  • Figure 31: USA Market Y-o-Y Growth Comparison by Type, 2025-2035
  • Figure 32: USA Market Attractiveness Analysis by Type
  • Figure 33: USA Market Value Share and BPS Analysis by Nature, 2025 and 2035
  • Figure 34: USA Market Y-o-Y Growth Comparison by Nature, 2025-2035
  • Figure 35: USA Market Attractiveness Analysis by Nature
  • Figure 36: USA Market Value Share and BPS Analysis by Form, 2025 and 2035
  • Figure 37: USA Market Y-o-Y Growth Comparison by Form, 2025-2035
  • Figure 38: USA Market Attractiveness Analysis by Form
  • Figure 39: USA Market Value Share and BPS Analysis by Functionality, 2025 and 2035
  • Figure 40: USA Market Y-o-Y Growth Comparison by Functionality, 2025-2035
  • Figure 41: USA Market Attractiveness Analysis by Functionality
  • Figure 42: USA Market Value Share and BPS Analysis by Sales Channels, 2025 and 2035
  • Figure 43: USA Market Y-o-Y Growth Comparison by Sales Channels, 2025-2035
  • Figure 44: USA Market Attractiveness Analysis by Sales Channels
  • Figure 45: Latin America Market Value Share and BPS Analysis by Country, 2025 and 2035
  • Figure 46: Latin America Market Value Share and BPS Analysis by Type, 2025 and 2035
  • Figure 47: Latin America Market Y-o-Y Growth Comparison by Type, 2025-2035
  • Figure 48: Latin America Market Attractiveness Analysis by Type
  • Figure 49: Latin America Market Value Share and BPS Analysis by Nature, 2025 and 2035
  • Figure 50: Latin America Market Y-o-Y Growth Comparison by Nature, 2025-2035
  • Figure 51: Latin America Market Attractiveness Analysis by Nature
  • Figure 52: Latin America Market Value Share and BPS Analysis by Form, 2025 and 2035
  • Figure 53: Latin America Market Y-o-Y Growth Comparison by Form, 2025-2035
  • Figure 54: Latin America Market Attractiveness Analysis by Form
  • Figure 55: Latin America Market Value Share and BPS Analysis by Functionality, 2025 and 2035
  • Figure 56: Latin America Market Y-o-Y Growth Comparison by Functionality, 2025-2035
  • Figure 57: Latin America Market Attractiveness Analysis by Functionality
  • Figure 58: Latin America Market Value Share and BPS Analysis by Sales Channels, 2025 and 2035
  • Figure 59: Latin America Market Y-o-Y Growth Comparison by Sales Channels, 2025-2035
  • Figure 60: Latin America Market Attractiveness Analysis by Sales Channels
  • Figure 61: Western Europe Market Value Share and BPS Analysis by Country, 2025 and 2035
  • Figure 62: Western Europe Market Value Share and BPS Analysis by Type, 2025 and 2035
  • Figure 63: Western Europe Market Y-o-Y Growth Comparison by Type, 2025-2035
  • Figure 64: Western Europe Market Attractiveness Analysis by Type
  • Figure 65: Western Europe Market Value Share and BPS Analysis by Nature, 2025 and 2035
  • Figure 66: Western Europe Market Y-o-Y Growth Comparison by Nature, 2025-2035
  • Figure 67: Western Europe Market Attractiveness Analysis by Nature
  • Figure 68: Western Europe Market Value Share and BPS Analysis by Form, 2025 and 2035
  • Figure 69: Western Europe Market Y-o-Y Growth Comparison by Form, 2025-2035
  • Figure 70: Western Europe Market Attractiveness Analysis by Form
  • Figure 71: Western Europe Market Value Share and BPS Analysis by Functionality, 2025 and 2035
  • Figure 72: Western Europe Market Y-o-Y Growth Comparison by Functionality, 2025-2035
  • Figure 73: Western Europe Market Attractiveness Analysis by Functionality
  • Figure 74: Western Europe Market Value Share and BPS Analysis by Sales Channels, 2025 and 2035
  • Figure 75: Western Europe Market Y-o-Y Growth Comparison by Sales Channels, 2025-2035
  • Figure 76: Western Europe Market Attractiveness Analysis by Sales Channels
  • Figure 77: Eastern Europe Market Value Share and BPS Analysis by Country, 2025 and 2035
  • Figure 78: Eastern Europe Market Value Share and BPS Analysis by Type, 2025 and 2035
  • Figure 79: Eastern Europe Market Y-o-Y Growth Comparison by Type, 2025-2035
  • Figure 80: Eastern Europe Market Attractiveness Analysis by Type
  • Figure 81: Eastern Europe Market Value Share and BPS Analysis by Nature, 2025 and 2035
  • Figure 82: Eastern Europe Market Y-o-Y Growth Comparison by Nature, 2025-2035
  • Figure 83: Eastern Europe Market Attractiveness Analysis by Nature
  • Figure 84: Eastern Europe Market Value Share and BPS Analysis by Form, 2025 and 2035
  • Figure 85: Eastern Europe Market Y-o-Y Growth Comparison by Form, 2025-2035
  • Figure 86: Eastern Europe Market Attractiveness Analysis by Form
  • Figure 87: Eastern Europe Market Value Share and BPS Analysis by Functionality, 2025 and 2035
  • Figure 88: Eastern Europe Market Y-o-Y Growth Comparison by Functionality, 2025-2035
  • Figure 89: Eastern Europe Market Attractiveness Analysis by Functionality
  • Figure 90: Eastern Europe Market Value Share and BPS Analysis by Sales Channels, 2025 and 2035
  • Figure 91: Eastern Europe Market Y-o-Y Growth Comparison by Sales Channels, 2025-2035
  • Figure 92: Eastern Europe Market Attractiveness Analysis by Sales Channels
  • Figure 93: East Asia Market Value Share and BPS Analysis by Country, 2025 and 2035
  • Figure 94: East Asia Market Value Share and BPS Analysis by Type, 2025 and 2035
  • Figure 95: East Asia Market Y-o-Y Growth Comparison by Type, 2025-2035
  • Figure 96: East Asia Market Attractiveness Analysis by Type
  • Figure 97: East Asia Market Value Share and BPS Analysis by Nature, 2025 and 2035
  • Figure 98: East Asia Market Y-o-Y Growth Comparison by Nature, 2025-2035
  • Figure 99: East Asia Market Attractiveness Analysis by Nature
  • Figure 100: East Asia Market Value Share and BPS Analysis by Form, 2025 and 2035
  • Figure 101: East Asia Market Y-o-Y Growth Comparison by Form, 2025-2035
  • Figure 102: East Asia Market Attractiveness Analysis by Form
  • Figure 103: East Asia Market Value Share and BPS Analysis by Functionality, 2025 and 2035
  • Figure 104: East Asia Market Y-o-Y Growth Comparison by Functionality, 2025-2035
  • Figure 105: East Asia Market Attractiveness Analysis by Functionality
  • Figure 106: East Asia Market Value Share and BPS Analysis by Sales Channels, 2025 and 2035
  • Figure 107: East Asia Market Y-o-Y Growth Comparison by Sales Channels, 2025-2035
  • Figure 108: East Asia Market Attractiveness Analysis by Sales Channels
  • Figure 109: South Asia & Pacific Market Value Share and BPS Analysis by Country, 2025 and 2035
  • Figure 110: South Asia & Pacific Market Value Share and BPS Analysis by Type, 2025 and 2035
  • Figure 111: South Asia & Pacific Market Y-o-Y Growth Comparison by Type, 2025-2035
  • Figure 112: South Asia & Pacific Market Attractiveness Analysis by Type
  • Figure 113: South Asia & Pacific Market Value Share and BPS Analysis by Nature, 2025 and 2035
  • Figure 114: South Asia & Pacific Market Y-o-Y Growth Comparison by Nature, 2025-2035
  • Figure 115: South Asia & Pacific Market Attractiveness Analysis by Nature
  • Figure 116: South Asia & Pacific Market Value Share and BPS Analysis by Form, 2025 and 2035
  • Figure 117: South Asia & Pacific Market Y-o-Y Growth Comparison by Form, 2025-2035
  • Figure 118: South Asia & Pacific Market Attractiveness Analysis by Form
  • Figure 119: South Asia & Pacific Market Value Share and BPS Analysis by Functionality, 2025 and 2035
  • Figure 120: South Asia & Pacific Market Y-o-Y Growth Comparison by Functionality, 2025-2035
  • Figure 121: South Asia & Pacific Market Attractiveness Analysis by Functionality
  • Figure 122: South Asia & Pacific Market Value Share and BPS Analysis by Sales Channels, 2025 and 2035
  • Figure 123: South Asia & Pacific Market Y-o-Y Growth Comparison by Sales Channels, 2025-2035
  • Figure 124: South Asia & Pacific Market Attractiveness Analysis by Sales Channels
  • Figure 125: Middle East and Africa Market Value Share and BPS Analysis by Country, 2025 and 2035
  • Figure 126: Middle East and Africa Market Value Share and BPS Analysis by Type, 2025 and 2035
  • Figure 127: Middle East and Africa Market Y-o-Y Growth Comparison by Type, 2025-2035
  • Figure 128: Middle East and Africa Market Attractiveness Analysis by Type
  • Figure 129: Middle East and Africa Market Value Share and BPS Analysis by Nature, 2025 and 2035
  • Figure 130: Middle East and Africa Market Y-o-Y Growth Comparison by Nature, 2025-2035
  • Figure 131: Middle East and Africa Market Attractiveness Analysis by Nature
  • Figure 132: Middle East and Africa Market Value Share and BPS Analysis by Form, 2025 and 2035
  • Figure 133: Middle East and Africa Market Y-o-Y Growth Comparison by Form, 2025-2035
  • Figure 134: Middle East and Africa Market Attractiveness Analysis by Form
  • Figure 135: Middle East and Africa Market Value Share and BPS Analysis by Functionality, 2025 and 2035
  • Figure 136: Middle East and Africa Market Y-o-Y Growth Comparison by Functionality, 2025-2035
  • Figure 137: Middle East and Africa Market Attractiveness Analysis by Functionality
  • Figure 138: Middle East and Africa Market Value Share and BPS Analysis by Sales Channels, 2025 and 2035
  • Figure 139: Middle East and Africa Market Y-o-Y Growth Comparison by Sales Channels, 2025-2035
  • Figure 140: Middle East and Africa Market Attractiveness Analysis by Sales Channels
  • Figure 141: Global Market - Tier Structure Analysis
  • Figure 142: Global Market - Company Share Analysis

Frequently Asked Questions

What is the current size of the haircare supplement market?

The market is valued at USD 1.3 billion in 2025.

What is the forecasted size of the haircare supplement market by 2035?

The market is projected to reach USD 2.1 billion by 2035.

What is the expected CAGR of the haircare supplement market from 2025 to 2035?

The market is projected to grow at a CAGR of 4.6% during 2025 to 2035.

Which form leads the haircare supplement market?

Gummies/chewables lead with a 36% market share in 2025.

Which sales channel holds the largest share in the haircare supplement market?

Offline sales channels hold the largest share with 68% in 2025.

Explore Similar Insights

Future Market Insights

Haircare Supplement Market