Sleep Supplement Market Size and Share Forecast Outlook (2024 to 2034)

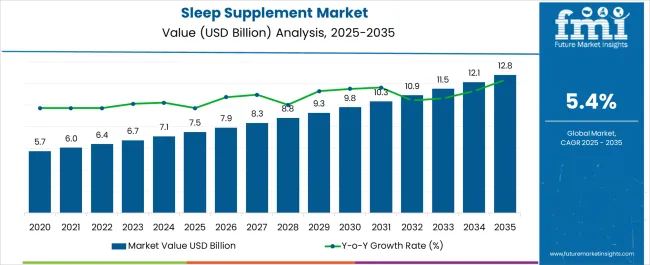
The global sleep supplement market is estimated to be valued at USD 7.6 billion in 2024. The market is expected to expand at a CAGR of 5.2% and reach a valuation of USD 12.9 billion by 2034. The demand for melatonin sleep supplements is rising in the global market.

Data Points Market Insights
Sleep Supplement Market Value 2023 USD 7.1 billion
Estimated Market Value 2024 USD 7.6 billion
Projected Market Value 2034 USD 12.9 billion
Value-based CAGR (2024 to 2034) 5.5%
Market Share of Top 5 Countries 50.1%

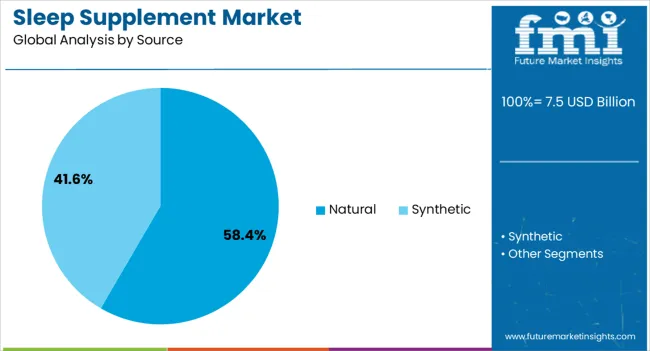
Consumers are increasingly showing a strong preference for natural and clean products across various categories, including skincare, cosmetics, multivitamins, subscription food services, and sleep aids. This shift in consumer behavior is driven by a desire for healthier alternatives and a heightened awareness of the potential benefits of natural products.

One area that has seen significant growth in consumer interest is better sleep. The ongoing pandemic has caused increased stress and disrupted sleep patterns for many individuals, leading them to seek solutions for improving their sleep quality. In this context, natural sleep aids such as melatonin and app-enabled sleep trackers have gained popularity and are now competing with traditional sleep medications.

Historical Analysis of the Sleep Supplement Market Compared to Demand Outlook

The market for sleep supplements expanded at a CAGR of 5.6% during the forecast period. The demand for sleep supplements increased due to the growing concern for health care.

Historical Market Valuation, 2023 USD 7.1 billion
HCAGR, 2019 to 2023 5.6%

Epidemiologists acknowledge that obtaining enough sleep is important, but many people find it difficult to fall into deep sleep. Numerous physical and psychological factors, such as stress, sadness, and poor lifestyle choices cause insomnia. The underlying medical illnesses and obesity result in sleep apnea or other sleep disorders, contributing to the market’s growth. Sleep deprivation has been linked to an increased risk of obesity, diabetes, high blood pressure, heart disease, stroke, and depression. However, sleeping aid manufacturers focus on all-natural remedies to explore lucrative opportunities in the sleep supplement market.

The growing need for convenience and compliance is a result of consumers’ growing knowledge of the importance of getting a great sleep. The expanding elderly population and the ease of access to a wide array of products are important drivers of market growth.

Key Opportunities Driving Growth in the Sleep Supplement Market

The market is set to have an attractive growth outlook over the forecast period. Natural sleep aids like melatonin offer fewer negative side effects than many pharmaceutical medicines commonly given for insomnia such as barbiturates, which can lead to regular usage or addiction.

Natural sleep aids are administered to those with mild or recurrent insomnia because they have no negative side effects. However, it is imperative to continue researching the workings, effectiveness, and side effects of several natural sleep aids.

These above-mentioned factors are expected to boost the market for sleep supplements in the future due to the increased demand for natural sleep aids and supplements to treat sleep disorders.

Factors Limiting Demand for Sleep Supplements

A lack of knowledge of sleep supplement consumption is expected to have side effects impairing sleep quality. Consuming alcohol along with sleep supplements is making sleeping medications more sedating. The combination has the potential to be quite devastating.

Additionally, the consumption of melatonin for good sleep can cause adverse effects. According to a study, consuming an excess of melatonin might cause an upset stomach making it even harder to fall asleep. Extremely high melatonin levels, however, can be overridden by the body, which will interpret them as an error.

Cumulatively, these factors propose a negative effect on the developmental growth of the sleep supplement market.

Analysis of Top Countries Producing, Marketing, and Using Sleep Supplements

Countries CAGR (2024 to 2034)
United States 5%
India 3.8%
China 5.1%
Germany 5.8%
United Kingdom 4.5%

Sleep Supplement Market in the United States

The United States holds a share of 86.3% of the North American Market. The increase in sleep disorder cases among people in the United States is expected to drive the market over the coming years.

Although sleeping should be restful, 35% of Americans find it difficult to get seven or more hours of sleep every night. The lack of sleep has surged the demand for sleep supplements.

Sleep Supplement Market in India

India dominates the South Asia region with a total market share of about 44.6% and is expected to grow at a CAGR of 3.8% through 2034.

A lack of sleep can have several negative health effects, including weight gain, diabetes, heart disease, stroke, and memory loss. Workplace productivity may also be impacted. The wellness market in India has grown as lifestyles become busier and more stressful. Additionally, there is an increasing concern to improve an individual’s quality of sleep.

Sleep Supplement Market in China

China holds a share of 27.7% of the East Asia market. The country is projected to grow at a CAGR of 5.1% through 2034.

Researchers estimate that around 300 million Chinese people have sleep issues. Young people are especially susceptible to these problems. Nearly half of the people between the ages of 19 and 25 don't go to bed until after midnight.

Sleep Supplement Market in Germany

Germany holds a share of 23.5% of the European market with a market valuation of USD 455.3 billion. The market is expected to record a CAGR of 5.8% over the forecast period.

Sleep Supplement Industry Analysis by Top Investment Segments

Rising Demand for Sleep Supplements Containing Melatonin

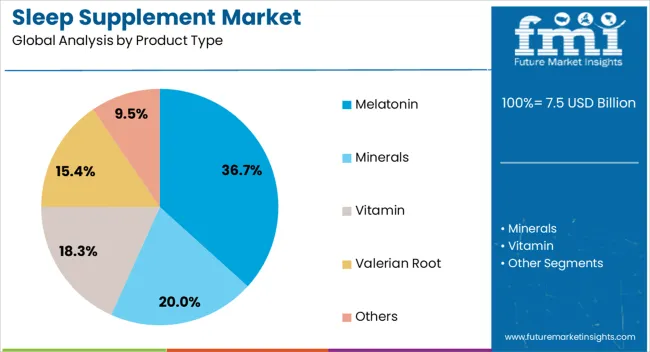
Top Product Type Melatonin
Market Share in 2024 35.8%

The melatonin segment is expected to hold a market share of about 35.8% in 2024.

Melatonin is a hormone that occurs naturally and is essential for the human body's sleep-wake cycle. Essentially, the "N1 Phase" or "light sleep" controls your body's rhythm based on the light surrounding, signaling to the body that darkness is a trigger for night-time behavior.

Therefore, melatonin pills are stated to be an excellent choice for people who have trouble falling asleep or trouble staying asleep.

Higher Consumption of Sleep Supplements in Tablet Form

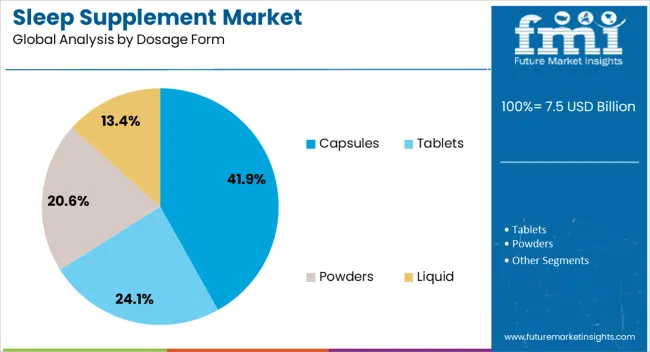
Top Dosage Form Tablets
Market Share in 2024 41.8%

The tablets segment accounted for a market share of 41.8% in 2024. As tablet offers a very efficient delivery method, they are highly preferred form of medication for the majority of pharmaceuticals and nutraceuticals. Several meticulously conducted clinical trials over many years have established the dependability and effectiveness of tablets as the dosage form.

Retail Pharmacies Facilitate Higher Sales of Sleep Supplements

Top Distribution Channel Retail Pharmacies
Market Share in 2024 46.5%

Retail pharmacies are leading the market by distribution channel, holding a share of 46.5% in 2024. Since these sleep supplements are also available on an OTC basis for health benefits, this segment generates significant revenue among the other distribution channels. The segment is set to grow at a CAGR of 5.4% over the forecast period.
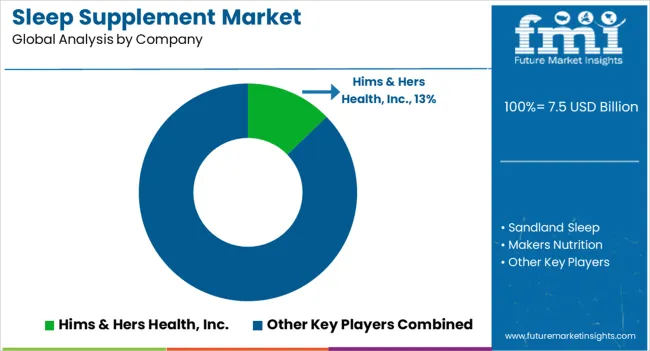
Competitive Landscape of the Sleep Supplement Market

In the highly fragmented sleep supplement market, companies are adopting various strategic methods to meet consumer demand, gain a competitive edge, and expand their customer base.

Key developmental strategies employed by industry players include spending on research and development activities to produce supplements from natural sources with reduced or negligible side effects.

Recent Developments in the Sleep Supplement Market

  • In February 2022, three new supplements were introduced by Hims & Hers Health, Inc., the multi-specialty telehealth platform devoted to offering consumers modern, personalized health and wellness experiences.
  • In April 2021, Sandland Sleep introduced a range of holistic sleep supplements and aids that are scientifically shown to assist users in improving their sleep organically.

Key Market Players in the Sleep Supplement Industry

  • Hims & Hers Health, Inc.
  • Sandland Sleep
  • Makers Nutrition
  • OLLY
  • GalventaAmorpacific
  • Wilson Lau
  • Som Sleep
  • Fuel 4 Ever
  • Nature Made
  • Kao
  • Spectrum Lifesciences Pvt. Ltd.
  • Wholesome MedTech Pvt. Ltd.
  • NUTRASCIENCE LABS
  • SMPNutra

Scope and Coverage of the Sleep Supplements Industry Report

Attribute Details
Forecast Period 2024 to 2034
Historical Data Available for 2019 to 2023
Market Analysis USD billion for Value
Key Regions Covered North America; Latin America; Europe; South Asia; East Asia; Oceania; and Middle East & Africa
Key Countries Covered USA, Canada, Brazil, Mexico, Argentina, UK, Germany, Italy, Russia, Spain, France, BENELUX, India, Thailand, Indonesia, Malaysia, Japan, China, South Korea, Australia, New Zealand, Turkey, GCC, and South Africa
Key Market Segments Covered Product Type, Source, Dosage form, Indication, Distribution Channel, and Region
Key Companies Profiled Hims & Hers Health, Inc.; Sandland Sleep; Makers Nutrition; OLLY; Galventa; Amorpacific; Wilson Lau; Som Sleep; Fuel 4 Ever; Nature Made; Kao; Spectrum Lifesciences Pvt Ltd.; Wholesome MedTech Pvt Ltd.; NUTRASCIENCE LABS; SMPNutra
Pricing Available upon Request

Top Segments Studied in the Sleep Supplement Market

By Product Type:

  • Minerals
  • Vitamin
  • Melatonin
  • Valerian root
  • Others

By Source:

  • Synthetic
  • Natural

By Dosage Form:

  • Tablets
  • Capsules
  • Powders
  • Liquid

By Indication:

  • Insomnia
  • Sleep Apnea
  • Narcolepsy
  • Other sleep disorders

By Distribution Channel:

  • Retail Pharmacies
  • Hospital Pharmacies
  • Online Pharmacies
  • Specialty Stores

By Region:

  • North America
  • Latin America
  • Europe
  • South Asia
  • East Asia
  • Oceania
  • Middle East and Africa (MEA)

Table of Content

  • 1. Executive Summary
  • 2. Market Overview
  • 3. Market Trends & Dynamics
  • 4. Value-Added Insights
  • 5. Market Background
  • 6. Global Market Demand (in Value or Size in USD Million) Analysis 2019 to 2023 and Forecast, 2024 to 2034
  • 7. Global Market Analysis 2019 to 2023 and Forecast 2024 to 2034, By Product
    • 7.1. Minerals
    • 7.2. Vitamin
    • 7.3. Melatonin
    • 7.4. Valerian root
    • 7.5. Others
  • 8. Global Market Analysis 2019 to 2023 and Forecast 2024 to 2034, By Source
    • 8.1. Synthetic
    • 8.2. Natural
  • 9. Global Market Analysis 2019 to 2023 and Forecast 2024 to 2034, By Dosage Form
    • 9.1. Tablets
    • 9.2. Capsules
    • 9.3. Powders
    • 9.4. Liquid
  • 10. Global Market Analysis 2019 to 2023 and Forecast 2024 to 2034, By Indication
    • 10.1. Insomnia
    • 10.2. Sleep Apnea
    • 10.3. Narcolepsy
    • 10.4. Other Sleep Disorders
  • 11. Global Market Analysis 2019 to 2023 and Forecast 2024 to 2034, By Distribution Channel
    • 11.1. Retail Pharmacies
    • 11.2. Hospital Pharmacies
    • 11.3. Online Pharmacies
    • 11.4. Specialty Stores
  • 12. Global Market Analysis 2019 to 2023 and Forecast 2024 to 2034, By Region
    • 12.1. North America
    • 12.2. Latin America
    • 12.3. Europe
    • 12.4. East Asia
    • 12.5. South Asia
    • 12.6. Oceania
    • 12.7. Middle East and Africa (MEA)
  • 13. North America Market Analysis 2019 to 2023 and Forecast 2024 to 2034
  • 14. Latin America Market Analysis 2019 to 2023 and Forecast 2024 to 2034
  • 15. Europe Market Analysis 2019 to 2023 and Forecast 2024 to 2034
  • 16. East Asia Market Analysis 2019 to 2023 and Forecast 2024 to 2034
  • 17. South Asia Market Analysis 2019 to 2023 and Forecast 2024 to 2034
  • 18. Oceania Market Analysis 2019 to 2023 and Forecast 2024 to 2034
  • 19. Middle East and Africa (MEA) Market Analysis 2019 to 2023 and Forecast 2024 to 2034
  • 20. Market Structure Analysis
  • 21. Competition Analysis
    • 21.1. Hims & Hers Health, Inc.
    • 21.2. Sandland Sleep
    • 21.3. Makers Nutrition
    • 21.4. OLLY
    • 21.5. Galventa
    • 21.6. Amorepacific
    • 21.7. Wilson Lau
    • 21.8. Som Sleep
    • 21.9. Fuel 4 Ever
    • 21.10. Nature Made
    • 21.11. Kao
    • 21.12. Spectrum Lifesciences Pvt Ltd.
    • 21.13. Wholesome MedTech Pvt Ltd.
    • 21.14. NUTRASCIENCE LABS
    • 21.15. SMPNutra
  • 22. Assumptions and Acronyms Used
  • 23. Research Methodology

List of Tables

Table 01: Global Market Analysis 2019 to 2023 and Forecast 2024 to 2034, by Product

Table 02: Global Market Analysis 2019 to 2023 and Forecast 2024 to 2034, by Source

Table 03: Global Market Analysis 2019 to 2023 and Forecast 2024 to 2034, by Dosage Form

Table 04: Global Market Analysis 2019 to 2023 and Forecast 2024 to 2034, by Indication

Table 05: Global Market Analysis 2019 to 2023 and Forecast 2024 to 2034, by Distribution Channel

Table 06: Global Market Analysis 2019 to 2023 and Forecast 2024 to 2034, by Region

Table 07: North America Market Value (US$ Million) Analysis 2019 to 2023 and Forecast 2024 to 2034, by Country

Table 08: North America Market Value (US$ Million) Analysis 2019 to 2023 and Forecast 2024 to 2034, by Product

Table 09: North America Market Value (US$ Million) Analysis 2019 to 2023 and Forecast 2024 to 2034, by Source

Table 10: North America Market Value (US$ Million) Analysis 2019 to 2023 and Forecast 2024 to 2034, by Dosage Form

Table 11: North America Market Value (US$ Million) Analysis 2019 to 2023 and Forecast 2024 to 2034, by Indication

Table 12: North America Market Value (US$ Million) Analysis 2019 to 2023 and Forecast 2024 to 2034, by Distribution Channel

Table 13: Latin America Market Value (US$ Million) Analysis 2019 to 2023 and Forecast 2024 to 2034, by Country

Table 14: Latin America Market Value (US$ Million) Analysis 2019 to 2023 and Forecast 2024 to 2034, by Product

Table 15: Latin America Market Value (US$ Million) Analysis 2019 to 2023 and Forecast 2024 to 2034, by Source

Table 16: Latin America Market Value (US$ Million) Analysis 2019 to 2023 and Forecast 2024 to 2034, by Dosage Form

Table 17: Latin America Market Value (US$ Million) Analysis 2019 to 2023 and Forecast 2024 to 2034, by Indication

Table 18: Latin America Market Value (US$ Million) Analysis 2019 to 2023 and Forecast 2024 to 2034, by Distribution Channel

Table 19: Europe Market Value (US$ Million) Analysis 2019 to 2023 and Forecast 2024 to 2034, by Country

Table 20: Europe Market Value (US$ Million) Analysis 2019 to 2023 and Forecast 2024 to 2034, by Product

Table 21: Europe Market Analysis 2019 to 2023 and Forecast 2024 to 2034, by Source

Table 22: Europe Market Analysis 2019 to 2023 and Forecast 2024 to 2034, by Dosage Form

Table 23: Europe Market Analysis 2019 to 2023 and Forecast 2024 to 2034, by Indication

Table 24: Europe Market Analysis 2019 to 2023 and Forecast 2024 to 2034, by Distribution Channel

Table 25: East Asia Market Value (US$ Million) Analysis 2019 to 2023 and Forecast 2024 to 2034, by Country

Table 26: East Asia Market Value (US$ Million) Analysis 2019 to 2023 and Forecast 2024 to 2034, by Product

Table 27: East Asia Market Value (US$ Million) Analysis 2019 to 2023 and Forecast 2024 to 2034, by Source

Table 28: East Asia Market Value (US$ Million) Analysis 2019 to 2023 and Forecast 2024 to 2034, by Dosage Form

Table 29: East Asia Market Value (US$ Million) Analysis 2019 to 2023 and Forecast 2024 to 2034, by Indication

Table 30: East Asia Market Value (US$ Million) Analysis 2019 to 2023 and Forecast 2024 to 2034, by Distribution Channel

Table 31: South Asia Market Value (US$ Million) Analysis 2019 to 2023 and Forecast 2024 to 2034, by Country

Table 32: South Asia Market Value (US$ Million) Analysis 2019 to 2023 and Forecast 2024 to 2034, by Product

Table 33: South Asia Market Value (US$ Million) Analysis 2019 to 2023 and Forecast 2024 to 2034, by Source

Table 34: South Asia Market Value (US$ Million) Analysis 2019 to 2023 and Forecast 2024 to 2034, by Dosage Form

Table 35: South Asia Market Value (US$ Million) Analysis 2019 to 2023 and Forecast 2024 to 2034, by Indication

Table 36: South Asia Market Value (US$ Million) Analysis 2019 to 2023 and Forecast 2024 to 2034, by Distribution Channel

Table 37: Oceania Market Value (US$ Million) Analysis 2019 to 2023 and Forecast 2024 to 2034, by Country

Table 38: Oceania Market Value (US$ Million) Analysis 2019 to 2023 and Forecast 2024 to 2034, by Product

Table 39: Oceania Market Analysis 2019 to 2023 and Forecast 2024 to 2034, by Source

Table 40: Oceania Market Analysis 2019 to 2023 and Forecast 2024 to 2034, by Dosage Form

Table 41: Oceania Market Analysis 2019 to 2023 and Forecast 2024 to 2034, by Indication

Table 42: Oceania Market Analysis 2019 to 2023 and Forecast 2024 to 2034, by Distribution Channel

Table 43: Middle East & Africa Market Value (US$ Million) Analysis 2019 to 2023 and Forecast 2024 to 2034, by Country

Table 44: Middle East & Africa Market Value (US$ Million) Analysis 2019 to 2023 and Forecast 2024 to 2034, by Product

Table 45: Middle East & Africa Market Analysis 2019 to 2023 and Forecast 2024 to 2034, by Source

Table 46: Middle East & Africa Market Analysis 2019 to 2023 and Forecast 2024 to 2034, by Dosage Form

Table 47: Middle East & Africa Market Analysis 2019 to 2023 and Forecast 2024 to 2034, by Indication

Table 48: Middle East & Africa Market Analysis 2019 to 2023 and Forecast 2024 to 2034, by Distribution Channel

List of Figures

Figure 01: Global Market Value (US$ Million) Analysis, 2019 to 2023

Figure 02: Global Market Forecast & Y-o-Y Growth, 2024 to 2034

Figure 03: Global Market Absolute $ Opportunity (US$ Million) Analysis, 2024 to 2034

Figure 04: Global Market Value Share (%) Analysis 2024 to 2034, by Product

Figure 05: Global Market Y-o-Y Growth (%) Analysis 2024 to 2034, by Product

Figure 06: Global Market Attractiveness Analysis 2024 to 2034, by Product

Figure 07: Global Market Value Share (%) Analysis 2024 to 2034, by Source

Figure 08: Global Market Y-o-Y Growth (%) Analysis 2024 to 2034, by Source

Figure 09: Global Market Attractiveness Analysis 2024 to 2034, by Source

Figure 10: Global Market Value Share (%) Analysis 2024 to 2034, by Dosage Form

Figure 11: Global Market Y-o-Y Growth (%) Analysis 2024 to 2034, by Dosage Form

Figure 12: Global Market Attractiveness Analysis 2024 to 2034, by Dosage Form

Figure 13: Global Market Value Share (%) Analysis 2024 to 2034, by Indication

Figure 14: Global Market Y-o-Y Growth (%) Analysis 2024 to 2034, by Indication

Figure 15: Global Market Attractiveness Analysis 2024 to 2034, by Indication

Figure 16: Global Market Value Share (%) Analysis 2024 to 2034, by Distribution Channel

Figure 17: Global Market Y-o-Y Growth (%) Analysis 2024 to 2034, by Distribution Channel

Figure 18: Global Market Attractiveness Analysis 2024 to 2034, by Distribution Channel

Figure 19: Global Market Value Share (%) Analysis 2024 to 2034, by Region

Figure 20: Global Market Y-o-Y Growth (%) Analysis 2024 to 2034, by Region

Figure 21: Global Market Attractiveness Analysis 2024 to 2034, by Region

Figure 22: North America Market Value (US$ Million) Analysis, 2019 to 2023

Figure 23: North America Market Value (US$ Million) Forecast, 2024 to 2034

Figure 24: North America Market Value Share, by Product 2024 (E)

Figure 25: North America Market Value Share, by Source 2024 (E)

Figure 26: North America Market Value Share, by Dosage Form 2024 (E)

Figure 27: North America Market Value Share, by Indication 2024 (E)

Figure 28: North America Market Value Share, by Distribution Channel 2024 (E)

Figure 29: North America Market Value Share, by Country 2024 (E)

Figure 30: North America Market Attractiveness Analysis by Product, 2024 to 2034

Figure 31: North America Market Attractiveness Analysis by Source, 2024 to 2034

Figure 32: North America Market Attractiveness Analysis by Dosage Form, 2024 to 2034

Figure 33: North America Market Attractiveness Analysis by Indication, 2024 to 2034

Figure 34: North America Market Attractiveness Analysis by Distribution Channel, 2024 to 2034

Figure 35: North America Market Attractiveness Analysis by Country, 2024 to 2034

Figure 36: USA Market Value Proportion Analysis, 2021

Figure 37: Global Vs. USA Growth Comparison, 2024 to 2034

Figure 38: USA Market Share Analysis (%) by Product, 2023 to 2034

Figure 39: USA Market Share Analysis (%) by Source, 2023 to 2034

Figure 40: USA Market Share Analysis (%) by Dosage Form, 2023 to 2034

Figure 41: USA Market Share Analysis (%) by Indication, 2023 to 2034

Figure 42: USA Market Share Analysis (%) by Distribution Channel, 2023 to 2034

Figure 43: Canada Market Value Proportion Analysis, 2021

Figure 44: Global Vs. Canada. Growth Comparison, 2024 to 2034

Figure 45: Canada Market Share Analysis (%) by Product, 2023 to 2034

Figure 46: Canada Market Share Analysis (%) by Source, 2023 to 2034

Figure 47: Canada Market Share Analysis (%) by Dosage Form, 2023 to 2034

Figure 48: Canada Market Share Analysis (%) by Indication, 2023 to 2034

Figure 49: Canada Market Share Analysis (%) by Distribution Channel, 2023 to 2034

Figure 50: Latin America Market Value (US$ Million) Analysis, 2019 to 2023

Figure 51: Latin America Market Value (US$ Million) Forecast, 2024 to 2034

Figure 52: Latin America Market Value Share, by Product 2024 (E)

Figure 53: Latin America Market Value Share, by Source 2024 (E)

Figure 54: Latin America Market Value Share, by Dosage Form 2024 (E)

Figure 55: Latin America Market Value Share, by Indication 2024 (E)

Figure 56: Latin America Market Value Share, by Distribution Channel 2024 (E)

Figure 57: Latin America Market Value Share, by Country 2024 (E)

Figure 58: Latin America Market Attractiveness Analysis by Product, 2024 to 2034

Figure 59: Latin America Market Attractiveness Analysis by Source, 2024 to 2034

Figure 60: Latin America Market Attractiveness Analysis by Dosage Form, 2024 to 2034

Figure 61: Latin America Market Attractiveness Analysis by Indication, 2024 to 2034

Figure 62: Latin America Market Attractiveness Analysis by Distribution Channel, 2024 to 2034

Figure 63: Latin America Market Attractiveness Analysis by Country, 2024 to 2034

Figure 64: Mexico Market Value Proportion Analysis, 2021

Figure 65: Global Vs Mexico Growth Comparison, 2024 to 2034

Figure 66: Mexico Market Share Analysis (%) by Product, 2023 to 2034

Figure 67: Mexico Market Share Analysis (%) by Source, 2023 to 2034

Figure 68: Mexico Market Share Analysis (%) by Dosage Form, 2023 to 2034

Figure 69: Mexico Market Share Analysis (%) by Indication, 2023 to 2034

Figure 70: Mexico Market Share Analysis (%) by Distribution Channel, 2023 to 2034

Figure 71: Brazil Market Value Proportion Analysis, 2021

Figure 72: Global Vs. Brazil. Growth Comparison, 2024 to 2034

Figure 73: Brazil Market Share Analysis (%) by Product, 2023 to 2034

Figure 74: Brazil Market Share Analysis (%) by Source, 2023 to 2034

Figure 75: Brazil Market Share Analysis (%) by Dosage Form, 2023 to 2034

Figure 76: Brazil Market Share Analysis (%) by Indication, 2023 to 2034

Figure 77: Brazil Market Share Analysis (%) by Distribution Channel, 2023 to 2034

Figure 78: Argentina Market Value Proportion Analysis, 2021

Figure 79: Global Vs Argentina Growth Comparison, 2024 to 2034

Figure 80: Argentina Market Share Analysis (%) by Product, 2023 to 2034

Figure 81: Argentina Market Share Analysis (%) by Source, 2023 to 2034

Figure 82: Argentina Market Share Analysis (%) by Dosage Form, 2023 to 2034

Figure 83: Argentina Market Share Analysis (%) by Indication, 2023 to 2034

Figure 84: Argentina Market Share Analysis (%) by Distribution Channel, 2023 to 2034

Figure 85: Europe Market Value (US$ Million) Analysis, 2019 to 2023

Figure 86: Europe Market Value (US$ Million) Forecast, 2024 to 2034

Figure 87: Europe Market Value Share, by Product 2024 (E)

Figure 88: Europe Market Value Share, by Source 2024 (E)

Figure 89: Europe Market Value Share, by Dosage Form 2024 (E)

Figure 90: Europe Market Value Share, by Indication 2024 (E)

Figure 91: Europe Market Value Share, by Distribution Channel 2024 (E)

Figure 92: Europe Market Value Share, by Country 2024 (E)

Figure 93: Europe Market Attractiveness Analysis by Product, 2024 to 2034

Figure 94: Europe Market Attractiveness Analysis by Source, 2024 to 2034

Figure 95: Europe Market Attractiveness Analysis by Dosage Form, 2024 to 2034

Figure 96: Europe Market Attractiveness Analysis by Indication, 2024 to 2034

Figure 97: Europe Market Attractiveness Analysis by Distribution Channel, 2024 to 2034

Figure 98: Europe Market Attractiveness Analysis by Country, 2024 to 2034

Figure 99: UK Market Value Proportion Analysis, 2021

Figure 100: Global Vs. UK Growth Comparison, 2024 to 2034

Figure 101: UK Market Share Analysis (%) by Product, 2023 to 2034

Figure 102: UK Market Share Analysis (%) by Source, 2023 to 2034

Figure 103: UK Market Share Analysis (%) by Dosage Form, 2023 to 2034

Figure 104: UK Market Share Analysis (%) by Indication, 2023 to 2034

Figure 105: UK Market Share Analysis (%) by Distribution Channel, 2023 to 2034

Figure 106: Germany Market Value Proportion Analysis, 2021

Figure 107: Global Vs. Germany Growth Comparison, 2024 to 2034

Figure 108: Germany Market Share Analysis (%) by Product, 2023 to 2034

Figure 109: Germany Market Share Analysis (%) by Source, 2023 to 2034

Figure 110: Germany Market Share Analysis (%) by Dosage Form, 2023 to 2034

Figure 111: Germany Market Share Analysis (%) by Indication, 2023 to 2034

Figure 112: Germany Market Share Analysis (%) by Distribution Channel, 2023 to 2034

Figure 113: Italy Market Value Proportion Analysis, 2021

Figure 114: Global Vs. Italy Growth Comparison, 2024 to 2034

Figure 115: Italy Market Share Analysis (%) by Product, 2023 to 2034

Figure 116: Italy Market Share Analysis (%) by Source, 2023 to 2034

Figure 117: Italy Market Share Analysis (%) by Dosage Form, 2023 to 2034

Figure 118: Italy Market Share Analysis (%) by Indication, 2023 to 2034

Figure 119: Italy Market Share Analysis (%) by Distribution Channel, 2023 to 2034

Figure 120: France Market Value Proportion Analysis, 2021

Figure 121: Global Vs France Growth Comparison, 2024 to 2034

Figure 122: France Market Share Analysis (%) by Product, 2023 to 2034

Figure 123: France Market Share Analysis (%) by Source, 2023 to 2034

Figure 124: France Market Share Analysis (%) by Dosage Form, 2023 to 2034

Figure 125: France Market Share Analysis (%) by Indication, 2023 to 2034

Figure 126: France Market Share Analysis (%) by Distribution Channel, 2023 to 2034

Figure 127: Spain Market Value Proportion Analysis, 2021

Figure 128: Global Vs Spain Growth Comparison, 2024 to 2034

Figure 129: Spain Market Share Analysis (%) by Product, 2023 to 2034

Figure 130: Spain Market Share Analysis (%) by Source, 2023 to 2034

Figure 131: Spain Market Share Analysis (%) by Dosage Form, 2023 to 2034

Figure 132: Spain Market Share Analysis (%) by Indication, 2023 to 2034

Figure 133: Spain Market Share Analysis (%) by Distribution Channel, 2023 to 2034

Figure 134: Russia Market Value Proportion Analysis, 2021

Figure 135: Global Vs Russia Growth Comparison, 2024 to 2034

Figure 136: Russia Market Share Analysis (%) by Product, 2023 to 2034

Figure 137: Russia Market Share Analysis (%) by Source, 2023 to 2034

Figure 138: Russia Market Share Analysis (%) by Dosage Form, 2023 to 2034

Figure 139: Russia Market Share Analysis (%) by Indication, 2023 to 2034

Figure 140: Russia Market Share Analysis (%) by Distribution Channel, 2023 to 2034

Figure 141: BENELUX Market Value Proportion Analysis, 2021

Figure 142: Global Vs BENELUX Growth Comparison, 2024 to 2034

Figure 143: BENELUX Market Share Analysis (%) by Product, 2023 to 2034

Figure 144: BENELUX Market Share Analysis (%) by Source, 2023 to 2034

Figure 145: BENELUX Market Share Analysis (%) by Dosage Form, 2023 to 2034

Figure 146: BENELUX Market Share Analysis (%) by Indication, 2023 to 2034

Figure 147: BENELUX Market Share Analysis (%) by Distribution Channel, 2023 to 2034

Figure 148: East Asia Market Value (US$ Million) Analysis, 2019 to 2023

Figure 149: East Asia Market Value (US$ Million) Forecast, 2024 to 2034

Figure 150: East Asia Market Value Share, by Product 2024 (E)

Figure 151: East Asia Market Value Share, by Source 2024 (E)

Figure 152: East Asia Market Value Share, by Dosage Form 2024 (E)

Figure 153: East Asia Market Value Share, by Indication 2024 (E)

Figure 154: East Asia Market Value Share, by Distribution Channel 2024 (E)

Figure 155: East Asia Market Value Share, by Country 2024 (E)

Figure 156: East Asia Market Attractiveness Analysis by Product, 2024 to 2034

Figure 157: East Asia Market Attractiveness Analysis by Source, 2024 to 2034

Figure 158: East Asia Market Attractiveness Analysis by Dosage Form, 2024 to 2034

Figure 159: East Asia Market Attractiveness Analysis by Indication, 2024 to 2034

Figure 160: East Asia Market Attractiveness Analysis by Distribution Channel, 2024 to 2034

Figure 161: East Asia Market Attractiveness Analysis by Country, 2024 to 2034

Figure 162: China Market Value Proportion Analysis, 2021

Figure 163: Global Vs. China Growth Comparison, 2024 to 2034

Figure 164: China Market Share Analysis (%) by Product, 2023 to 2034

Figure 165: China Market Share Analysis (%) by Source, 2023 to 2034

Figure 166: China Market Share Analysis (%) by Dosage Form, 2023 to 2034

Figure 167: China Market Share Analysis (%) by Indication, 2023 to 2034

Figure 168: China Market Share Analysis (%) by Distribution Channel, 2023 to 2034

Figure 169: Japan Market Value Proportion Analysis, 2021

Figure 170: Global Vs. Japan Growth Comparison, 2024 to 2034

Figure 171: Japan Market Share Analysis (%) by Product, 2023 to 2034

Figure 172: Japan Market Share Analysis (%) by Source, 2023 to 2034

Figure 173: Japan Market Share Analysis (%) by Dosage Form, 2023 to 2034

Figure 174: Japan Market Share Analysis (%) by Indication, 2023 to 2034

Figure 175: Japan Market Share Analysis (%) by Distribution Channel, 2023 to 2034

Figure 176: South Korea Market Value Proportion Analysis, 2021

Figure 177: Global Vs South Korea Growth Comparison, 2024 to 2034

Figure 178: South Korea Market Share Analysis (%) by Product, 2023 to 2034

Figure 179: South Korea Market Share Analysis (%) by Source, 2023 to 2034

Figure 180: South Korea Market Share Analysis (%) by Dosage Form, 2023 to 2034

Figure 181: South Korea Market Share Analysis (%) by Indication, 2023 to 2034

Figure 182: South Korea Market Share Analysis (%) by Distribution Channel, 2023 to 2034

Figure 183: South Asia Market Value (US$ Million) Analysis, 2019 to 2023

Figure 184: South Asia Market Value (US$ Million) Forecast, 2024 to 2034

Figure 185: South Asia Market Value Share, by Product 2024 (E)

Figure 186: South Asia Market Value Share, by Source 2024 (E)

Figure 187: South Asia Market Value Share, by Dosage Form 2024 (E)

Figure 188: South Asia Market Value Share, by Indication 2024 (E)

Figure 189: South Asia Market Value Share, by Distribution Channel 2024 (E)

Figure 190: South Asia Market Value Share, by Country 2024 (E)

Figure 191: South Asia Market Attractiveness Analysis by Product, 2024 to 2034

Figure 192: South Asia Market Attractiveness Analysis by Source, 2024 to 2034

Figure 193: South Asia Market Attractiveness Analysis by Dosage Form, 2024 to 2034

Figure 194: South Asia Market Attractiveness Analysis by Indication, 2024 to 2034

Figure 195: South Asia Market Attractiveness Analysis by Distribution Channel, 2024 to 2034

Figure 196: South Asia Market Attractiveness Analysis by Country, 2024 to 2034

Figure 197: India Market Value Proportion Analysis, 2021

Figure 198: Global Vs. India Growth Comparison, 2024 to 2034

Figure 199: India Market Share Analysis (%) by Product, 2023 to 2034

Figure 200: India Market Share Analysis (%) by Source, 2023 to 2034

Figure 201: India Market Share Analysis (%) by Dosage Form, 2023 to 2034

Figure 202: India Market Share Analysis (%) by Indication, 2023 to 2034

Figure 203: India Market Share Analysis (%) by Distribution Channel, 2023 to 2034

Figure 204: Indonesia Market Value Proportion Analysis, 2021

Figure 205: Global Vs. Indonesia Growth Comparison, 2024 to 2034

Figure 206: Indonesia Market Share Analysis (%) by Product, 2023 to 2034

Figure 207: Indonesia Market Share Analysis (%) by Source, 2023 to 2034

Figure 208: Indonesia Market Share Analysis (%) by Dosage Form, 2023 to 2034

Figure 209: Indonesia Market Share Analysis (%) by Indication, 2023 to 2034

Figure 210: Indonesia Market Share Analysis (%) by Distribution Channel, 2023 to 2034

Figure 211: Malaysia Market Value Proportion Analysis, 2021

Figure 212: Global Vs. Malaysia Growth Comparison, 2024 to 2034

Figure 213: Malaysia Market Share Analysis (%) by Product, 2023 to 2034

Figure 214: Malaysia Market Share Analysis (%) by Source, 2023 to 2034

Figure 215: Malaysia Market Share Analysis (%) by Dosage Form, 2023 to 2034

Figure 216: Malaysia Market Share Analysis (%) by Indication, 2023 to 2034

Figure 217: Malaysia Market Share Analysis (%) by Distribution Channel, 2023 to 2034

Figure 218: Thailand Market Value Proportion Analysis, 2021

Figure 219: Global Vs. Thailand Growth Comparison, 2024 to 2034

Figure 220: Thailand Market Share Analysis (%) by Product, 2023 to 2034

Figure 221: Thailand Market Share Analysis (%) by Source, 2023 to 2034

Figure 222: Thailand Market Share Analysis (%) by Dosage Form, 2023 to 2034

Figure 223: Thailand Market Share Analysis (%) by Indication, 2023 to 2034

Figure 224: Thailand Market Share Analysis (%) by Distribution Channel, 2023 to 2034

Figure 225: Oceania Market Value (US$ Million) Analysis, 2019 to 2023

Figure 226: Oceania Market Value (US$ Million) Forecast, 2024 to 2034

Figure 227: Oceania Market Value Share, by Product 2024 (E)

Figure 228: Oceania Market Value Share, by Source 2024 (E)

Figure 229: Oceania Market Value Share, by Dosage Form 2024 (E)

Figure 230: Oceania Market Value Share, by Indication 2024 (E)

Figure 231: Oceania Market Value Share, by Distribution Channel 2024 (E)

Figure 232: Oceania Market Value Share, by Country 2024 (E)

Figure 233: Oceania Market Attractiveness Analysis by Product, 2024 to 2034

Figure 234: Oceania Market Attractiveness Analysis by Source, 2024 to 2034

Figure 235: Oceania Market Attractiveness Analysis by Dosage Form, 2024 to 2034

Figure 236: Oceania Market Attractiveness Analysis by Indication, 2024 to 2034

Figure 237: Oceania Market Attractiveness Analysis by Distribution Channel, 2024 to 2034

Figure 238: Oceania Market Attractiveness Analysis by Country, 2024 to 2034

Figure 239: Australia Market Value Proportion Analysis, 2021

Figure 240: Global Vs. Australia Growth Comparison, 2024 to 2034

Figure 241: Australia Market Share Analysis (%) by Product, 2023 to 2034

Figure 242: Australia Market Share Analysis (%) by Source, 2023 to 2034

Figure 243: Australia Market Share Analysis (%) by Dosage Form, 2023 to 2034

Figure 244: Australia Market Share Analysis (%) by Indication, 2023 to 2034

Figure 245: Australia Market Share Analysis (%) by Distribution Channel, 2023 to 2034

Figure 246: New Zealand Market Value Proportion Analysis, 2021

Figure 247: Global Vs New Zealand Growth Comparison, 2024 to 2034

Figure 248: New Zealand Market Share Analysis (%) by Product, 2023 to 2034

Figure 249: New Zealand Market Share Analysis (%) by Source, 2023 to 2034

Figure 250: New Zealand Market Share Analysis (%) by Dosage Form, 2023 to 2034

Figure 251: New Zealand Market Share Analysis (%) by Indication, 2023 to 2034

Figure 252: New Zealand Market Share Analysis (%) by Distribution Channel, 2023 to 2034

Figure 253: Middle East & Africa Market Value (US$ Million) Analysis, 2019 to 2023

Figure 254: Middle East & Africa Market Value (US$ Million) Forecast, 2024 to 2034

Figure 255: Middle East & Africa Market Value Share, by Product 2024 (E)

Figure 256: Middle East & Africa Market Value Share, by Source 2024 (E)

Figure 257: Middle East & Africa Market Value Share, by Dosage Form 2024 (E)

Figure 258: Middle East & Africa Market Value Share, by Indication 2024 (E)

Figure 259: Middle East & Africa Market Value Share, by Distribution Channel 2024 (E)

Figure 260: Middle East & Africa Market Value Share, by Country 2024 (E)

Figure 261: Middle East & Africa Market Attractiveness Analysis by Product, 2024 to 2034

Figure 262: Middle East & Africa Market Attractiveness Analysis by Source, 2024 to 2034

Figure 263: Middle East & Africa Market Attractiveness Analysis by Dosage Form, 2024 to 2034

Figure 264: Middle East & Africa Market Attractiveness Analysis by Indication, 2024 to 2034

Figure 265: Middle East & Africa Market Attractiveness Analysis by Distribution Channel, 2024 to 2034

Figure 266: Middle East & Africa Market Attractiveness Analysis by Country, 2024 to 2034

Figure 267: GCC Countries Market Value Proportion Analysis, 2021

Figure 268: Global Vs GCC Countries Growth Comparison, 2024 to 2034

Figure 269: GCC Countries Market Share Analysis (%) by Product, 2023 to 2034

Figure 270: GCC Countries Market Share Analysis (%) by Source, 2023 to 2034

Figure 271: GCC Countries Market Share Analysis (%) by Dosage Form, 2023 to 2034

Figure 272: GCC Countries Market Share Analysis (%) by Indication, 2023 to 2034

Figure 273: GCC Countries Market Share Analysis (%) by Distribution Channel, 2023 to 2034

Figure 274: Türkiye Market Value Proportion Analysis, 2021

Figure 275: Global Vs. Türkiye Growth Comparison, 2024 to 2034

Figure 276: Türkiye Market Share Analysis (%) by Product, 2023 to 2034

Figure 277: Türkiye Market Share Analysis (%) by Source, 2023 to 2034

Figure 278: Türkiye Market Share Analysis (%) by Dosage Form, 2023 to 2034

Figure 279: Türkiye Market Share Analysis (%) by Indication, 2023 to 2034

Figure 280: Türkiye Market Share Analysis (%) by Distribution Channel, 2023 to 2034

Figure 281: South Africa Market Value Proportion Analysis, 2021

Figure 282: Global Vs. South Africa Growth Comparison, 2024 to 2034

Figure 283: South Africa Market Share Analysis (%) by Product, 2023 to 2034

Figure 284: South Africa Market Share Analysis (%) by Source, 2023 to 2034

Figure 285: South Africa Market Share Analysis (%) by Dosage Form, 2023 to 2034

Figure 286: South Africa Market Share Analysis (%) by Indication, 2023 to 2034

Figure 287: South Africa Market Share Analysis (%) by Distribution Channel, 2023 to 2034

Figure 288: North Africa Market Value Proportion Analysis, 2021

Figure 289: Global Vs North Africa Growth Comparison, 2024 to 2034

Figure 290: North Africa Market Share Analysis (%) by Product, 2023 to 2034

Figure 291: North Africa Market Share Analysis (%) by Source, 2023 to 2034

Figure 292: North Africa Market Share Analysis (%) by Dosage Form, 2023 to 2034

Figure 293: North Africa Market Share Analysis (%) by Indication, 2023 to 2034

Figure 294: North Africa Market Share Analysis (%) by Distribution Channel, 2023 to 2034

Frequently Asked Questions

How Big was the Sleep Supplement Market in 2023?

The global sleep supplement market was valued at USD 7.1 billion in 2023.

What is the Sales Forecast for Sleep Supplement Market through 2034?

The sleep supplement market is expected to reach USD 12.9 billion by 2034, growing at a 5.5% CAGR over the forecast period.

What is the Key Trend Driving the Sleep Supplement Market?

The primary drivers of the market are increasing awareness about sleep care and attractive dosage forms.

Which are the Top 5 Countries Driving Demand for Sleep Supplements?

The USA, India, Germany, China, and the United Kingdom are expected to drive demand for the global sleep supplement market.

What is the North American Market Outlook for Sleep Supplements?

North America is one of the key markets for sleep supplements, with the USA accounting for a share of 86.3%.

What is the Share of the Sleep Supplement Market in China?

China is leading the East Asia market with a share of 27.7%.

Which Countries are the Key Manufacturers of Sleep Supplements?

The United States and China are the key producers of sleep supplements.

What are the Key Market Statistics in Oceania?

Oceania has a global market share value of USD 165.3 billion and is expected to grow at a CAGR of 4.6% through 2034.

Who are the key players in the Sleep Supplement Market sphere?

Hims & Hers Health, Inc., Sandland Sleep, Makers Nutrition, Spectrum Lifesciences Pvt. Ltd., Wholesome MedTech Pvt Ltd, NUTRASCIENCE LABS, SMP Nutra are some of the key players in the sleep supplement industry.

Explore Similar Insights

Future Market Insights

Sleep Supplement Market