Reports

- Global Locations -

Headquarters

Future Market Insights, Inc.

Christiana Corporate, 200
Continental Drive, Suite 401,
Newark, Delaware - 19713,
United States

T: +1-845-579-5705

Americas

Future Market Insights, Inc.

616 Corporate Way, Suite 2-9018,
Valley Cottage, NY 10989, United States

T: +1-347-918-3531

MEA

Future Market Insights

1602-6 Jumeirah Bay X2 Tower, Plot No: JLT-PH2-X2A,
Jumeirah Lakes Towers, Dubai,
United Arab Emirates

Europe

Future Market Insights

3rd Floor, 207 Regent Street,
W1B 3HH London
United Kingdom

T: + 44 (0) 20 8123 9659
D: +44 (0) 20 3287 4268

Asia Pacific

Future Market Insights

IndiaLand Global Tech Park, Unit UG-1, Behind Grand HighStreet, Phase 1, Hinjawadi, MH, Pune – 411057, India

Sleep Study Market Outlook for 2024 to 2034

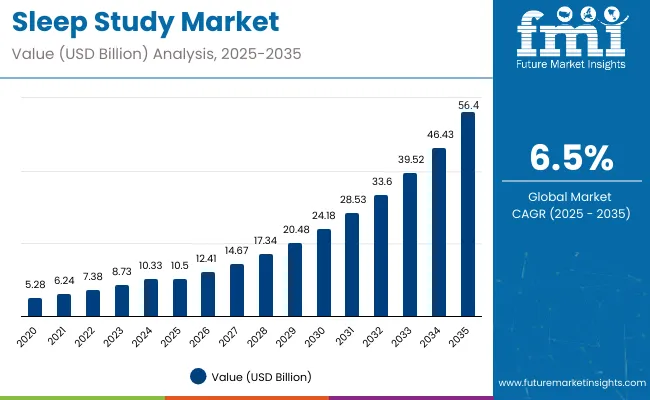
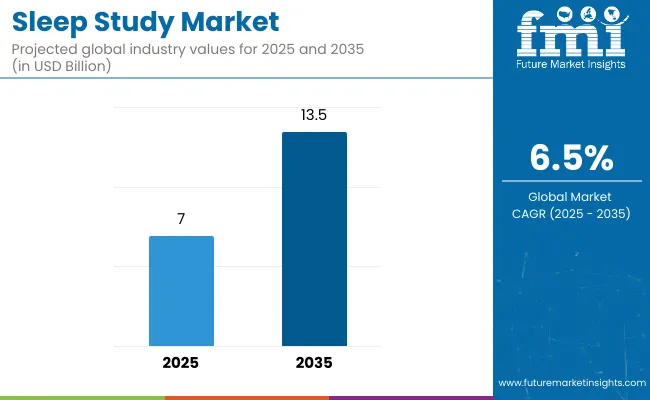
The sleep study market size is estimated to be worth US$ 6,754.2 million in 2024. The sleep study industry is anticipated to surpass US$ 12,678.6 million by 2034. The increasing prevalence of sleep disorders and awareness regarding their adverse health effects are major drivers propelling the adoption of sleep studies.

The demand for sleep study is predicted to rise at a CAGR of 6.50% through 2034. As awareness grows about the importance of quality sleep for overall well-being, more individuals seek professional diagnosis and treatment through sleep study.

Attributes Details
Sleep Study Market Value for 2024 US$ 6,754.2 million
Sleep Study Market Value for 2034 US$ 12,678.6 million
Sleep Study Market Forecast CAGR for 2024 to 2034 6.50%

Don't pay for what you don't need

Customize your report by selecting specific countries or regions and save 30%!

Adoption Analysis of the Sleep Study

  • Employers are incorporating sleep health initiatives into their corporate wellness programs to improve employee productivity, reduce absenteeism, and enhance overall well-being. As a result, employees are encouraged to undergo sleep studies to address potential sleep disorders and improve their sleep quality.
  • Athletes and sports teams are recognizing the significant impact of sleep on athletic performance and recovery. Many professional sports organizations now include sleep studies as part of their training and recovery protocols to optimize performance and reduce the risk of injuries.
  • With the global population aging, there is a growing recognition of the prevalence of sleep disorders among older adults. As individuals age, they are more susceptible to conditions like sleep apnea and insomnia, leading to increased demand for sleep studies to diagnose and manage these issues effectively.
  • The link between sleep and mental health is increasingly acknowledged, with research highlighting the bidirectional relationship between sleep disorders and mental health conditions such as depression and anxiety.

Historical Performance and Future Growth of the Sleep Study Market

Historical CAGR 8.50%
Forecast CAGR 6.50%

The sleep study industry has shown a significant historical CAGR of 8.50%, indicating robust expansion over the specified period. This rapid growth can be attributed to several key factors, including increasing awareness about the importance of sleep health, rising prevalence of sleep disorders, advancements in sleep study technologies, and growing investment in healthcare infrastructure.

The forecasted CAGR for the sleep study market is slightly moderate at 6.50%. Several factors may have influenced this decrease in the projected growth rate. One possible factor is market saturation, as the initial surge in demand for sleep study may have plateaued over time. Additionally, regulatory challenges, reimbursement issues, and competition from alternative diagnostic methods could have impacted market growth.

Looking ahead, the market is expected to continue growing steadily, albeit at a slightly reduced rate. Factors such as ongoing research and development efforts to improve sleep study technologies, increasing adoption of telemedicine solutions, and rising awareness campaigns about sleep disorders are anticipated to support market expansion.

Sabyasachi Ghosh
Sabyasachi Ghosh

Principal Consultant

Talk to Analyst

Find your sweet spots for generating winning opportunities in this market.

Key Trends Influencing the Sleep Study Market

  • Growing Awareness of Sleep Health

Increasing awareness of the importance of sleep for overall health and well-being is fueling interest in sleep studies among both individuals and healthcare providers, leading to higher demand for sleep assessment services.

  • Telemedicine Expansion

The expansion of telemedicine services allows individuals to undergo sleep study remotely, eliminating the need for in-person visits to sleep centers and improving access to sleep assessment services, especially in underserved areas.

  • Increasing Adoption of Home Sleep Testing

Home sleep testing is becoming increasingly popular as it is more convenient and cost-effective than in-lab sleep study. This trend is expected to continue as technology improves and becomes more accessible.

  • Growing Demand for Personalized Treatment

There is a growing demand for personalized treatment plans for sleep disorders. Sleep studies can help providers create customized treatment plans based on individual patient needs.

  • Reimbursement Policies

Reimbursement policies for sleep study are evolving, with many insurance providers covering the cost of sleep study. This is driving the adoption of sleep studies and is expected to continue to do so in the forecast period.

Comparative View of the Adjacent Sleep Study Market

This section provides a comparative view of the sleep study industry, the melatonin sleep supplements market, and the home sleep screening devices market. The table below compares each market from 2024 to 2034, including CAGR, opportunities, and key trends in each market.

Sleep Study Market:

Attributes Sleep Study Market
CAGR (2024 to 2034) 6.50%
Opportunity Leveraging virtual reality technology to simulate different sleep environments for more accurate assessments and treatments
Key Trends Adoption of wearable sleep tracking devices integrated with AI algorithms for personalized sleep analysis and recommendations

Melatonin Sleep Supplements Market:

Attributes Melatonin Sleep Supplements Market
CAGR (2024 to 2034) 7.6%
Opportunity Developing fast-acting melatonin formulations tailored to specific sleep disorders, such as insomnia or delayed sleep phase syndrome
Key Trends Growing demand for natural and organic melatonin supplements derived from plant-based sources, catering to health-conscious consumers

Home Sleep Screening Devices Market:

Attributes Home Sleep Screening Devices Market
CAGR (2024 to 2034) 8.5%
Opportunity Creating user-friendly and affordable home sleep screening kits with telemedicine support for remote diagnosis and consultations
Key Trends Integration of sleep screening devices with smart home ecosystems for seamless data sharing and integration with other health monitoring systems

Get the data you need at a Fraction of the cost

Personalize your report by choosing insights you need
and save 40%!

Category-wise Insights

This section provides detailed insights into specific segments in the sleep study industry.

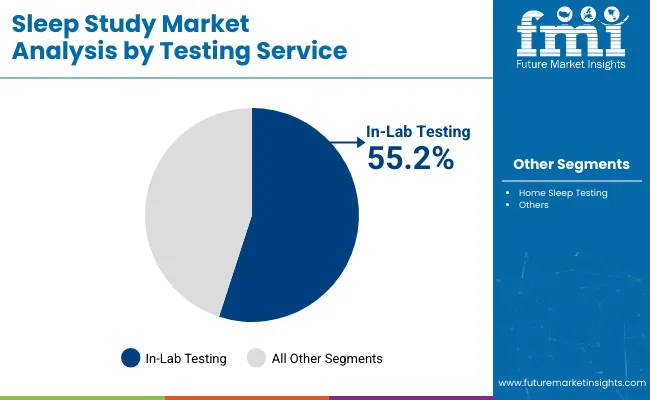
In-Lab Testing Segment to Hold a Share of 61% in 2024

Top Testing Services In-Lab Testing
Market Share in 2024 61%

In-lab testing emerges as the leading category, capturing a projected 61% market share in 2024. Its growth can be attributed to several factors:

  • In-lab testing provides a controlled environment for detailed monitoring, enabling a more precise diagnosis of sleep disorders.
  • In-lab settings allow for the use of sophisticated equipment to capture various physiological data, offering a deeper understanding of sleep patterns.
  • Sleep specialists often oversee in-lab testing, providing valuable interpretation of the collected data to guide treatment decisions.
  • In-lab testing caters to a broad range of sleep disorders, making it a preferred option for complex cases.

Obstructive Sleep Apnea Segment to Dominate the Industry in 2024

Dominating Indication Segment Obstructive Sleep Apnea
Market Share in 2024 41%

Obstructive sleep apnea (OSA) is expected to be the dominant indication segment in 2024, holding a projected market share of 41%. This dominance is driven by:

  • The global prevalence of OSA is increasing, fueled by factors like obesity and an aging population.
  • Growing awareness of OSA and advancements in diagnostic tools are leading to earlier detection and treatment.
  • Despite existing treatment options, there remains a significant unmet need for effective and accessible OSA therapies.
  • Early diagnosis and intervention for OSA are crucial to prevent associated health complications, driving the demand for this specific sleep study segment.

Country-wise Insights

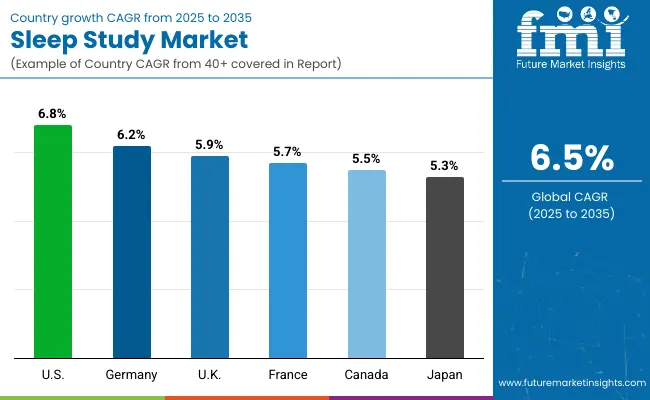
The section analyzes the sleep study market across key countries, including the United States, United Kingdom, Thailand, India, and Germany. The analysis delves into the specific factors driving the demand for sleep studies in these countries.

Countries CAGR
United States 5.4%
United Kingdom 7.50%
Thailand 12.5%
India 9.81%
Germany 5.17%

Sleep Study Industry in the United States

The sleep study industry in the United States is projected to rise at a CAGR of 5.4% through 2034.

  • The USA prioritizes high-quality sleep studies and readily adopts novel technologies and diagnostic methods.
  • Rising healthcare costs may pose challenges to the affordability of sleep study for some individuals.
  • The prevalence of chronic conditions like obesity and diabetes, often linked to sleep disorders, leads to a steady demand for sleep studies for diagnosis and management.
  • Reimbursement policies and insurance coverage for sleep studies continue to evolve, influencing market growth.

Sleep Study Industry in the United Kingdom

The sleep study industry in the United Kingdom is likely to rise at a CAGR of 7.50% through 2034.

  • Rising focus on high-quality sleep study and readily adopts novel technologies and diagnostic methods.
  • Supportive government initiatives promoting public health and early disease detection can further stimulate the sleep study market.
  • Growing awareness of the link between sleep disorders and mental health conditions like depression and anxiety can drive demand for sleep study.

Sleep Study Industry in Thailand

Thailand’s sleep study industry is anticipated to witness expansion at a CAGR of 12.5% through 2034.

  • Thailand's booming economy fuels disposable income and rising healthcare awareness, leading to increased demand for specialized medical services, including sleep study.
  • The growing elderly population is more susceptible to sleep disorders, necessitating greater access to sleep study for diagnosis and treatment.
  • Growing public awareness about sleep disorders and their health implications encourages individuals to seek professional evaluation through sleep study.
  • Supportive government policies promoting public health and early disease detection can further stimulate the sleep study market.
  • Investments in healthcare infrastructure, including sleep labs, contribute to improved accessibility and affordability of sleep study.

Sleep Study Industry in India

India's sleep study industry is projected to rise at a CAGR of 9.81% through 2034.

  • Similar trends of economic growth, aging population, and rising healthcare awareness contribute to increased demand for sleep study in India.
  • Rapid urbanization and changing lifestyles often lead to sleep disturbances, prompting individuals to seek solutions through sleep study.
  • Growing recognition of the long-term health consequences of untreated sleep disorders encourages early diagnosis and intervention, increasing demand for sleep studies.
  • Technological advancements in sleep study equipment and diagnostic tools enhance accuracy and affordability, making sleep study more accessible.
  • Increasing health insurance coverage in India can further facilitate access to sleep study for a wider population.

Sleep Study Industry in Germany

Germany's sleep study market is expected to rise at a 5.17% CAGR through 2034.

  • The German market exhibits stable growth due to market maturity and a developed healthcare system.
  • Germany prioritizes high-quality sleep studies and readily adopts novel technologies and diagnostic methods.
  • Germany's emphasis on preventive healthcare can encourage individuals to seek sleep studies for early detection and treatment of sleep disorders.
  • Relatively high health insurance coverage in Germany facilitates access to sleep study for a wider population.
  • Germany's strong focus on research and development in sleep medicine can lead to advancements in diagnostic tools and treatment options, influencing future market growth.

Competition Outlook of the Sleep Study Industry

Traditional sleep labs, often backed by major healthcare institutions, hold a strong market position. However, smaller, independent sleep clinics are emerging, offering competitive pricing and flexible scheduling options. This necessitates established players to modernize their facilities and services to remain competitive.

Technological advancements are shaping the competitive landscape. Players offering home sleep testing (HST) kits and cloud-based platforms for data analysis are gaining traction, providing patients with convenient and cost-effective alternatives to in-lab study. Established players need to adopt these technologies and invest in research & development to maintain their edge.

Collaboration holds significant potential. Partnerships between sleep clinics and healthcare providers facilitate referrals and improve patient access to sleep study. Additionally, collaborations with technology companies can accelerate innovation and enhance the patient experience through digital tools and data integration.

Recent Developments in the Sleep Study Industry

  • In 2023, the International Institute of Sleep partnered with EnsoData, a company that uses artificial intelligence to analyze sleep data.
  • In 2021, Vivos Therapeutics, Inc. partnered with Empower Sleep, a digital healthcare platform that offers online treatment for sleep disorders, to provide critical diagnostic consultation services as well as medical care to individuals with obstructive sleep apnea throughout North America.
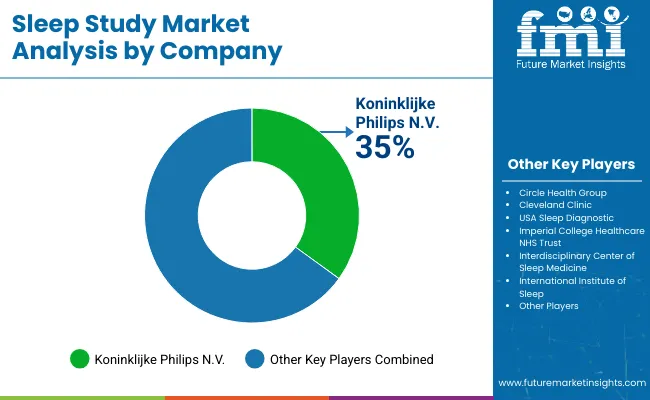
  • Koninklijke Philips N.V., a Dutch-based company, is a global leader in health technology, including sleep solutions. In 2023, it launched a new sleep apnea screening device called Philips NightBalance, which uses a wearable sensor to monitor breathing patterns and deliver gentle vibrations to encourage side sleeping.

Key Companies in the Market

  • Circle Health Group
  • Cleveland Clinic
  • Competence Center of Sleep Medicine
  • Imperial College Healthcare NHS Trust
  • Interdisciplinary Center of Sleep Medicine
  • International Institute of Sleep
  • Koninklijke Philips N.V.
  • Korea University Medicine
  • London Sleep Centre
  • MedStar Health
  • Millennium Sleep Lab
  • Omni Sleep Health
  • PM Sleep Lab
  • ResMed
  • Singapore Neurology & Sleep Centre
  • Singular Sleep, LLC
  • Sleep Management Institute

Key Coverage in the Sleep Study Industry Report

  • Sleep Apnea Devices Market Outlook
  • Demand for Sleep Testing Services
  • Polysomnography Devices Market Growth
  • Top Sleep Service Providers
  • Sleep Disorder Clinics Demand in the United States

Key Segments

By Testing Services:

  • Home Sleep Testing
  • In-Lab Testing
    • Polysomnography (PSG) Testing
    • CPAP/ BiPAP Titration
    • Split Night Polysomnography
    • Multiple Sleep Latency Test (MSLT)
    • Maintenance of Wakefulness Test (MWT)
    • Epilepsy Monitoring

By Indication:

  • Obstructive Sleep Apnea
  • Insomnia
  • Restless Leg Syndrome
  • Circadian Rhythm Sleeping Disorders
  • Narcolepsy
  • Rapid eye movement (REM) Sleeping Disorders
  • Periodic Limb Movement Disorders
  • Bruxism

By End User:

  • Hospital Settings
  • Sleep Testing Centres
  • Home Care Settings

By Region:

  • North America
  • Latin America
  • Europe
  • East Asia
  • South Asia
  • Oceania
  • Middle East and Africa

Frequently Asked Questions

What is the Market Potential for Sleep Study?

The sleep study market is projected to expand at a CAGR of 6.50% between 2024 and 2034.

Which Testing Services Segment Dominates the Sleep Study Market?

The in-lab testing segment is predicted to dominate the industry.

Who are the Top Three Sleep Study Providers?

The top 3 sleep study providers are Circle Health Group, Cleveland Clinic, and Competence Center of Sleep Medicine.

What is the Sleep Study Market Growth Outlook for 2034?

The sleep study market is anticipated to surpass US$ 12,678.6 million by 2034.

What is Driving the Demand for Sleep Study?

Increased awareness about the importance of sleep health and the rising prevalence of sleep disorders are driving the demand for sleep study.

Table of Content

1. Executive Summary

    1.1. Global Market Outlook

    1.2. Demand-side Trends

    1.3. Supply-side Trends

    1.4. Technology Roadmap Analysis

    1.5. Analysis and Recommendations

2. Market Overview

    2.1. Market Coverage / Taxonomy

    2.2. Market Definition / Scope / Limitations

3. Market Background

    3.1. Market Dynamics

        3.1.1. Drivers

        3.1.2. Restraints

        3.1.3. Opportunity

        3.1.4. Trends

    3.2. Scenario Forecast

        3.2.1. Demand in Optimistic Scenario

        3.2.2. Demand in Likely Scenario

        3.2.3. Demand in Conservative Scenario

    3.3. Opportunity Map Analysis

    3.4. Investment Feasibility Matrix

    3.5. PESTLE and Porter’s Analysis

    3.6. Regulatory Landscape

        3.6.1. By Key Regions

        3.6.2. By Key Countries

    3.7. Regional Parent Market Outlook

4. Global Market Analysis 2019 to 2023 and Forecast, 2024 to 2034

    4.1. Historical Market Size Value (US$ Million) Analysis, 2019 to 2023

    4.2. Current and Future Market Size Value (US$ Million) Projections, 2024 to 2034

        4.2.1. Y-o-Y Growth Trend Analysis

        4.2.2. Absolute $ Opportunity Analysis

5. Global Market Analysis 2019 to 2023 and Forecast 2024 to 2034, By Testing Services

    5.1. Introduction / Key Findings

    5.2. Historical Market Size Value (US$ Million) Analysis By Testing Services, 2019 to 2023

    5.3. Current and Future Market Size Value (US$ Million) Analysis and Forecast By Testing Services, 2024 to 2034

        5.3.1. Home Sleep Testing

        5.3.2. In-Lab Testing

            5.3.2.1. Polysomnography (PSG) Testing

            5.3.2.2. CPAP/ BiPAP Titration

            5.3.2.3. Split Night Polysomnography

            5.3.2.4. Multiple Sleep Latency Test (MSLT)

            5.3.2.5. Maintenance of Wakefulness Test (MWT)

            5.3.2.6. Epilepsy Monitoring

    5.4. Y-o-Y Growth Trend Analysis By Testing Services, 2019 to 2023

    5.5. Absolute $ Opportunity Analysis By Testing Services, 2024 to 2034

6. Global Market Analysis 2019 to 2023 and Forecast 2024 to 2034, By Indication

    6.1. Introduction / Key Findings

    6.2. Historical Market Size Value (US$ Million) Analysis By Indication, 2019 to 2023

    6.3. Current and Future Market Size Value (US$ Million) Analysis and Forecast By Indication, 2024 to 2034

        6.3.1. Obstructive Sleep Apnoea

        6.3.2. Insomnia

        6.3.3. Restless Leg Syndrome

        6.3.4. Circadian Rhythm Sleeping Disorders

        6.3.5. Narcolepsy

        6.3.6. Rapid eye movement (REM) Sleep Disorders

        6.3.7. Periodic Limb Movement Disorders

        6.3.8. Bruxism

    6.4. Y-o-Y Growth Trend Analysis By Indication, 2019 to 2023

    6.5. Absolute $ Opportunity Analysis By Indication, 2024 to 2034

7. Global Market Analysis 2019 to 2023 and Forecast 2024 to 2034, By End User

    7.1. Introduction / Key Findings

    7.2. Historical Market Size Value (US$ Million) Analysis By End User, 2019 to 2023

    7.3. Current and Future Market Size Value (US$ Million) Analysis and Forecast By End User, 2024 to 2034

        7.3.1. Hospital Settings

        7.3.2. Sleep Testing Centres

        7.3.3. Home Care Settings

    7.4. Y-o-Y Growth Trend Analysis By End User, 2019 to 2023

    7.5. Absolute $ Opportunity Analysis By End User, 2024 to 2034

8. Global Market Analysis 2019 to 2023 and Forecast 2024 to 2034, By Region

    8.1. Introduction

    8.2. Historical Market Size Value (US$ Million) Analysis By Region, 2019 to 2023

    8.3. Current Market Size Value (US$ Million) Analysis and Forecast By Region, 2024 to 2034

        8.3.1. North America

        8.3.2. Latin America

        8.3.3. Western Europe

        8.3.4. Eastern Europe

        8.3.5. South Asia and Pacific

        8.3.6. East Asia

        8.3.7. Middle East and Africa

    8.4. Market Attractiveness Analysis By Region

9. North America Market Analysis 2019 to 2023 and Forecast 2024 to 2034, By Country

    9.1. Historical Market Size Value (US$ Million) Trend Analysis By Market Taxonomy, 2019 to 2023

    9.2. Market Size Value (US$ Million) Forecast By Market Taxonomy, 2024 to 2034

        9.2.1. By Country

            9.2.1.1. USA

            9.2.1.2. Canada

        9.2.2. By Testing Services

        9.2.3. By Indication

        9.2.4. By End User

    9.3. Market Attractiveness Analysis

        9.3.1. By Country

        9.3.2. By Testing Services

        9.3.3. By Indication

        9.3.4. By End User

    9.4. Key Takeaways

10. Latin America Market Analysis 2019 to 2023 and Forecast 2024 to 2034, By Country

    10.1. Historical Market Size Value (US$ Million) Trend Analysis By Market Taxonomy, 2019 to 2023

    10.2. Market Size Value (US$ Million) Forecast By Market Taxonomy, 2024 to 2034

        10.2.1. By Country

            10.2.1.1. Brazil

            10.2.1.2. Mexico

            10.2.1.3. Rest of Latin America

        10.2.2. By Testing Services

        10.2.3. By Indication

        10.2.4. By End User

    10.3. Market Attractiveness Analysis

        10.3.1. By Country

        10.3.2. By Testing Services

        10.3.3. By Indication

        10.3.4. By End User

    10.4. Key Takeaways

11. Western Europe Market Analysis 2019 to 2023 and Forecast 2024 to 2034, By Country

    11.1. Historical Market Size Value (US$ Million) Trend Analysis By Market Taxonomy, 2019 to 2023

    11.2. Market Size Value (US$ Million) Forecast By Market Taxonomy, 2024 to 2034

        11.2.1. By Country

            11.2.1.1. Germany

            11.2.1.2. UK

            11.2.1.3. France

            11.2.1.4. Spain

            11.2.1.5. Italy

            11.2.1.6. Rest of Western Europe

        11.2.2. By Testing Services

        11.2.3. By Indication

        11.2.4. By End User

    11.3. Market Attractiveness Analysis

        11.3.1. By Country

        11.3.2. By Testing Services

        11.3.3. By Indication

        11.3.4. By End User

    11.4. Key Takeaways

12. Eastern Europe Market Analysis 2019 to 2023 and Forecast 2024 to 2034, By Country

    12.1. Historical Market Size Value (US$ Million) Trend Analysis By Market Taxonomy, 2019 to 2023

    12.2. Market Size Value (US$ Million) Forecast By Market Taxonomy, 2024 to 2034

        12.2.1. By Country

            12.2.1.1. Poland

            12.2.1.2. Russia

            12.2.1.3. Czech Republic

            12.2.1.4. Romania

            12.2.1.5. Rest of Eastern Europe

        12.2.2. By Testing Services

        12.2.3. By Indication

        12.2.4. By End User

    12.3. Market Attractiveness Analysis

        12.3.1. By Country

        12.3.2. By Testing Services

        12.3.3. By Indication

        12.3.4. By End User

    12.4. Key Takeaways

13. South Asia and Pacific Market Analysis 2019 to 2023 and Forecast 2024 to 2034, By Country

    13.1. Historical Market Size Value (US$ Million) Trend Analysis By Market Taxonomy, 2019 to 2023

    13.2. Market Size Value (US$ Million) Forecast By Market Taxonomy, 2024 to 2034

        13.2.1. By Country

            13.2.1.1. India

            13.2.1.2. Bangladesh

            13.2.1.3. Australia

            13.2.1.4. New Zealand

            13.2.1.5. Rest of South Asia and Pacific

        13.2.2. By Testing Services

        13.2.3. By Indication

        13.2.4. By End User

    13.3. Market Attractiveness Analysis

        13.3.1. By Country

        13.3.2. By Testing Services

        13.3.3. By Indication

        13.3.4. By End User

    13.4. Key Takeaways

14. East Asia Market Analysis 2019 to 2023 and Forecast 2024 to 2034, By Country

    14.1. Historical Market Size Value (US$ Million) Trend Analysis By Market Taxonomy, 2019 to 2023

    14.2. Market Size Value (US$ Million) Forecast By Market Taxonomy, 2024 to 2034

        14.2.1. By Country

            14.2.1.1. China

            14.2.1.2. Japan

            14.2.1.3. South Korea

        14.2.2. By Testing Services

        14.2.3. By Indication

        14.2.4. By End User

    14.3. Market Attractiveness Analysis

        14.3.1. By Country

        14.3.2. By Testing Services

        14.3.3. By Indication

        14.3.4. By End User

    14.4. Key Takeaways

15. Middle East and Africa Market Analysis 2019 to 2023 and Forecast 2024 to 2034, By Country

    15.1. Historical Market Size Value (US$ Million) Trend Analysis By Market Taxonomy, 2019 to 2023

    15.2. Market Size Value (US$ Million) Forecast By Market Taxonomy, 2024 to 2034

        15.2.1. By Country

            15.2.1.1. GCC Countries

            15.2.1.2. South Africa

            15.2.1.3. Israel

            15.2.1.4. Rest of MEA

        15.2.2. By Testing Services

        15.2.3. By Indication

        15.2.4. By End User

    15.3. Market Attractiveness Analysis

        15.3.1. By Country

        15.3.2. By Testing Services

        15.3.3. By Indication

        15.3.4. By End User

    15.4. Key Takeaways

16. Key Countries Market Analysis

    16.1. USA

        16.1.1. Market Share Analysis, 2023

            16.1.1.1. By Testing Services

            16.1.1.2. By Indication

            16.1.1.3. By End User

    16.2. Canada

        16.2.1. Market Share Analysis, 2023

            16.2.1.1. By Testing Services

            16.2.1.2. By Indication

            16.2.1.3. By End User

    16.3. Brazil

        16.3.1. Market Share Analysis, 2023

            16.3.1.1. By Testing Services

            16.3.1.2. By Indication

            16.3.1.3. By End User

    16.4. Mexico

        16.4.1. Market Share Analysis, 2023

            16.4.1.1. By Testing Services

            16.4.1.2. By Indication

            16.4.1.3. By End User

    16.5. Germany

        16.5.1. Market Share Analysis, 2023

            16.5.1.1. By Testing Services

            16.5.1.2. By Indication

            16.5.1.3. By End User

    16.6. UK

        16.6.1. Market Share Analysis, 2023

            16.6.1.1. By Testing Services

            16.6.1.2. By Indication

            16.6.1.3. By End User

    16.7. France

        16.7.1. Market Share Analysis, 2023

            16.7.1.1. By Testing Services

            16.7.1.2. By Indication

            16.7.1.3. By End User

    16.8. Spain

        16.8.1. Market Share Analysis, 2023

            16.8.1.1. By Testing Services

            16.8.1.2. By Indication

            16.8.1.3. By End User

    16.9. Italy

        16.9.1. Market Share Analysis, 2023

            16.9.1.1. By Testing Services

            16.9.1.2. By Indication

            16.9.1.3. By End User

    16.10. Poland

        16.10.1. Market Share Analysis, 2023

            16.10.1.1. By Testing Services

            16.10.1.2. By Indication

            16.10.1.3. By End User

    16.11. Russia

        16.11.1. Market Share Analysis, 2023

            16.11.1.1. By Testing Services

            16.11.1.2. By Indication

            16.11.1.3. By End User

    16.12. Czech Republic

        16.12.1. Market Share Analysis, 2023

            16.12.1.1. By Testing Services

            16.12.1.2. By Indication

            16.12.1.3. By End User

    16.13. Romania

        16.13.1. Market Share Analysis, 2023

            16.13.1.1. By Testing Services

            16.13.1.2. By Indication

            16.13.1.3. By End User

    16.14. India

        16.14.1. Market Share Analysis, 2023

            16.14.1.1. By Testing Services

            16.14.1.2. By Indication

            16.14.1.3. By End User

    16.15. Bangladesh

        16.15.1. Market Share Analysis, 2023

            16.15.1.1. By Testing Services

            16.15.1.2. By Indication

            16.15.1.3. By End User

    16.16. Australia

        16.16.1. Market Share Analysis, 2023

            16.16.1.1. By Testing Services

            16.16.1.2. By Indication

            16.16.1.3. By End User

    16.17. New Zealand

        16.17.1. Market Share Analysis, 2023

            16.17.1.1. By Testing Services

            16.17.1.2. By Indication

            16.17.1.3. By End User

    16.18. China

        16.18.1. Market Share Analysis, 2023

            16.18.1.1. By Testing Services

            16.18.1.2. By Indication

            16.18.1.3. By End User

    16.19. Japan

        16.19.1. Market Share Analysis, 2023

            16.19.1.1. By Testing Services

            16.19.1.2. By Indication

            16.19.1.3. By End User

    16.20. South Korea

        16.20.1. Market Share Analysis, 2023

            16.20.1.1. By Testing Services

            16.20.1.2. By Indication

            16.20.1.3. By End User

    16.21. GCC Countries

        16.21.1. Market Share Analysis, 2023

            16.21.1.1. By Testing Services

            16.21.1.2. By Indication

            16.21.1.3. By End User

    16.22. South Africa

        16.22.1. Market Share Analysis, 2023

            16.22.1.1. By Testing Services

            16.22.1.2. By Indication

            16.22.1.3. By End User

    16.23. Israel

        16.23.1. Market Share Analysis, 2023

            16.23.1.1. By Testing Services

            16.23.1.2. By Indication

            16.23.1.3. By End User

17. Market Structure Analysis

    17.1. Competition Dashboard

    17.2. Competition Benchmarking

    17.3. Market Share Analysis of Top Players

        17.3.1. By Regional

        17.3.2. By Testing Services

        17.3.3. By Indication

        17.3.4. By End User

18. Competition Analysis

    18.1. Competition Deep Dive

        18.1.1. Circle Health Group

            18.1.1.1. Overview

            18.1.1.2. Product Portfolio

            18.1.1.3. Profitability by Market Segments

            18.1.1.4. Sales Footprint

            18.1.1.5. Strategy Overview

                18.1.1.5.1. Marketing Strategy

        18.1.2. Cleveland Clinic

            18.1.2.1. Overview

            18.1.2.2. Product Portfolio

            18.1.2.3. Profitability by Market Segments

            18.1.2.4. Sales Footprint

            18.1.2.5. Strategy Overview

                18.1.2.5.1. Marketing Strategy

        18.1.3. USA Sleep Diagnostic

            18.1.3.1. Overview

            18.1.3.2. Product Portfolio

            18.1.3.3. Profitability by Market Segments

            18.1.3.4. Sales Footprint

            18.1.3.5. Strategy Overview

                18.1.3.5.1. Marketing Strategy

        18.1.4. Imperial College Healthcare NHS Trust

            18.1.4.1. Overview

            18.1.4.2. Product Portfolio

            18.1.4.3. Profitability by Market Segments

            18.1.4.4. Sales Footprint

            18.1.4.5. Strategy Overview

                18.1.4.5.1. Marketing Strategy

        18.1.5. Interdisciplinary Center of Sleep Medicine

            18.1.5.1. Overview

            18.1.5.2. Product Portfolio

            18.1.5.3. Profitability by Market Segments

            18.1.5.4. Sales Footprint

            18.1.5.5. Strategy Overview

                18.1.5.5.1. Marketing Strategy

        18.1.6. International Institute of Sleep

            18.1.6.1. Overview

            18.1.6.2. Product Portfolio

            18.1.6.3. Profitability by Market Segments

            18.1.6.4. Sales Footprint

            18.1.6.5. Strategy Overview

                18.1.6.5.1. Marketing Strategy

        18.1.7. Koninklijke Philips N.V.

            18.1.7.1. Overview

            18.1.7.2. Product Portfolio

            18.1.7.3. Profitability by Market Segments

            18.1.7.4. Sales Footprint

            18.1.7.5. Strategy Overview

                18.1.7.5.1. Marketing Strategy

        18.1.8. Korea University Medicine

            18.1.8.1. Overview

            18.1.8.2. Product Portfolio

            18.1.8.3. Profitability by Market Segments

            18.1.8.4. Sales Footprint

            18.1.8.5. Strategy Overview

                18.1.8.5.1. Marketing Strategy

        18.1.9. London Sleep Centre

            18.1.9.1. Overview

            18.1.9.2. Product Portfolio

            18.1.9.3. Profitability by Market Segments

            18.1.9.4. Sales Footprint

            18.1.9.5. Strategy Overview

                18.1.9.5.1. Marketing Strategy

        18.1.10. MedStar Health

            18.1.10.1. Overview

            18.1.10.2. Product Portfolio

            18.1.10.3. Profitability by Market Segments

            18.1.10.4. Sales Footprint

            18.1.10.5. Strategy Overview

                18.1.10.5.1. Marketing Strategy

        18.1.11. Millennium Sleep Lab

            18.1.11.1. Overview

            18.1.11.2. Product Portfolio

            18.1.11.3. Profitability by Market Segments

            18.1.11.4. Sales Footprint

            18.1.11.5. Strategy Overview

                18.1.11.5.1. Marketing Strategy

19. Assumptions & Acronyms Used

20. Research Methodology

Don't pay for what you don't need

Customize your report by selecting specific countries or regions and save 30%!

List of Tables

Table 1: Global Market Value (US$ Million) Forecast by Region, 2019 to 2034

Table 2: Global Market Value (US$ Million) Forecast by Testing Services, 2019 to 2034

Table 3: Global Market Value (US$ Million) Forecast by Indication, 2019 to 2034

Table 4: Global Market Value (US$ Million) Forecast by End User, 2019 to 2034

Table 5: North America Market Value (US$ Million) Forecast by Country, 2019 to 2034

Table 6: North America Market Value (US$ Million) Forecast by Testing Services, 2019 to 2034

Table 7: North America Market Value (US$ Million) Forecast by Indication, 2019 to 2034

Table 8: North America Market Value (US$ Million) Forecast by End User, 2019 to 2034

Table 9: Latin America Market Value (US$ Million) Forecast by Country, 2019 to 2034

Table 10: Latin America Market Value (US$ Million) Forecast by Testing Services, 2019 to 2034

Table 11: Latin America Market Value (US$ Million) Forecast by Indication, 2019 to 2034

Table 12: Latin America Market Value (US$ Million) Forecast by End User, 2019 to 2034

Table 13: Western Europe Market Value (US$ Million) Forecast by Country, 2019 to 2034

Table 14: Western Europe Market Value (US$ Million) Forecast by Testing Services, 2019 to 2034

Table 15: Western Europe Market Value (US$ Million) Forecast by Indication, 2019 to 2034

Table 16: Western Europe Market Value (US$ Million) Forecast by End User, 2019 to 2034

Table 17: Eastern Europe Market Value (US$ Million) Forecast by Country, 2019 to 2034

Table 18: Eastern Europe Market Value (US$ Million) Forecast by Testing Services, 2019 to 2034

Table 19: Eastern Europe Market Value (US$ Million) Forecast by Indication, 2019 to 2034

Table 20: Eastern Europe Market Value (US$ Million) Forecast by End User, 2019 to 2034

Table 21: South Asia and Pacific Market Value (US$ Million) Forecast by Country, 2019 to 2034

Table 22: South Asia and Pacific Market Value (US$ Million) Forecast by Testing Services, 2019 to 2034

Table 23: South Asia and Pacific Market Value (US$ Million) Forecast by Indication, 2019 to 2034

Table 24: South Asia and Pacific Market Value (US$ Million) Forecast by End User, 2019 to 2034

Table 25: East Asia Market Value (US$ Million) Forecast by Country, 2019 to 2034

Table 26: East Asia Market Value (US$ Million) Forecast by Testing Services, 2019 to 2034

Table 27: East Asia Market Value (US$ Million) Forecast by Indication, 2019 to 2034

Table 28: East Asia Market Value (US$ Million) Forecast by End User, 2019 to 2034

Table 29: Middle East and Africa Market Value (US$ Million) Forecast by Country, 2019 to 2034

Table 30: Middle East and Africa Market Value (US$ Million) Forecast by Testing Services, 2019 to 2034

Table 31: Middle East and Africa Market Value (US$ Million) Forecast by Indication, 2019 to 2034

Table 32: Middle East and Africa Market Value (US$ Million) Forecast by End User, 2019 to 2034
Sabyasachi Ghosh
Sabyasachi Ghosh

Principal Consultant

Talk to Analyst

Find your sweet spots for generating winning opportunities in this market.

List of Charts

Figure 1: Global Market Value (US$ Million) by Testing Services, 2024 to 2034

Figure 2: Global Market Value (US$ Million) by Indication, 2024 to 2034

Figure 3: Global Market Value (US$ Million) by End User, 2024 to 2034

Figure 4: Global Market Value (US$ Million) by Region, 2024 to 2034

Figure 5: Global Market Value (US$ Million) Analysis by Region, 2019 to 2034

Figure 6: Global Market Value Share (%) and BPS Analysis by Region, 2024 to 2034

Figure 7: Global Market Y-o-Y Growth (%) Projections by Region, 2024 to 2034

Figure 8: Global Market Value (US$ Million) Analysis by Testing Services, 2019 to 2034

Figure 9: Global Market Value Share (%) and BPS Analysis by Testing Services, 2024 to 2034

Figure 10: Global Market Y-o-Y Growth (%) Projections by Testing Services, 2024 to 2034

Figure 11: Global Market Value (US$ Million) Analysis by Indication, 2019 to 2034

Figure 12: Global Market Value Share (%) and BPS Analysis by Indication, 2024 to 2034

Figure 13: Global Market Y-o-Y Growth (%) Projections by Indication, 2024 to 2034

Figure 14: Global Market Value (US$ Million) Analysis by End User, 2019 to 2034

Figure 15: Global Market Value Share (%) and BPS Analysis by End User, 2024 to 2034

Figure 16: Global Market Y-o-Y Growth (%) Projections by End User, 2024 to 2034

Figure 17: Global Market Attractiveness by Testing Services, 2024 to 2034

Figure 18: Global Market Attractiveness by Indication, 2024 to 2034

Figure 19: Global Market Attractiveness by End User, 2024 to 2034

Figure 20: Global Market Attractiveness by Region, 2024 to 2034

Figure 21: North America Market Value (US$ Million) by Testing Services, 2024 to 2034

Figure 22: North America Market Value (US$ Million) by Indication, 2024 to 2034

Figure 23: North America Market Value (US$ Million) by End User, 2024 to 2034

Figure 24: North America Market Value (US$ Million) by Country, 2024 to 2034

Figure 25: North America Market Value (US$ Million) Analysis by Country, 2019 to 2034

Figure 26: North America Market Value Share (%) and BPS Analysis by Country, 2024 to 2034

Figure 27: North America Market Y-o-Y Growth (%) Projections by Country, 2024 to 2034

Figure 28: North America Market Value (US$ Million) Analysis by Testing Services, 2019 to 2034

Figure 29: North America Market Value Share (%) and BPS Analysis by Testing Services, 2024 to 2034

Figure 30: North America Market Y-o-Y Growth (%) Projections by Testing Services, 2024 to 2034

Figure 31: North America Market Value (US$ Million) Analysis by Indication, 2019 to 2034

Figure 32: North America Market Value Share (%) and BPS Analysis by Indication, 2024 to 2034

Figure 33: North America Market Y-o-Y Growth (%) Projections by Indication, 2024 to 2034

Figure 34: North America Market Value (US$ Million) Analysis by End User, 2019 to 2034

Figure 35: North America Market Value Share (%) and BPS Analysis by End User, 2024 to 2034

Figure 36: North America Market Y-o-Y Growth (%) Projections by End User, 2024 to 2034

Figure 37: North America Market Attractiveness by Testing Services, 2024 to 2034

Figure 38: North America Market Attractiveness by Indication, 2024 to 2034

Figure 39: North America Market Attractiveness by End User, 2024 to 2034

Figure 40: North America Market Attractiveness by Country, 2024 to 2034

Figure 41: Latin America Market Value (US$ Million) by Testing Services, 2024 to 2034

Figure 42: Latin America Market Value (US$ Million) by Indication, 2024 to 2034

Figure 43: Latin America Market Value (US$ Million) by End User, 2024 to 2034

Figure 44: Latin America Market Value (US$ Million) by Country, 2024 to 2034

Figure 45: Latin America Market Value (US$ Million) Analysis by Country, 2019 to 2034

Figure 46: Latin America Market Value Share (%) and BPS Analysis by Country, 2024 to 2034

Figure 47: Latin America Market Y-o-Y Growth (%) Projections by Country, 2024 to 2034

Figure 48: Latin America Market Value (US$ Million) Analysis by Testing Services, 2019 to 2034

Figure 49: Latin America Market Value Share (%) and BPS Analysis by Testing Services, 2024 to 2034

Figure 50: Latin America Market Y-o-Y Growth (%) Projections by Testing Services, 2024 to 2034

Figure 51: Latin America Market Value (US$ Million) Analysis by Indication, 2019 to 2034

Figure 52: Latin America Market Value Share (%) and BPS Analysis by Indication, 2024 to 2034

Figure 53: Latin America Market Y-o-Y Growth (%) Projections by Indication, 2024 to 2034

Figure 54: Latin America Market Value (US$ Million) Analysis by End User, 2019 to 2034

Figure 55: Latin America Market Value Share (%) and BPS Analysis by End User, 2024 to 2034

Figure 56: Latin America Market Y-o-Y Growth (%) Projections by End User, 2024 to 2034

Figure 57: Latin America Market Attractiveness by Testing Services, 2024 to 2034

Figure 58: Latin America Market Attractiveness by Indication, 2024 to 2034

Figure 59: Latin America Market Attractiveness by End User, 2024 to 2034

Figure 60: Latin America Market Attractiveness by Country, 2024 to 2034

Figure 61: Western Europe Market Value (US$ Million) by Testing Services, 2024 to 2034

Figure 62: Western Europe Market Value (US$ Million) by Indication, 2024 to 2034

Figure 63: Western Europe Market Value (US$ Million) by End User, 2024 to 2034

Figure 64: Western Europe Market Value (US$ Million) by Country, 2024 to 2034

Figure 65: Western Europe Market Value (US$ Million) Analysis by Country, 2019 to 2034

Figure 66: Western Europe Market Value Share (%) and BPS Analysis by Country, 2024 to 2034

Figure 67: Western Europe Market Y-o-Y Growth (%) Projections by Country, 2024 to 2034

Figure 68: Western Europe Market Value (US$ Million) Analysis by Testing Services, 2019 to 2034

Figure 69: Western Europe Market Value Share (%) and BPS Analysis by Testing Services, 2024 to 2034

Figure 70: Western Europe Market Y-o-Y Growth (%) Projections by Testing Services, 2024 to 2034

Figure 71: Western Europe Market Value (US$ Million) Analysis by Indication, 2019 to 2034

Figure 72: Western Europe Market Value Share (%) and BPS Analysis by Indication, 2024 to 2034

Figure 73: Western Europe Market Y-o-Y Growth (%) Projections by Indication, 2024 to 2034

Figure 74: Western Europe Market Value (US$ Million) Analysis by End User, 2019 to 2034

Figure 75: Western Europe Market Value Share (%) and BPS Analysis by End User, 2024 to 2034

Figure 76: Western Europe Market Y-o-Y Growth (%) Projections by End User, 2024 to 2034

Figure 77: Western Europe Market Attractiveness by Testing Services, 2024 to 2034

Figure 78: Western Europe Market Attractiveness by Indication, 2024 to 2034

Figure 79: Western Europe Market Attractiveness by End User, 2024 to 2034

Figure 80: Western Europe Market Attractiveness by Country, 2024 to 2034

Figure 81: Eastern Europe Market Value (US$ Million) by Testing Services, 2024 to 2034

Figure 82: Eastern Europe Market Value (US$ Million) by Indication, 2024 to 2034

Figure 83: Eastern Europe Market Value (US$ Million) by End User, 2024 to 2034

Figure 84: Eastern Europe Market Value (US$ Million) by Country, 2024 to 2034

Figure 85: Eastern Europe Market Value (US$ Million) Analysis by Country, 2019 to 2034

Figure 86: Eastern Europe Market Value Share (%) and BPS Analysis by Country, 2024 to 2034

Figure 87: Eastern Europe Market Y-o-Y Growth (%) Projections by Country, 2024 to 2034

Figure 88: Eastern Europe Market Value (US$ Million) Analysis by Testing Services, 2019 to 2034

Figure 89: Eastern Europe Market Value Share (%) and BPS Analysis by Testing Services, 2024 to 2034

Figure 90: Eastern Europe Market Y-o-Y Growth (%) Projections by Testing Services, 2024 to 2034

Figure 91: Eastern Europe Market Value (US$ Million) Analysis by Indication, 2019 to 2034

Figure 92: Eastern Europe Market Value Share (%) and BPS Analysis by Indication, 2024 to 2034

Figure 93: Eastern Europe Market Y-o-Y Growth (%) Projections by Indication, 2024 to 2034

Figure 94: Eastern Europe Market Value (US$ Million) Analysis by End User, 2019 to 2034

Figure 95: Eastern Europe Market Value Share (%) and BPS Analysis by End User, 2024 to 2034

Figure 96: Eastern Europe Market Y-o-Y Growth (%) Projections by End User, 2024 to 2034

Figure 97: Eastern Europe Market Attractiveness by Testing Services, 2024 to 2034

Figure 98: Eastern Europe Market Attractiveness by Indication, 2024 to 2034

Figure 99: Eastern Europe Market Attractiveness by End User, 2024 to 2034

Figure 100: Eastern Europe Market Attractiveness by Country, 2024 to 2034

Figure 101: South Asia and Pacific Market Value (US$ Million) by Testing Services, 2024 to 2034

Figure 102: South Asia and Pacific Market Value (US$ Million) by Indication, 2024 to 2034

Figure 103: South Asia and Pacific Market Value (US$ Million) by End User, 2024 to 2034

Figure 104: South Asia and Pacific Market Value (US$ Million) by Country, 2024 to 2034

Figure 105: South Asia and Pacific Market Value (US$ Million) Analysis by Country, 2019 to 2034

Figure 106: South Asia and Pacific Market Value Share (%) and BPS Analysis by Country, 2024 to 2034

Figure 107: South Asia and Pacific Market Y-o-Y Growth (%) Projections by Country, 2024 to 2034

Figure 108: South Asia and Pacific Market Value (US$ Million) Analysis by Testing Services, 2019 to 2034

Figure 109: South Asia and Pacific Market Value Share (%) and BPS Analysis by Testing Services, 2024 to 2034

Figure 110: South Asia and Pacific Market Y-o-Y Growth (%) Projections by Testing Services, 2024 to 2034

Figure 111: South Asia and Pacific Market Value (US$ Million) Analysis by Indication, 2019 to 2034

Figure 112: South Asia and Pacific Market Value Share (%) and BPS Analysis by Indication, 2024 to 2034

Figure 113: South Asia and Pacific Market Y-o-Y Growth (%) Projections by Indication, 2024 to 2034

Figure 114: South Asia and Pacific Market Value (US$ Million) Analysis by End User, 2019 to 2034

Figure 115: South Asia and Pacific Market Value Share (%) and BPS Analysis by End User, 2024 to 2034

Figure 116: South Asia and Pacific Market Y-o-Y Growth (%) Projections by End User, 2024 to 2034

Figure 117: South Asia and Pacific Market Attractiveness by Testing Services, 2024 to 2034

Figure 118: South Asia and Pacific Market Attractiveness by Indication, 2024 to 2034

Figure 119: South Asia and Pacific Market Attractiveness by End User, 2024 to 2034

Figure 120: South Asia and Pacific Market Attractiveness by Country, 2024 to 2034

Figure 121: East Asia Market Value (US$ Million) by Testing Services, 2024 to 2034

Figure 122: East Asia Market Value (US$ Million) by Indication, 2024 to 2034

Figure 123: East Asia Market Value (US$ Million) by End User, 2024 to 2034

Figure 124: East Asia Market Value (US$ Million) by Country, 2024 to 2034

Figure 125: East Asia Market Value (US$ Million) Analysis by Country, 2019 to 2034

Figure 126: East Asia Market Value Share (%) and BPS Analysis by Country, 2024 to 2034

Figure 127: East Asia Market Y-o-Y Growth (%) Projections by Country, 2024 to 2034

Figure 128: East Asia Market Value (US$ Million) Analysis by Testing Services, 2019 to 2034

Figure 129: East Asia Market Value Share (%) and BPS Analysis by Testing Services, 2024 to 2034

Figure 130: East Asia Market Y-o-Y Growth (%) Projections by Testing Services, 2024 to 2034

Figure 131: East Asia Market Value (US$ Million) Analysis by Indication, 2019 to 2034

Figure 132: East Asia Market Value Share (%) and BPS Analysis by Indication, 2024 to 2034

Figure 133: East Asia Market Y-o-Y Growth (%) Projections by Indication, 2024 to 2034

Figure 134: East Asia Market Value (US$ Million) Analysis by End User, 2019 to 2034

Figure 135: East Asia Market Value Share (%) and BPS Analysis by End User, 2024 to 2034

Figure 136: East Asia Market Y-o-Y Growth (%) Projections by End User, 2024 to 2034

Figure 137: East Asia Market Attractiveness by Testing Services, 2024 to 2034

Figure 138: East Asia Market Attractiveness by Indication, 2024 to 2034

Figure 139: East Asia Market Attractiveness by End User, 2024 to 2034

Figure 140: East Asia Market Attractiveness by Country, 2024 to 2034

Figure 141: Middle East and Africa Market Value (US$ Million) by Testing Services, 2024 to 2034

Figure 142: Middle East and Africa Market Value (US$ Million) by Indication, 2024 to 2034

Figure 143: Middle East and Africa Market Value (US$ Million) by End User, 2024 to 2034

Figure 144: Middle East and Africa Market Value (US$ Million) by Country, 2024 to 2034

Figure 145: Middle East and Africa Market Value (US$ Million) Analysis by Country, 2019 to 2034

Figure 146: Middle East and Africa Market Value Share (%) and BPS Analysis by Country, 2024 to 2034

Figure 147: Middle East and Africa Market Y-o-Y Growth (%) Projections by Country, 2024 to 2034

Figure 148: Middle East and Africa Market Value (US$ Million) Analysis by Testing Services, 2019 to 2034

Figure 149: Middle East and Africa Market Value Share (%) and BPS Analysis by Testing Services, 2024 to 2034

Figure 150: Middle East and Africa Market Y-o-Y Growth (%) Projections by Testing Services, 2024 to 2034

Figure 151: Middle East and Africa Market Value (US$ Million) Analysis by Indication, 2019 to 2034

Figure 152: Middle East and Africa Market Value Share (%) and BPS Analysis by Indication, 2024 to 2034

Figure 153: Middle East and Africa Market Y-o-Y Growth (%) Projections by Indication, 2024 to 2034

Figure 154: Middle East and Africa Market Value (US$ Million) Analysis by End User, 2019 to 2034

Figure 155: Middle East and Africa Market Value Share (%) and BPS Analysis by End User, 2024 to 2034

Figure 156: Middle East and Africa Market Y-o-Y Growth (%) Projections by End User, 2024 to 2034

Figure 157: Middle East and Africa Market Attractiveness by Testing Services, 2024 to 2034

Figure 158: Middle East and Africa Market Attractiveness by Indication, 2024 to 2034

Figure 159: Middle East and Africa Market Attractiveness by End User, 2024 to 2034

Figure 160: Middle East and Africa Market Attractiveness by Country, 2024 to 2034

Recommendations

Healthcare

Sleep Apnea Diagnostic Systems Market

Published : June 2023

Healthcare

Sleep Apnea Devices Market

Published : February 2023

Explore Healthcare Insights

View Reports