The global sleep apnea devices market is estimated to be valued at USD 9.7 billion in 2025 and is projected to reach USD 24.4 billion by 2035, registering a compound annual growth rate of 9.7% over the forecast period.
| Metric | Value |
|---|---|
| Market Size in 2025 | USD 9.7 billion |
| Projected Market Size in 2035 | USD 24.4 billion |
| CAGR (2025 to 2035) | 9.7% |
The sleep apnea devices market is witnessing robust growth driven by rising awareness of sleep disorders, technological advancements in diagnostic and therapeutic equipment, and an increase in lifestyle-related risk factors like obesity and aging. Improved healthcare infrastructure and favorable reimbursement policies are further supporting device adoption across key regions.
Innovations such as AI-integrated diagnostics and portable therapy systems are reshaping patient care by enabling home-based management and improving compliance. The industry is also benefiting from strategic alliances among device manufacturers and healthcare providers, fostering faster product development and market penetration. With a growing emphasis on personalized treatment and early diagnosis, the market is poised for sustained growth, underpinned by evolving patient needs and continuous product innovation.
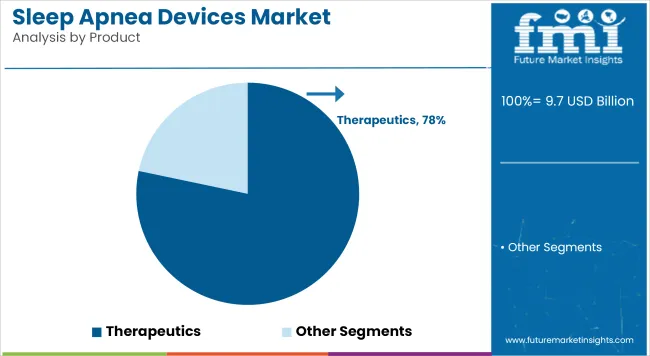
The dominance of therapeutic devices, accounting for 78.3% of the market revenue in 2025, has been primarily attributed to their essential role in managing moderate to severe obstructive sleep apnea. The growth of this segment has been supported by widespread clinical endorsement of devices such as CPAP, BiPAP, and APAP systems, which are recognized for their non-invasive nature and high efficacy in maintaining airway patency during sleep.
Greater awareness of untreated sleep apnea risks such as cardiovascular disease and daytime fatigue has prompted physicians to recommend long-term therapeutic intervention. In addition, technological advancements including Bluetooth-enabled monitoring, auto-adjustable pressure settings, and compact, travel-friendly units have significantly improved patient compliance.
Continuous support from healthcare professionals and positive patient outcomes have further validated the reliability of therapeutic devices, leading to broader insurance coverage and increased adoption. As a result, the segment has remained the first-line management tool in clinical and home settings alike.

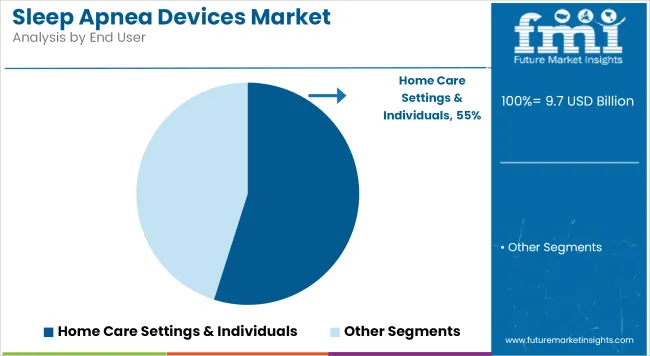
Home care settings and individual users are projected to hold 54.9% of the revenue share in 2025, driven by a strong shift in consumer preference toward convenience and privacy in managing chronic sleep disorders. The increasing availability of compact, user-friendly sleep apnea devices has enabled patients to receive treatment outside traditional clinical settings.
This trend has been reinforced by growing awareness about sleep health, rising healthcare costs, and prolonged wait times in sleep labs. In addition, integration of digital health technologies, such as remote monitoring apps and cloud-based compliance tracking, has supported real-time physician feedback while enabling patients to manage their therapy independently.
Favorable reimbursement frameworks in key markets and the expansion of home healthcare services have also contributed to this transition. As more patients seek personalized, accessible, and comfortable treatment pathways, the home care segment has been solidified as the preferred end-use environment for sleep apnea device deployment.

Challenges: Low Rates of Diagnosis, Low Costs, and Compliance with Devices
Poor compliance by patients with CPAP treatment because, for patients, the treatment is unpleasant or punitive in nature forms the sleep apnea devices market's biggest entry barrier currently. The technology of advanced sleep apnea devices is also a barrier, especially among the developing nations. Inadequate diagnosis for sleep apnea is another huge discourager given how many people are not aware that they even suffer from sleep apnea as polysomnography tests and sleep studies are out of reach.
Opportunities: Wearable Sleep Technology, AI-Driven Diagnostics, and Personalized Therapy
All the above notwithstanding, the sleep apnea devices market is sizable enough to expand. Sleep-tracking devices, such as wireless sensors and smart rings, are increasingly being utilized as less invasive sleep disorder diagnostics.
Artificial intelligence-based diagnostic technology is revolutionizing sleep research by allowing real-time analysis and apnea event detection through automated means. Besides, improvements in individualized treatment, such as mandibular advancement devices and auto-adjusting CPAP machines with personalized parameters, are boosting patient compliance and the success of treatment.
The sleep apnea devices market of the USA is increasing at a stupendous pace with increasing cases of obesity, which happens to be the leading causative condition for sleep apnea. Increasing cases of other sleep diseases like obstructive sleep apnea (OSA) have also seen a surge in incidence rates, triggering a surge in the need for therapies.
Increased insurance cover accessibility of CPAP and BiPAP devices further propelled them into larger user bases of patients, augmenting the market further. Further advancements in artificial intelligence (AI) technology have made it possible to develop in-home diagnostic equipment for remote sleep monitoring. The technology is transforming patient care by the convenience of real-time sleeping pattern feedback, which has led to an increasing number of individuals being diagnosed and treated.
| Country | CAGR (2025 to 2035) |
|---|---|
| USA | 9.5% |
In the UK, the National Health Service (NHS) is also growing its sleep apnea machine market, as it is also generating interest in its early treatment and detection. Add sleep apnea screening to its core primary care service, it is making increasingly more people identify and treat them at the right time. Moreover, sleep watch usage is also picking up pace, as well as increasing awareness about sleeping disorders too.
AI-based diagnostic software is becoming the go-to target when it comes to accuracy and speed and thus enabling home monitoring. Technology such as that and further focus on prevention care is transforming the market and more patients proceeding to receive treatment for sleep apnea successfully.
| Country | CAGR (2025 to 2035) |
|---|---|
| UK | 9.9% |
Europe sleep apnea devices market is expanding at a very rapid pace due to huge investment in healthcare infrastructure, especially in top countries such as Germany, France, and the Netherlands. Hospital upgradation and new healthcare technology have created space for proper diagnosis and treatment of sleep apnea.
The trend in the region is employing in-home sleep test kits that are more convenient and cheaper in diagnosis. There has been a growing request from the patients for non-invasive therapy treatment of therapy in the form of oral appliances as well as state-of-the-art CPAP machines to make the treatment process comfortable and convenient for the patient.
| Region | CAGR (2025 to 2035) |
|---|---|
| European Union (EU) | 9.2% |
Japanese sleep apnea devices market is fueled by its fast-developing, aged population, thereby increasing demand for sophisticated sleep disorders treatment. Senior citizens are very susceptible to fall under the danger of sleep apnea, and there is increased demand for noiseless and discreet CPAP equipment.
Japan's companies are also investing in creative solutions, including ergonomic oral appliance therapy for older patients who can find traditional CPAP machines too bulky to endure. It is all this attention to patient comfort, ease of use, and increased treatment compliance that is propelling the innovation, enabling more individuals to effectively manage their sleep apnea and flourish.
| Country | CAGR (2025 to 2035) |
|---|---|
| Japan | 9.8% |
The South Korean sleep apnea devices market is expanding because the nation has a high technology culture. AI sleep testing and smart pillows with integrated sensors are becoming popular because they are generating more data-based and precise information about sleep health.
Home-based treatment is also increasingly fueling the market growth as increasingly individuals are choosing to avail themselves of the ease and efficacy of home treatment processes. South Korea's technology-led approach is leading the way in non-invasive and wearable sleep monitoring technology, making sleep apnea therapy closer and more accessible to more patients nationwide.
| Country | CAGR (2025 to 2035) |
|---|---|
| South Korea | 9.4% |
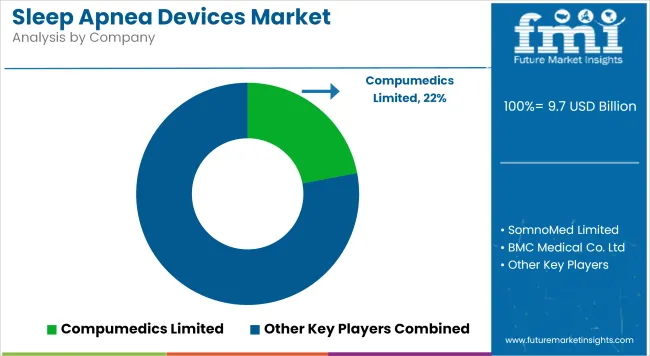
The Sleep Apnea Devices Market is characterized by intense competition, driven by rapid technological innovation, strategic product launches, and increasing focus on patient-centric care. Market players are investing heavily in R&D to develop advanced, compact, and AI-enabled devices that offer real-time monitoring and improved user compliance.
Emphasis is being placed on integrating wireless connectivity and cloud-based platforms to enhance remote patient management. Partnerships with telehealth providers and sleep clinics are being pursued to expand service reach and strengthen patient engagement. Regulatory approvals and patent filings are being accelerated to secure market positioning.
Key Development

The overall market size for the sleep apnea devices market was USD 9.7 billion in 2025.
The sleep apnea devices market is expected to reach USD 24.4 billion in 2035.
The increasing prevalence of sleep disorders, rising awareness about sleep apnea, technological advancements in diagnostic and therapeutic devices, and growing adoption of home sleep monitoring solutions fuel the sleep apnea devices market during the forecast period.
The top 5 countries which drive the development of the sleep apnea devices market are USA, UK, Germany, China, and Japan.
On the basis of product type, the positive airway pressure (PAP) devices segment to command significant share over the forecast period.


Our Research Products

The "Full Research Suite" delivers actionable market intel, deep dives on markets or technologies, so clients act faster, cut risk, and unlock growth.

The Leaderboard benchmarks and ranks top vendors, classifying them as Established Leaders, Leading Challengers, or Disruptors & Challengers.

Locates where complements amplify value and substitutes erode it, forecasting net impact by horizon

We deliver granular, decision-grade intel: market sizing, 5-year forecasts, pricing, adoption, usage, revenue, and operational KPIs—plus competitor tracking, regulation, and value chains—across 60 countries broadly.

Spot the shifts before they hit your P&L. We track inflection points, adoption curves, pricing moves, and ecosystem plays to show where demand is heading, why it is changing, and what to do next across high-growth markets and disruptive tech

Real-time reads of user behavior. We track shifting priorities, perceptions of today’s and next-gen services, and provider experience, then pace how fast tech moves from trial to adoption, blending buyer, consumer, and channel inputs with social signals (#WhySwitch, #UX).

Partner with our analyst team to build a custom report designed around your business priorities. From analysing market trends to assessing competitors or crafting bespoke datasets, we tailor insights to your needs.
Supplier Intelligence
Discovery & Profiling
Capacity & Footprint
Performance & Risk
Compliance & Governance
Commercial Readiness
Who Supplies Whom
Scorecards & Shortlists
Playbooks & Docs
Category Intelligence
Definition & Scope
Demand & Use Cases
Cost Drivers
Market Structure
Supply Chain Map
Trade & Policy
Operating Norms
Deliverables
Buyer Intelligence
Account Basics
Spend & Scope
Procurement Model
Vendor Requirements
Terms & Policies
Entry Strategy
Pain Points & Triggers
Outputs
Pricing Analysis
Benchmarks
Trends
Should-Cost
Indexation
Landed Cost
Commercial Terms
Deliverables
Brand Analysis
Positioning & Value Prop
Share & Presence
Customer Evidence
Go-to-Market
Digital & Reputation
Compliance & Trust
KPIs & Gaps
Outputs
Full Research Suite comprises of:
Market outlook & trends analysis
Interviews & case studies
Strategic recommendations
Vendor profiles & capabilities analysis
5-year forecasts
8 regions and 60+ country-level data splits
Market segment data splits
12 months of continuous data updates
DELIVERED AS:
PDF EXCEL ONLINE
Sleep Apnea Diagnostic Systems Market Analysis - Size, Share, and Forecast Outlook 2025 to 2035
Sleep Apnea Implants Market Analysis – Size, Share & Forecast 2025-2035
Key Players & Market Share in the Sleep Apnea Implants Industry
Sleep Aid Devices Market Growth – Industry Insights & Forecast 2022-2032
Sleep Screening Devices Market Trends and Forecast 2025 to 2035
Home Sleep Apnea Testing Market Analysis - Size, Share, and Forecast Outlook 2025 to 2035
China Sleep Apnea Diagnostic Systems Market Outlook – Size, Share & Growth 2025-2035
Japan Sleep Apnea Diagnostic Systems Market Report – Size, Demand & Outlook 2025-2035
France Sleep Apnea Diagnostic Systems Market Insights – Size, Share & Demand 2025-2035
Germany Sleep Apnea Diagnostic Systems Market Trends – Growth, Innovations & Forecast 2025-2035
United States Sleep Apnea Diagnostic Systems Market Analysis – Trends & Forecast 2025-2035
Sleeping Bag Market Forecast and Outlook 2025 to 2035
Sleep Study Equipment Market Size and Share Forecast Outlook 2025 to 2035
Sleep Movement Disorders Market Size and Share Forecast Outlook 2025 to 2035
Sleep Supplement Market Size and Share Forecast Outlook 2025 to 2035
Sleep Tracking and Optimization Products Market Size and Share Forecast Outlook 2025 to 2035
Sleep Study Market Analysis – Size, Share, and Forecast Outlook 2025 to 2035
Sleeper Pads Market Size and Share Forecast Outlook 2025 to 2035
Sleep Gummy Market Analysis by Primary Ingredient, Customer Orientation, Pack Size and Product Claim Through 2035
Key Players & Market Share in the Sleeping Bag Industry

Thank you!
You will receive an email from our Business Development Manager. Please be sure to check your SPAM/JUNK folder too.
Chat With
MaRIA