The global sleep apnea diagnostic systems market is projected to grow from USD 4.483 billion in 2025 to USD 6.1 billion by 2035, registering a CAGR of 3.3%. Market revenue stood at USD 4.31 billion in 2024, underscoring consistent demand driven by rising sleep disorder prevalence and improved diagnostic access.
The increasing incidence of obstructive sleep apnea (OSA), especially among aging populations and individuals with obesity or cardiovascular comorbidities, has sustained investment in diagnostic tools. In 2025, actigraphy monitoring devices are estimated to dominate by product type, accounting for 42.4% of market share. Their popularity is attributed to affordability, ease of use in ambulatory settings, and minimal patient disruption.
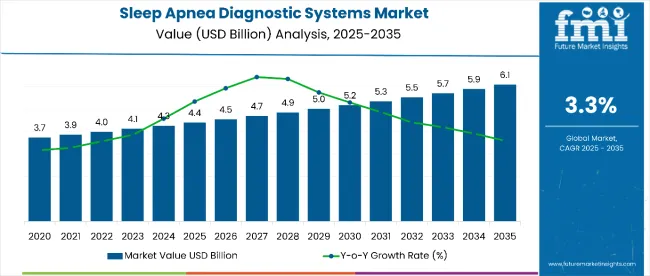
| Attributes | Key Insights |
|---|---|
| Estimated Size, 2025 | USD 4.483 billion |
| Projected Size, 2035 | USD 6.1 billion |
| Value-based CAGR (2025 to 2035) | 3.3% |
Clinically supervised testing continues to dominate in sleep labs and specialized centers. The sleep centers and clinics segment is projected to command a 39.8% share in 2025 by application. These facilities remain the standard for polysomnography, despite growing adoption of portable monitors for home testing.
Manufacturers are enhancing diagnostic accuracy through integration of AI-powered analytics, contactless sensors, and cloud-enabled sleep data tracking. In a 2024 technology briefing, ResMed CEO Mick Farrell emphasized that digital sleep diagnostics are transitioning from hospital-centric to home-centric, redefining the patient journey and data ecosystem.
North America remains the largest regional market, supported by reimbursement policies, clinical awareness, and high screening volumes. However, countries such as India, Brazil, and China are witnessing double-digit growth, propelled by increasing diagnosis rates and public health campaigns. Challenges include underdiagnosis, especially in rural and low-income settings, and limited physician awareness in emerging markets. To overcome this, industry leaders are collaborating with telehealth platforms and home care providers to broaden access.
Technological differentiation-through wireless data integration, AI-enabled scoring algorithms, and miniaturized wearable sensors-is shaping competitive strategies. Companies are focusing on scalable models that reduce patient dropout, accelerate time-to-diagnosis, and ensure data compliance under evolving health tech regulations. With growing global focus on non-invasive, patient-friendly diagnostics, sleep apnea diagnostic systems are expected to see gradual uptake across both clinical and consumer healthcare ecosystems.
Technological innovations are redefining the landscape of sleep apnea diagnostics systems market. The introduction of wearable devices and AI-powered systems are improving the efficiency and accessibility of diagnosis. These innovations are particularly evident in home-based monitoring devices. This shift reflects a larger trend toward personalized healthcare and telemedicine.
With enhanced accuracy, actigraphy devices are predicted to grow rapidly. Their ability to detect sleep disturbances remotely makes them ideal for long-term monitoring, particularly for patients in rural areas.
In the sleep apnea diagnostic systems market, sensors play a foundational role in enabling accurate, non-invasive, and real-time monitoring of respiratory patterns, oxygen saturation, and sleep behavior. These sensors are embedded in wearable devices, bedside monitors, and home-based diagnostic kits, providing critical data to clinicians for diagnosing obstructive, central, or complex sleep apnea.
Advanced biosensors now offer multi-parameter monitoring, capturing airflow, snoring intensity, chest movement, and blood oxygen levels with high sensitivity. Integration with AI algorithms allows for the automatic detection of apnea-hypopnea events, improving diagnostic precision and reducing false positives and enhancing product demand and sales.
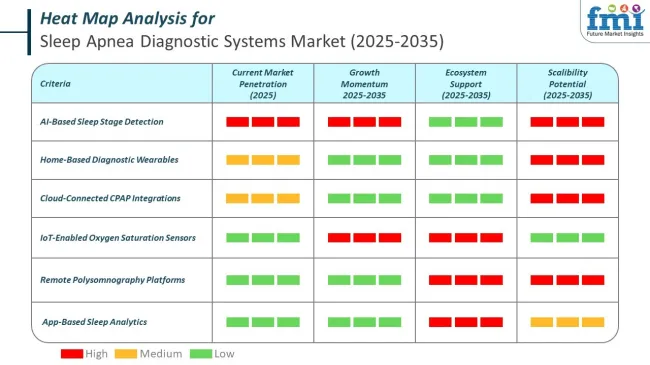
By Product Type, the Actigraphy Monitoring Devices Segment Accounts for 42.4% of the Market Share
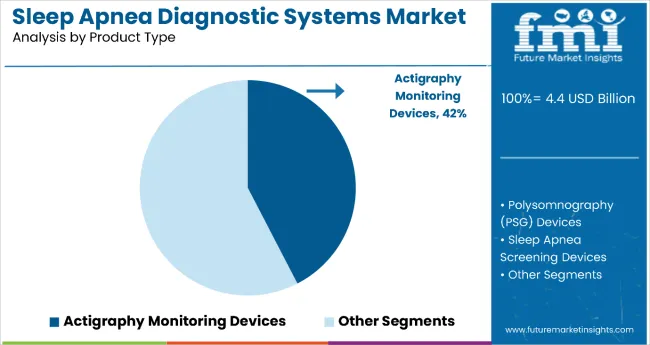
Actigraphy monitoring devices hold the dominant position with 42.4% of the market share in the product type category within the sleep apnea diagnostic systems market. This leadership is driven by actigraphy devices' superior affordability, ease of use in ambulatory settings, and minimal patient disruption compared to more complex diagnostic alternatives.
These non-invasive wearable devices provide continuous monitoring of sleep-wake patterns through movement detection, making them particularly appealing for initial screening and long-term monitoring applications.
The segment's dominance is reinforced by actigraphy devices' compatibility with home-based diagnostic trends and their ability to provide valuable sleep data without the need for specialized sleep laboratory facilities. The growing consumer preference for convenient, portable health monitoring solutions supports sustained demand for actigraphy systems that can be easily integrated into daily routines.
As healthcare systems continue to prioritize cost-effective screening methods and patient-centered care models, the actigraphy monitoring devices segment is positioned to maintain its market leadership through continued innovation in sensor technology and data analytics capabilities.
By End Use, the Sleep Centers and Clinics Segment Accounts for 39.8% of the Market Share
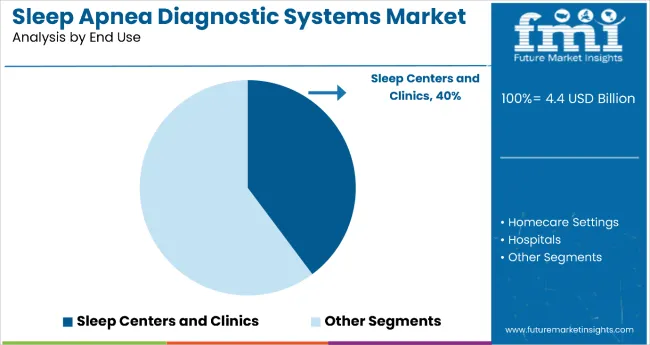
Sleep centers and clinics dominate the sleep apnea diagnostic systems market with 39.8% of the market share in the end use category. This leadership is attributed to these specialized facilities' role as the gold standard for comprehensive sleep disorder diagnosis and their continued importance for conducting detailed polysomnography studies.
Sleep centers and clinics maintain their market position through their ability to provide clinically supervised testing, specialized expertise, and comprehensive diagnostic capabilities that remain essential for accurate sleep apnea assessment.
The segment's dominance is reinforced by the increasing prevalence of obstructive sleep apnea and the growing number of patient referrals to specialized sleep facilities for diagnosis and treatment planning. Despite the rising adoption of portable monitors for home testing, sleep centers and clinics continue to serve as the primary hub for complex diagnostic cases requiring detailed analysis and professional interpretation.
As awareness of sleep disorders continues to expand and healthcare providers increasingly recognize the importance of specialized sleep medicine, the sleep centers and clinics segment is expected to maintain its leading position through continued investment in advanced diagnostic technologies and specialized care delivery models.
The sleep apnea diagnostic systems market is expanding due to rising awareness around sleep wellness, advancements in microelectronics, and the integration of sleep monitoring into wearable tech. However, lack of standardization across home-based diagnostic devices remains a critical barrier, limiting clinician trust and market adoption despite growing demand for remote healthcare solutions.
Rise of Sleep Wellness and Holistic Healthcare Trends Has Driven Industry Growth
Consumer perception of healthcare is evolving beyond reactive treatment toward a preventive, wellness-oriented model. Sleep is now viewed as a cornerstone of overall health, influencing everything from mood regulation to chronic disease prevention. As public awareness of poor sleep outcomes increases-including risks of hypertension, diabetes, and depression-more individuals are proactively seeking sleep apnea diagnostics as part of their wellness journey. Previously underdiagnosed, sleep apnea is now recognized as a major disruptor of sleep quality and daily functioning.
This shift has broadened the consumer base beyond clinically referred patients to include wellness-conscious individuals who pursue testing to optimize long-term health. As a result, the sleep apnea diagnostics market is experiencing growth from both medical and lifestyle-driven demand sources.
Advancements in Microelectronics and Sensor Technology Fuel Industry Growth
Recent progress in microelectronics and sensor miniaturization has redefined sleep apnea diagnostics. Traditional polysomnography (PSG) systems, often bulky and limited to clinical use, are being replaced by compact, home-friendly devices. These innovations have made testing more accessible, user-friendly, and less intrusive. Advanced microelectronics allow for precise measurement of airflow, oxygen saturation, heart rate, and respiratory effort in lightweight, wearable formats. High-sensitivity sensors improve data resolution, enabling earlier and more reliable detection of apnea events.
This shift toward portable solutions has increased patient compliance, minimized hospital visits, and reduced healthcare system burden. These technologies also support the global move toward decentralized diagnostics, making it easier for patients in remote or underserved areas to receive timely evaluations without visiting a sleep lab.
Integration of Sleep Apnea Monitoring into Wearable Tech Unlocks Growth Potential
The rise of wearable health devices has created new pathways for sleep apnea screening and monitoring. Many wearables already track metrics like oxygen saturation, respiratory patterns, and heart rate variability, which are essential indicators for sleep apnea detection. By embedding apnea algorithms into these devices, companies are enabling continuous monitoring and early symptom detection. Integration with smartphone apps and cloud platforms allows users to access sleep analytics, receive alerts, and download personalized health reports.
These functions not only enhance user engagement but also create recurring revenue opportunities for companies through subscription models and premium analytics features. As wearable adoption grows globally, sleep apnea detection becomes a logical extension of functionality, offering a seamless diagnostic experience for health-conscious consumers.
Challenges in Standardizing Home-Based Diagnostic Results Hinder Market Growth
Despite strong interest in home-based diagnostics, lack of standardization across device types remains a significant constraint. In-lab PSG is governed by established protocols, while home systems often vary in sensors, data acquisition methods, and analytical algorithms, resulting in inconsistent diagnostic outputs. This inconsistency undermines confidence among healthcare professionals, who may hesitate to rely solely on home-based testing for treatment decisions. Misalignment in data interpretation may lead to false positives or missed diagnoses, especially in borderline cases.
Consequently, widespread clinical acceptance remains limited. Patients may also struggle to understand results that diverge from clinical expectations, reducing trust in the devices themselves. To address this, the industry must invest in interoperable standards, clinical validation, and better physician-patient communication to ensure accurate, scalable, and trusted home diagnostic pathways.
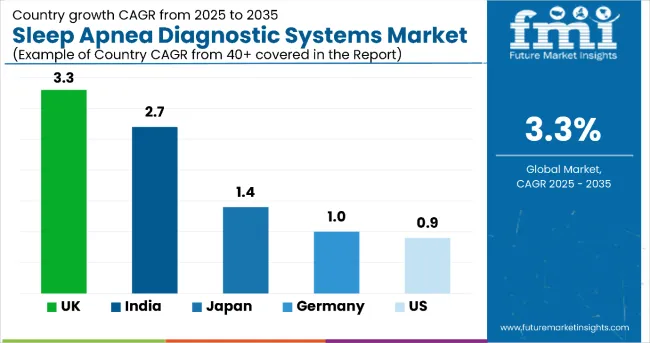
The global sleep apnea diagnostic systems market is experiencing region-specific growth, with high adoption rates in technologically advanced nations and rising demand in emerging economies. The United States leads in infrastructure-supported diagnostics, while Germany and Japan emphasize preventive care. India and China show strong growth potential, driven by large populations and expanding access to digital and home-based diagnostics.
The United States market for sleep apnea diagnostic systems is projected to grow at a CAGR of 0.9% from 2025 to 2035. High prevalence of obstructive sleep apnea (OSA)-especially among older adults and individuals with obesity-continues to drive demand for efficient, non-invasive diagnostic tools.
The well-established healthcare infrastructure and insurance reimbursement systems have facilitated access to diagnostic services, including polysomnography (PSG) and home sleep testing (HST). Government policies promoting improved patient outcomes have supported the adoption of AI-powered diagnostic tools for simplified data interpretation.
Increased awareness around home-based testing has made diagnostics more accessible, particularly for patients in remote areas or those preferring convenience. Market leaders are actively deploying portable sleep monitoring devices that integrate with cloud-based platforms, allowing physicians to monitor and diagnose patients remotely. The integration of telemedicine and emphasis on patient-centered care are further enhancing adoption, making the USA a mature and technologically advanced sleep apnea diagnostics market.
Germany’s sleep apnea diagnostic systems market is expected to register a CAGR of 1.0% during the forecast period. Growth is underpinned by the country’s advanced healthcare infrastructure, universal insurance system, and strong focus on preventive healthcare. The aging population is contributing significantly to sleep apnea diagnoses. As older adults remain at higher risk of sleep-related disorders, diagnostic tools tailored to this demographic are witnessing increased demand.
The country has placed particular focus on early detection to mitigate the long-term complications of untreated OSA. Germany is also promoting home healthcare adoption, which is fueling demand for home sleep apnea testing (HSAT) solutions. The integration of remote monitoring technologies and support from public health insurance providers has accelerated uptake. With continuous innovation and patient awareness rising, Germany’s market is gradually transitioning toward decentralized diagnostic models, improving access and patient compliance.
The Japan sleep apnea diagnostic systems market is being shaped by demographic aging, public awareness, and strong government policy alignment with preventive care. A growing elderly population has led to a rise in sleep disorder prevalence, particularly obstructive sleep apnea, which is more common in individuals over 60. The Japanese government has integrated sleep health strategies into national health frameworks, encouraging early detection and timely treatment.
Support for telemedicine and digital diagnostic platforms has created a favorable environment for market expansion. Japan's culture of regular health checkups, high medical literacy, and preference for non-invasive monitoring tools have all contributed to the rise in demand for advanced diagnostic solutions.
Manufacturers are deploying compact, user-friendly devices that can be operated at home, reducing the need for in-clinic sleep studies. With a focus on preventive health, continued digital integration, and growing awareness of the link between sleep apnea and chronic illnesses, Japan’s sleep apnea diagnostics market is expected to continue its expansion over the next decade.
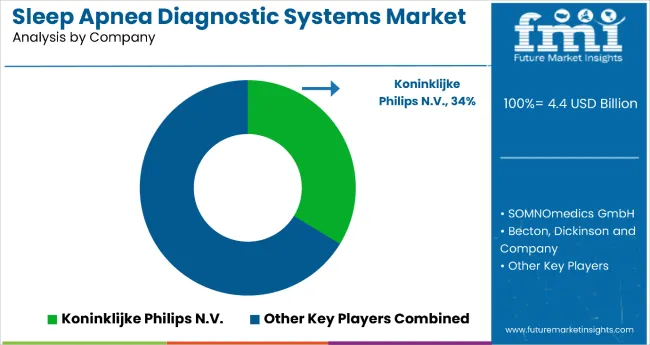
The sleep apnea diagnostic systems market is evolving with increased focus on AI integration, wearable diagnostics, and home-based testing platforms. Tier 1 players are advancing system capabilities through regulatory-cleared algorithms, non-invasive hardware, and remote diagnostic models. Entry into the market remains limited by the need for clinical validation, FDA 510(k) clearance, and compliance with HIPAA, MDR, and CMS guidelines. Tier 1 players, including Philips Respironics, ResMed, and Natus Medical, dominate the clinical and institutional diagnostics segment.
According to Future Market Insights, these firms are prioritizing home sleep apnea testing (HSAT) solutions, wearable integration, and AI-based scoring automation to reduce diagnostic wait times and improve care delivery. Tier 2 companies such as Withings, EnsoData, and BMC Medical are disrupting the market through contactless devices, smart rings, and SaaS-based diagnostic platforms. These companies target consumer-health crossovers and are increasingly active in telehealth partnerships and insurance-backed sleep programs.
Tier 3 firms, including BodiMetrics, Onera Health, and Itamar Medical, focus on AI-enhanced hardware like smart patches, mat-based sensors, and ring-based monitoring. These companies often partner with sleep labs, academic centers, or digital health platforms for pilot studies and deployment. Key strategies across all tiers include algorithm development for oximetry and airflow detection, wearable form factor innovation, and multi-device integration for longitudinal monitoring. Clinical collaborations, regulatory accelerations, and reimbursement enablement are the most influential levers shaping competitive advantages in the market.
Recent Sleep Apnea Diagnostic Systems Industry News
| Report Attributes | Details |
|---|---|
| Current Total Market Size (2025) | USD 4.483 billion |
| Projected Market Size (2035) | USD 6.1 billion |
| CAGR (2025 to 2035) | 3.3% |
| Base Year for Estimation | 2024 |
| Historical Period | 2020 to 2024 |
| Projections Period | 2025 to 2035 |
| Market Analysis Parameter | Revenue in USD Billion |
| By Product | Polysomnography (PSG) Devices, Nasal Flow Sensors, Peripheral Capillary Oxygen Saturation (SPO2), Actigraphy Monitoring Devices |
| By End User | Hospitals, Home care, Sleep centres & clinics |
| Regions Covered | North America, Latin America, East Asia, South Asia and Pacific, Western Europe, Eastern Europe, Middle East and Africa |
| Countries Covered | United States, Japan, Germany, India, United Kingdom, France, Italy, Brazil, Canada, South Korea, Australia, Spain, Netherlands, Saudi Arabia, Switzerland |
| Key Players | Koninklijke Philips N.V., Becton, Dickinson and Company, Braedon Medical Corporation, Advanced Brain Monitoring Inc., SOMNOmedics GmbH, ResMed Inc., BMC Medical Co. Ltd., Natus Medical Incorporated, MGC Diagnostics Corporation, Cleveland Medical Devices Inc., Others |
| Additional Attributes | Rising prevalence of sleep disorders, increasing adoption of portable devices, growing awareness of sleep health, competitive innovation |
| Customization and Pricing | Available upon request |
In terms of product, the industry is segmented into polysomnography (PSG) devices, nasal flow sensors, peripheral capillary oxygen saturation (SPO2), and actigraphy monitoring devices.
In terms of end user, the industry is bifurcated into home care settings, hospitals, and sleep centers & clinics.
Key countries of North America, Latin America, Western Europe, Eastern Europe, South Asia and Pacific, East Asia, the Middle East, and Africa have been covered in the report.
Sleep apnea diagnostic systems market is expected to increase at a CAGR of 3.3% between 2025 and 2035.
The actigraphy monitoring devices segment is expected to occupy 42.4% market share in 2025.
The market for sleep apnea diagnostic systems is expected to reach USD 6.1 billion by 2035.
The United States is forecast to see a CAGR of 0.9% during the assessment period.
Table 1: Global Market Value (US$ Million) Forecast by Region, 2018 to 2033
Table 2: Global Market Value (US$ Million) Forecast by Product, 2018 to 2033
Table 3: Global Market Value (US$ Million) Forecast by End-User Type, 2018 to 2033
Table 4: North America Market Value (US$ Million) Forecast by Country, 2018 to 2033
Table 5: North America Market Value (US$ Million) Forecast by Product, 2018 to 2033
Table 6: North America Market Value (US$ Million) Forecast by End-User Type, 2018 to 2033
Table 7: Latin America Market Value (US$ Million) Forecast by Country, 2018 to 2033
Table 8: Latin America Market Value (US$ Million) Forecast by Product, 2018 to 2033
Table 9: Latin America Market Value (US$ Million) Forecast by End-User Type, 2018 to 2033
Table 10: Western Europe Market Value (US$ Million) Forecast by Country, 2018 to 2033
Table 11: Western Europe Market Value (US$ Million) Forecast by Product, 2018 to 2033
Table 12: Western Europe Market Value (US$ Million) Forecast by End-User Type, 2018 to 2033
Table 13: Eastern Europe Market Value (US$ Million) Forecast by Country, 2018 to 2033
Table 14: Eastern Europe Market Value (US$ Million) Forecast by Product, 2018 to 2033
Table 15: Eastern Europe Market Value (US$ Million) Forecast by End-User Type, 2018 to 2033
Table 16: South Asia and Pacific Market Value (US$ Million) Forecast by Country, 2018 to 2033
Table 17: South Asia and Pacific Market Value (US$ Million) Forecast by Product, 2018 to 2033
Table 18: South Asia and Pacific Market Value (US$ Million) Forecast by End-User Type, 2018 to 2033
Table 19: East Asia Market Value (US$ Million) Forecast by Country, 2018 to 2033
Table 20: East Asia Market Value (US$ Million) Forecast by Product, 2018 to 2033
Table 21: East Asia Market Value (US$ Million) Forecast by End-User Type, 2018 to 2033
Table 22: Middle East and Africa Market Value (US$ Million) Forecast by Country, 2018 to 2033
Table 23: Middle East and Africa Market Value (US$ Million) Forecast by Product, 2018 to 2033
Table 24: Middle East and Africa Market Value (US$ Million) Forecast by End-User Type, 2018 to 2033
Figure 1: Global Market Value (US$ Million) by Product, 2023 to 2033
Figure 2: Global Market Value (US$ Million) by End-User Type, 2023 to 2033
Figure 3: Global Market Value (US$ Million) by Region, 2023 to 2033
Figure 4: Global Market Value (US$ Million) Analysis by Region, 2018 to 2033
Figure 5: Global Market Value Share (%) and BPS Analysis by Region, 2023 to 2033
Figure 6: Global Market Y-o-Y Growth (%) Projections by Region, 2023 to 2033
Figure 7: Global Market Value (US$ Million) Analysis by Product, 2018 to 2033
Figure 8: Global Market Value Share (%) and BPS Analysis by Product, 2023 to 2033
Figure 9: Global Market Y-o-Y Growth (%) Projections by Product, 2023 to 2033
Figure 10: Global Market Value (US$ Million) Analysis by End-User Type, 2018 to 2033
Figure 11: Global Market Value Share (%) and BPS Analysis by End-User Type, 2023 to 2033
Figure 12: Global Market Y-o-Y Growth (%) Projections by End-User Type, 2023 to 2033
Figure 13: Global Market Attractiveness by Product, 2023 to 2033
Figure 14: Global Market Attractiveness by End-User Type, 2023 to 2033
Figure 15: Global Market Attractiveness by Region, 2023 to 2033
Figure 16: North America Market Value (US$ Million) by Product, 2023 to 2033
Figure 17: North America Market Value (US$ Million) by End-User Type, 2023 to 2033
Figure 18: North America Market Value (US$ Million) by Country, 2023 to 2033
Figure 19: North America Market Value (US$ Million) Analysis by Country, 2018 to 2033
Figure 20: North America Market Value Share (%) and BPS Analysis by Country, 2023 to 2033
Figure 21: North America Market Y-o-Y Growth (%) Projections by Country, 2023 to 2033
Figure 22: North America Market Value (US$ Million) Analysis by Product, 2018 to 2033
Figure 23: North America Market Value Share (%) and BPS Analysis by Product, 2023 to 2033
Figure 24: North America Market Y-o-Y Growth (%) Projections by Product, 2023 to 2033
Figure 25: North America Market Value (US$ Million) Analysis by End-User Type, 2018 to 2033
Figure 26: North America Market Value Share (%) and BPS Analysis by End-User Type, 2023 to 2033
Figure 27: North America Market Y-o-Y Growth (%) Projections by End-User Type, 2023 to 2033
Figure 28: North America Market Attractiveness by Product, 2023 to 2033
Figure 29: North America Market Attractiveness by End-User Type, 2023 to 2033
Figure 30: North America Market Attractiveness by Country, 2023 to 2033
Figure 31: Latin America Market Value (US$ Million) by Product, 2023 to 2033
Figure 32: Latin America Market Value (US$ Million) by End-User Type, 2023 to 2033
Figure 33: Latin America Market Value (US$ Million) by Country, 2023 to 2033
Figure 34: Latin America Market Value (US$ Million) Analysis by Country, 2018 to 2033
Figure 35: Latin America Market Value Share (%) and BPS Analysis by Country, 2023 to 2033
Figure 36: Latin America Market Y-o-Y Growth (%) Projections by Country, 2023 to 2033
Figure 37: Latin America Market Value (US$ Million) Analysis by Product, 2018 to 2033
Figure 38: Latin America Market Value Share (%) and BPS Analysis by Product, 2023 to 2033
Figure 39: Latin America Market Y-o-Y Growth (%) Projections by Product, 2023 to 2033
Figure 40: Latin America Market Value (US$ Million) Analysis by End-User Type, 2018 to 2033
Figure 41: Latin America Market Value Share (%) and BPS Analysis by End-User Type, 2023 to 2033
Figure 42: Latin America Market Y-o-Y Growth (%) Projections by End-User Type, 2023 to 2033
Figure 43: Latin America Market Attractiveness by Product, 2023 to 2033
Figure 44: Latin America Market Attractiveness by End-User Type, 2023 to 2033
Figure 45: Latin America Market Attractiveness by Country, 2023 to 2033
Figure 46: Western Europe Market Value (US$ Million) by Product, 2023 to 2033
Figure 47: Western Europe Market Value (US$ Million) by End-User Type, 2023 to 2033
Figure 48: Western Europe Market Value (US$ Million) by Country, 2023 to 2033
Figure 49: Western Europe Market Value (US$ Million) Analysis by Country, 2018 to 2033
Figure 50: Western Europe Market Value Share (%) and BPS Analysis by Country, 2023 to 2033
Figure 51: Western Europe Market Y-o-Y Growth (%) Projections by Country, 2023 to 2033
Figure 52: Western Europe Market Value (US$ Million) Analysis by Product, 2018 to 2033
Figure 53: Western Europe Market Value Share (%) and BPS Analysis by Product, 2023 to 2033
Figure 54: Western Europe Market Y-o-Y Growth (%) Projections by Product, 2023 to 2033
Figure 55: Western Europe Market Value (US$ Million) Analysis by End-User Type, 2018 to 2033
Figure 56: Western Europe Market Value Share (%) and BPS Analysis by End-User Type, 2023 to 2033
Figure 57: Western Europe Market Y-o-Y Growth (%) Projections by End-User Type, 2023 to 2033
Figure 58: Western Europe Market Attractiveness by Product, 2023 to 2033
Figure 59: Western Europe Market Attractiveness by End-User Type, 2023 to 2033
Figure 60: Western Europe Market Attractiveness by Country, 2023 to 2033
Figure 61: Eastern Europe Market Value (US$ Million) by Product, 2023 to 2033
Figure 62: Eastern Europe Market Value (US$ Million) by End-User Type, 2023 to 2033
Figure 63: Eastern Europe Market Value (US$ Million) by Country, 2023 to 2033
Figure 64: Eastern Europe Market Value (US$ Million) Analysis by Country, 2018 to 2033
Figure 65: Eastern Europe Market Value Share (%) and BPS Analysis by Country, 2023 to 2033
Figure 66: Eastern Europe Market Y-o-Y Growth (%) Projections by Country, 2023 to 2033
Figure 67: Eastern Europe Market Value (US$ Million) Analysis by Product, 2018 to 2033
Figure 68: Eastern Europe Market Value Share (%) and BPS Analysis by Product, 2023 to 2033
Figure 69: Eastern Europe Market Y-o-Y Growth (%) Projections by Product, 2023 to 2033
Figure 70: Eastern Europe Market Value (US$ Million) Analysis by End-User Type, 2018 to 2033
Figure 71: Eastern Europe Market Value Share (%) and BPS Analysis by End-User Type, 2023 to 2033
Figure 72: Eastern Europe Market Y-o-Y Growth (%) Projections by End-User Type, 2023 to 2033
Figure 73: Eastern Europe Market Attractiveness by Product, 2023 to 2033
Figure 74: Eastern Europe Market Attractiveness by End-User Type, 2023 to 2033
Figure 75: Eastern Europe Market Attractiveness by Country, 2023 to 2033
Figure 76: South Asia and Pacific Market Value (US$ Million) by Product, 2023 to 2033
Figure 77: South Asia and Pacific Market Value (US$ Million) by End-User Type, 2023 to 2033
Figure 78: South Asia and Pacific Market Value (US$ Million) by Country, 2023 to 2033
Figure 79: South Asia and Pacific Market Value (US$ Million) Analysis by Country, 2018 to 2033
Figure 80: South Asia and Pacific Market Value Share (%) and BPS Analysis by Country, 2023 to 2033
Figure 81: South Asia and Pacific Market Y-o-Y Growth (%) Projections by Country, 2023 to 2033
Figure 82: South Asia and Pacific Market Value (US$ Million) Analysis by Product, 2018 to 2033
Figure 83: South Asia and Pacific Market Value Share (%) and BPS Analysis by Product, 2023 to 2033
Figure 84: South Asia and Pacific Market Y-o-Y Growth (%) Projections by Product, 2023 to 2033
Figure 85: South Asia and Pacific Market Value (US$ Million) Analysis by End-User Type, 2018 to 2033
Figure 86: South Asia and Pacific Market Value Share (%) and BPS Analysis by End-User Type, 2023 to 2033
Figure 87: South Asia and Pacific Market Y-o-Y Growth (%) Projections by End-User Type, 2023 to 2033
Figure 88: South Asia and Pacific Market Attractiveness by Product, 2023 to 2033
Figure 89: South Asia and Pacific Market Attractiveness by End-User Type, 2023 to 2033
Figure 90: South Asia and Pacific Market Attractiveness by Country, 2023 to 2033
Figure 91: East Asia Market Value (US$ Million) by Product, 2023 to 2033
Figure 92: East Asia Market Value (US$ Million) by End-User Type, 2023 to 2033
Figure 93: East Asia Market Value (US$ Million) by Country, 2023 to 2033
Figure 94: East Asia Market Value (US$ Million) Analysis by Country, 2018 to 2033
Figure 95: East Asia Market Value Share (%) and BPS Analysis by Country, 2023 to 2033
Figure 96: East Asia Market Y-o-Y Growth (%) Projections by Country, 2023 to 2033
Figure 97: East Asia Market Value (US$ Million) Analysis by Product, 2018 to 2033
Figure 98: East Asia Market Value Share (%) and BPS Analysis by Product, 2023 to 2033
Figure 99: East Asia Market Y-o-Y Growth (%) Projections by Product, 2023 to 2033
Figure 100: East Asia Market Value (US$ Million) Analysis by End-User Type, 2018 to 2033
Figure 101: East Asia Market Value Share (%) and BPS Analysis by End-User Type, 2023 to 2033
Figure 102: East Asia Market Y-o-Y Growth (%) Projections by End-User Type, 2023 to 2033
Figure 103: East Asia Market Attractiveness by Product, 2023 to 2033
Figure 104: East Asia Market Attractiveness by End-User Type, 2023 to 2033
Figure 105: East Asia Market Attractiveness by Country, 2023 to 2033
Figure 106: Middle East and Africa Market Value (US$ Million) by Product, 2023 to 2033
Figure 107: Middle East and Africa Market Value (US$ Million) by End-User Type, 2023 to 2033
Figure 108: Middle East and Africa Market Value (US$ Million) by Country, 2023 to 2033
Figure 109: Middle East and Africa Market Value (US$ Million) Analysis by Country, 2018 to 2033
Figure 110: Middle East and Africa Market Value Share (%) and BPS Analysis by Country, 2023 to 2033
Figure 111: Middle East and Africa Market Y-o-Y Growth (%) Projections by Country, 2023 to 2033
Figure 112: Middle East and Africa Market Value (US$ Million) Analysis by Product, 2018 to 2033
Figure 113: Middle East and Africa Market Value Share (%) and BPS Analysis by Product, 2023 to 2033
Figure 114: Middle East and Africa Market Y-o-Y Growth (%) Projections by Product, 2023 to 2033
Figure 115: Middle East and Africa Market Value (US$ Million) Analysis by End-User Type, 2018 to 2033
Figure 116: Middle East and Africa Market Value Share (%) and BPS Analysis by End-User Type, 2023 to 2033
Figure 117: Middle East and Africa Market Y-o-Y Growth (%) Projections by End-User Type, 2023 to 2033
Figure 118: Middle East and Africa Market Attractiveness by Product, 2023 to 2033
Figure 119: Middle East and Africa Market Attractiveness by End-User Type, 2023 to 2033
Figure 120: Middle East and Africa Market Attractiveness by Country, 2023 to 2033


Our Research Products

The "Full Research Suite" delivers actionable market intel, deep dives on markets or technologies, so clients act faster, cut risk, and unlock growth.

The Leaderboard benchmarks and ranks top vendors, classifying them as Established Leaders, Leading Challengers, or Disruptors & Challengers.

Locates where complements amplify value and substitutes erode it, forecasting net impact by horizon

We deliver granular, decision-grade intel: market sizing, 5-year forecasts, pricing, adoption, usage, revenue, and operational KPIs—plus competitor tracking, regulation, and value chains—across 60 countries broadly.

Spot the shifts before they hit your P&L. We track inflection points, adoption curves, pricing moves, and ecosystem plays to show where demand is heading, why it is changing, and what to do next across high-growth markets and disruptive tech

Real-time reads of user behavior. We track shifting priorities, perceptions of today’s and next-gen services, and provider experience, then pace how fast tech moves from trial to adoption, blending buyer, consumer, and channel inputs with social signals (#WhySwitch, #UX).

Partner with our analyst team to build a custom report designed around your business priorities. From analysing market trends to assessing competitors or crafting bespoke datasets, we tailor insights to your needs.
Supplier Intelligence
Discovery & Profiling
Capacity & Footprint
Performance & Risk
Compliance & Governance
Commercial Readiness
Who Supplies Whom
Scorecards & Shortlists
Playbooks & Docs
Category Intelligence
Definition & Scope
Demand & Use Cases
Cost Drivers
Market Structure
Supply Chain Map
Trade & Policy
Operating Norms
Deliverables
Buyer Intelligence
Account Basics
Spend & Scope
Procurement Model
Vendor Requirements
Terms & Policies
Entry Strategy
Pain Points & Triggers
Outputs
Pricing Analysis
Benchmarks
Trends
Should-Cost
Indexation
Landed Cost
Commercial Terms
Deliverables
Brand Analysis
Positioning & Value Prop
Share & Presence
Customer Evidence
Go-to-Market
Digital & Reputation
Compliance & Trust
KPIs & Gaps
Outputs
Full Research Suite comprises of:
Market outlook & trends analysis
Interviews & case studies
Strategic recommendations
Vendor profiles & capabilities analysis
5-year forecasts
8 regions and 60+ country-level data splits
Market segment data splits
12 months of continuous data updates
DELIVERED AS:
PDF EXCEL ONLINE
China Sleep Apnea Diagnostic Systems Market Outlook – Size, Share & Growth 2025-2035
Japan Sleep Apnea Diagnostic Systems Market Report – Size, Demand & Outlook 2025-2035
France Sleep Apnea Diagnostic Systems Market Insights – Size, Share & Demand 2025-2035
Germany Sleep Apnea Diagnostic Systems Market Trends – Growth, Innovations & Forecast 2025-2035
United States Sleep Apnea Diagnostic Systems Market Analysis – Trends & Forecast 2025-2035
Sleep Apnea Implants Market Analysis – Size, Share & Forecast 2025-2035
Sleep Apnea Devices Market Overview - Trends & Growth Forecast 2025 to 2035
Key Players & Market Share in the Sleep Apnea Implants Industry
Home Sleep Apnea Testing Market Analysis - Size, Share, and Forecast Outlook 2025 to 2035
Contact-Free Sleep Monitoring Systems Market Trends - Growth & Forecast 2025 to 2035
Sleeping Bag Market Forecast and Outlook 2025 to 2035
Sleep Study Equipment Market Size and Share Forecast Outlook 2025 to 2035
Sleep Movement Disorders Market Size and Share Forecast Outlook 2025 to 2035
Diagnostic Shipper Market Size and Share Forecast Outlook 2025 to 2035
Sleep Supplement Market Size and Share Forecast Outlook 2025 to 2035
Diagnostic Imaging Markers Market Size and Share Forecast Outlook 2025 to 2035
Sleep Tracking and Optimization Products Market Size and Share Forecast Outlook 2025 to 2035
Diagnostic Imaging Services Market Size and Share Forecast Outlook 2025 to 2035
Sleep Study Market Analysis – Size, Share, and Forecast Outlook 2025 to 2035
Sleeper Pads Market Size and Share Forecast Outlook 2025 to 2035

Thank you!
You will receive an email from our Business Development Manager. Please be sure to check your SPAM/JUNK folder too.
Chat With
MaRIA