Sleeping Bags Market
Market Insights on Sleeping Bags covering sales outlook, demand forecast & up-to-date key trends
Sleeping Bags Market By Demography, Insulation Type, Size, Shape, Sales Channel & Region - Forecast 2022-2032
Sleeping Bags Market Overview (2022-2032)
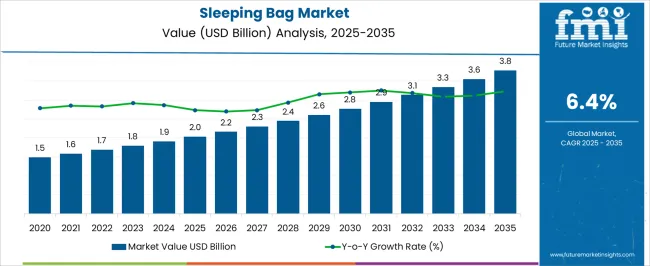
[250 Pages Report] The global sleeping bags market was valued at US$ 1,545 Million in 2021, and is likely to reflect a Y-o-Y growth of 7.1% in 2022 to reach US$ 1,655 Million. By 2032, a valuation of US$ 3,050 Million is projected, with an expected CAGR of 6.3%.
Report Attribute |
Details |
Estimated Base Year Value (2021) |
US$ 1,545 Million |
Expected Market Value (2022) |
US$ 1,655 Million |
Anticipated Forecast Value (2032) |
US$ 3,050 Million |
Projected Growth Rate (2022-2032) |
6.3% CAGR |
Sleeping bags are primarily used to insulate our bodies from harsh climatic conditions, but they also serve as a quilt, covering, or simply bedding. The market for sleeping bags is rapidly expanding due to an increase in outdoor activities such as hiking, hill walking, climbing, and camping.
The increase in demand for sleeping bags is proportional to the increase in adventure enthusiasts. Adventure activities not only bring you closer to nature, but they also serve as a cost-effective and affordable vacation option, causing an increase in demand for products such as sleeping bags in the market.
Sleeping bags have evolved into a must-have item when packing for a camping trip. The rise of e-commerce makes sleeping bags and their variants more accessible to consumers, which contributes to the market's increased demand for sleeping bags.
Let us know your requirement to get
100% FREE customization
Which are Some Prominent Drivers Spearheading Sleeping bags Market Growth?
Globally, the demand for sleeping bags is steadily increasing due to an increase in the population of nature lovers who are more inclined to adventurous activities. The increasing rate of adoption of adventurous vacation spots by the millennial population, as a result of increased awareness about the benefits of camping, such as stress reduction and improved mental and emotional health, has resulted in an increase in market demand for sleeping bags. The availability of various sleeping bag variants that are suitable for different purposes and demographics makes it a customer-friendly product.
Manufacturers of sleeping bags are developing new and innovative products to meet various types of consumer demand by introducing products that are suitable for all types of climatic conditions, durable, and cost-effective, resulting in an increase in demand for sleeping bags in the market. The emergence of social media as a key influencer on consumer interest also plays a significant role in encouraging the growth of camping activities and, as a result, the market demand for sleeping bags.
Why is Asia-Pacific Emerging as an Opportunistic Sleeping bags Market?
The growing government support for tourism, particularly in India, is expected to drive up demand for sleeping bags in the Asia Pacific region. Also as a result of an increase in recreational activities and camping among young people. From 2022 to 2032, this is expected to increase the demand for sleeping bags in this region.
The rapidly expanding sports and fitness verticals have also paved the way for a slew of investments, complementing the expansion of the physical activity industry. The thriving digital commerce sector will also create a favorable environment for product development in the region.
Find your sweet spots for generating winning opportunities in this market.
Talk to AnalystHow is North America Contributing to the Growth of the Sleeping bags Market?
Due to the presence of a large number of professional rock climbers and mountaineers in the region, the market in North America is expected to expand at a significant rate over the forecast period. The North American sleeping bag market is expected to grow significantly between 2022 and 2032, owing to an increase in the number of professional rock climbers and mountaineers.
The increasing number of camping trips, the rising import rate for raw materials, and the increase in the number of recreational and outdoor activities will all have an impact on regional market growth. North America dominates the market, with a 50 percent market share during the forecast period.
Market Competition
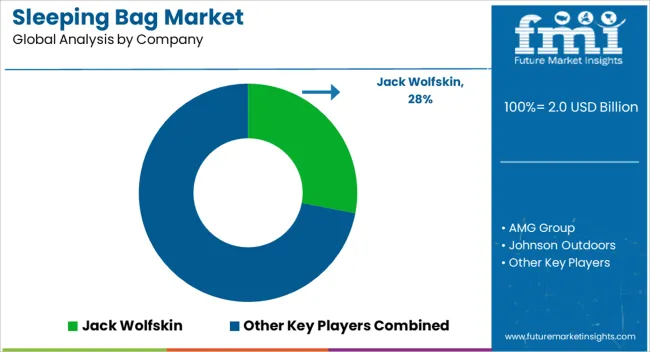
The dominating key players included in the report are Jack Wolfskin, AMG Group Vaude, Johnson Outdoors, Oase Outdoors, Exxel Outdoors, Big Agnes, Jarden, V F Corp, Snugpak, Gelert and Columbia Sportswear, and others have always been the initial targets of sleeping bag companies and many others.

An unified Market Research Subscription Platform, built for today’s disparate research needs.
Scope of Report
Report Attribute |
Details |
Growth Rate |
CAGR of 6.3% from 2022 to 2032 |
Base Year for Estimation |
2021 |
Historical Data |
2015-2020 |
Forecast Period |
2022-2032 |
Quantitative Units |
Revenue in USD Billion, Volume in Kilotons and CAGR from 2022-2032 |
Report Coverage |
Revenue Forecast, Volume Forecast, Company Ranking, Competitive Landscape, Growth Factors, Trends and Pricing Analysis |
Segments Covered |
|
Regions Covered |
|
Key Countries Profiled |
|
Key Companies Profiled |
|
Customization |
Available Upon Request |
Key Segments Covered in the Sleeping Bags Industry Report
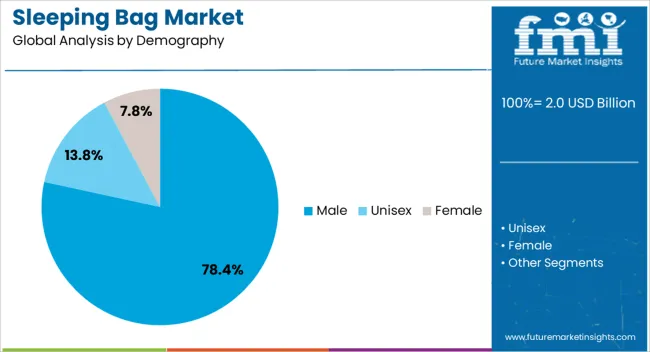
Demography:
- Male
- Female
- Unisex
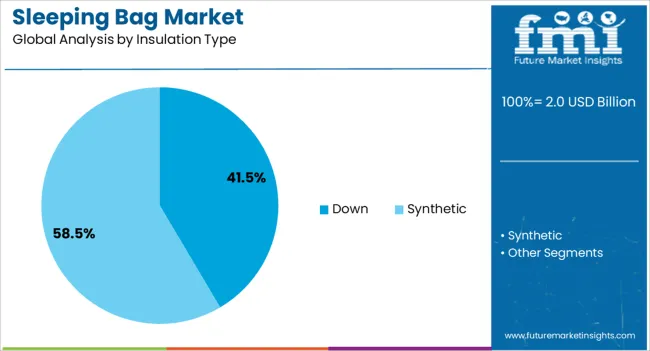
Insulation Type:
- Down
- Synthetic
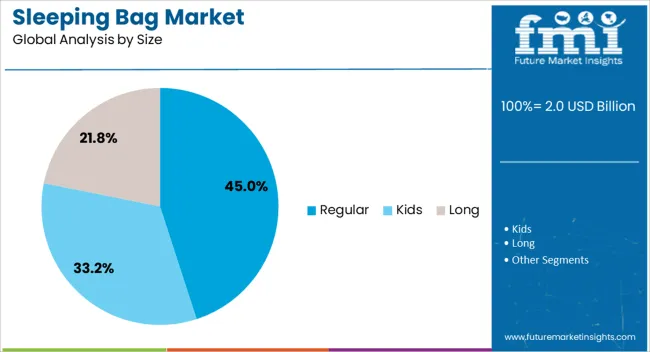
Size:
- Kids
- Long
- Regular
Shape:
- Rectangular Shape
- Mummy Shape
Sales Channel:
- Multi Brand Stores
- Independent retailers
- Supermarket/Hypermarket
- Online Sales
- Company Website
- 3rd party Online Sales
- Specialty stores
Region:
- North America
- Latin America
- Western Europe
- Eastern Europe
- Asia Pacific
- Middle East and Africa
Frequently Asked Questions
FMI projects the global Sleeping bags market to expand at a 6.3% value CAGR by 2032
Asia Pacific is expected to be the most opportunistic Sleeping bags market.
Jack Wolfskin, AMG Group Vaude and Johnson outdoors are some prominent sleeping bag manufacturers
1. Executive Summary
1.1. Global Market Outlook
1.2. Demand-side Trends
1.3. Supply-side Trends
1.4. Technology Roadmap Analysis
1.5. Analysis and Recommendations
2. Market Overview
2.1. Market Coverage / Taxonomy
2.2. Market Definition / Scope / Limitations
3. Market Background
3.1. Market Dynamics
3.1.1. Drivers
3.1.2. Restraints
3.1.3. Opportunity
3.1.4. Trends
3.2. Scenario Forecast
3.2.1. Demand in Optimistic Scenario
3.2.2. Demand in Likely Scenario
3.2.3. Demand in Conservative Scenario
3.3. Opportunity Map Analysis
3.4. Investment Feasibility Matrix
3.5. PESTLE and Porter’s Analysis
3.6. Regulatory Landscape
3.6.1. By Key Regions
3.6.2. By Key Countries
4. Global Sleeping Bags Market Analysis 2017-2021 and Forecast, 2022-2032
4.1. Historical Market Size Value (US$ Mn) & Volume(Mn units) Analysis, 2017-2021
4.2. Current and Future Market Size Value (US$ Mn) & Volume(Mn units) Projections, 2022-2032
4.2.1. Y-o-Y Growth Trend Analysis
4.2.2. Absolute $ Opportunity Analysis
5. Global Sleeping Bags Market Analysis 2017-2021 and Forecast 2022-2032, By By Properties
5.1. Introduction / Key Findings
5.2. Historical Market Size Value (US$ Mn) & Volume(Mn units) Analysis By By Properties , 2017-2021
5.3. Current and Future Market Size Value (US$ Mn) & Volume(Mn units) Analysis and Forecast By By Properties , 2022-2032
5.3.1. Rain
5.3.2. Snow
5.3.3. Wind
5.3.4. Thermal insulation
5.4. Y-o-Y Growth Trend Analysis By By Properties , 2017-2021
5.5. Absolute $ Opportunity Analysis By By Properties , 2022-2032
6. Global Sleeping Bags Market Analysis 2017-2021 and Forecast 2022-2032, By By Insulation Type
6.1. Introduction / Key Findings
6.2. Historical Market Size Value (US$ Mn) & Volume(Mn units) Analysis By By Insulation Type, 2017-2021
6.3. Current and Future Market Size Value (US$ Mn) & Volume(Mn units) Analysis and Forecast By By Insulation Type, 2022-2032
6.3.1. Synthetic
6.3.2. Down
6.4. Y-o-Y Growth Trend Analysis By By Insulation Type, 2017-2021
6.5. Absolute $ Opportunity Analysis By By Insulation Type, 2022-2032
7. Global Sleeping Bags Market Analysis 2017-2021 and Forecast 2022-2032, By By Shape
7.1. Introduction / Key Findings
7.2. Historical Market Size Value (US$ Mn) & Volume(Mn units) Analysis By By Shape, 2017-2021
7.3. Current and Future Market Size Value (US$ Mn) & Volume(Mn units) Analysis and Forecast By By Shape, 2022-2032
7.3.1. Mummy Shape
7.3.2. Rectangular Shape
7.3.3. Others
7.4. Y-o-Y Growth Trend Analysis By By Shape, 2017-2021
7.5. Absolute $ Opportunity Analysis By By Shape, 2022-2032
8. Global Sleeping Bags Market Analysis 2017-2021 and Forecast 2022-2032, By Application
8.1. Introduction / Key Findings
8.2. Historical Market Size Value (US$ Mn) & Volume(Mn units) Analysis By Application, 2017-2021
8.3. Current and Future Market Size Value (US$ Mn) & Volume(Mn units) Analysis and Forecast By Application, 2022-2032
8.3.1. Trekking
8.3.2. Mountaineering
8.3.3. Outdoor activities
8.3.4. Others
8.4. Y-o-Y Growth Trend Analysis By Application, 2017-2021
8.5. Absolute $ Opportunity Analysis By Application, 2022-2032
9. Global Sleeping Bags Market Analysis 2017-2021 and Forecast 2022-2032, By End User
9.1. Introduction / Key Findings
9.2. Historical Market Size Value (US$ Mn) & Volume(Mn units) Analysis By End User, 2017-2021
9.3. Current and Future Market Size Value (US$ Mn) & Volume(Mn units) Analysis and Forecast By End User, 2022-2032
9.3.1. Adult
9.3.2. Kids
9.4. Y-o-Y Growth Trend Analysis By End User, 2017-2021
9.5. Absolute $ Opportunity Analysis By End User, 2022-2032
10. Global Sleeping Bags Market Analysis 2017-2021 and Forecast 2022-2032, By Sales Channels
10.1. Introduction / Key Findings
10.2. Historical Market Size Value (US$ Mn) & Volume(Mn units) Analysis By Sales Channels , 2017-2021
10.3. Current and Future Market Size Value (US$ Mn) & Volume(Mn units) Analysis and Forecast By Sales Channels , 2022-2032
10.3.1. Hypermarkets/Supermarkets
10.3.2. Multi Brand Stores
10.3.3. E-commerce
10.3.4. Specialty Stores
10.3.5. Online
10.4. Y-o-Y Growth Trend Analysis By Sales Channels , 2017-2021
10.5. Absolute $ Opportunity Analysis By Sales Channels , 2022-2032
11. Global Sleeping Bags Market Analysis 2017-2021 and Forecast 2022-2032, By Region
11.1. Introduction
11.2. Historical Market Size Value (US$ Mn) & Volume(Mn units) Analysis By Region, 2017-2021
11.3. Current Market Size Value (US$ Mn) & Volume(Mn units) Analysis and Forecast By Region, 2022-2032
11.3.1. North America
11.3.2. Latin America
11.3.3. Europe
11.3.4. Asia Pacific
11.3.5. MEA
11.4. Market Attractiveness Analysis By Region
12. North America Sleeping Bags Market Analysis 2017-2021 and Forecast 2022-2032, By Country
12.1. Historical Market Size Value (US$ Mn) & Volume(Mn units) Trend Analysis By Market Taxonomy, 2017-2021
12.2. Market Size Value (US$ Mn) & Volume(Mn units) Forecast By Market Taxonomy, 2022-2032
12.2.1. By Country
12.2.1.1. U.S.
12.2.1.2. Canada
12.2.2. By By Properties
12.2.3. By By Insulation Type
12.2.4. By By Shape
12.2.5. By Application
12.2.6. By End User
12.2.7. By Sales Channels
12.3. Market Attractiveness Analysis
12.3.1. By Country
12.3.2. By By Properties
12.3.3. By By Insulation Type
12.3.4. By By Shape
12.3.5. By Application
12.3.6. By End User
12.3.7. By Sales Channels
12.4. Key Takeaways
13. Latin America Sleeping Bags Market Analysis 2017-2021 and Forecast 2022-2032, By Country
13.1. Historical Market Size Value (US$ Mn) & Volume(Mn units) Trend Analysis By Market Taxonomy, 2017-2021
13.2. Market Size Value (US$ Mn) & Volume(Mn units) Forecast By Market Taxonomy, 2022-2032
13.2.1. By Country
13.2.1.1. Brazil
13.2.1.2. Mexico
13.2.1.3. Rest of Latin America
13.2.2. By By Properties
13.2.3. By By Insulation Type
13.2.4. By By Shape
13.2.5. By Application
13.2.6. By End User
13.2.7. By Sales Channels
13.3. Market Attractiveness Analysis
13.3.1. By Country
13.3.2. By By Properties
13.3.3. By By Insulation Type
13.3.4. By By Shape
13.3.5. By Application
13.3.6. By End User
13.3.7. By Sales Channels
13.4. Key Takeaways
14. Europe Sleeping Bags Market Analysis 2017-2021 and Forecast 2022-2032, By Country
14.1. Historical Market Size Value (US$ Mn) & Volume(Mn units) Trend Analysis By Market Taxonomy, 2017-2021
14.2. Market Size Value (US$ Mn) & Volume(Mn units) Forecast By Market Taxonomy, 2022-2032
14.2.1. By Country
14.2.1.1. Germany
14.2.1.2. Italy
14.2.1.3. France
14.2.1.4. U.K.
14.2.1.5. Spain
14.2.1.6. Russia
14.2.1.7. BENELUX
14.2.1.8. Rest of Europe
14.2.2. By By Properties
14.2.3. By By Insulation Type
14.2.4. By By Shape
14.2.5. By Application
14.2.6. By End User
14.2.7. By Sales Channels
14.3. Market Attractiveness Analysis
14.3.1. By Country
14.3.2. By By Properties
14.3.3. By By Insulation Type
14.3.4. By By Shape
14.3.5. By Application
14.3.6. By End User
14.3.7. By Sales Channels
14.4. Key Takeaways
15. Asia Pacific Sleeping Bags Market Analysis 2017-2021 and Forecast 2022-2032, By Country
15.1. Historical Market Size Value (US$ Mn) & Volume(Mn units) Trend Analysis By Market Taxonomy, 2017-2021
15.2. Market Size Value (US$ Mn) & Volume(Mn units) Forecast By Market Taxonomy, 2022-2032
15.2.1. By Country
15.2.1.1. China
15.2.1.2. Japan
15.2.1.3. South Korea
15.2.1.4. India
15.2.1.5. Rest of Asia Pacific
15.2.2. By By Properties
15.2.3. By By Insulation Type
15.2.4. By By Shape
15.2.5. By Application
15.2.6. By End User
15.2.7. By Sales Channels
15.3. Market Attractiveness Analysis
15.3.1. By Country
15.3.2. By By Properties
15.3.3. By By Insulation Type
15.3.4. By By Shape
15.3.5. By Application
15.3.6. By End User
15.3.7. By Sales Channels
15.4. Key Takeaways
16. MEA Sleeping Bags Market Analysis 2017-2021 and Forecast 2022-2032, By Country
16.1. Historical Market Size Value (US$ Mn) & Volume(Mn units) Trend Analysis By Market Taxonomy, 2017-2021
16.2. Market Size Value (US$ Mn) & Volume(Mn units) Forecast By Market Taxonomy, 2022-2032
16.2.1. By Country
16.2.1.1. GCC
16.2.1.2. Rest of MEA
16.2.2. By By Properties
16.2.3. By By Insulation Type
16.2.4. By By Shape
16.2.5. By Application
16.2.6. By End User
16.2.7. By Sales Channels
16.3. Market Attractiveness Analysis
16.3.1. By Country
16.3.2. By By Properties
16.3.3. By By Insulation Type
16.3.4. By By Shape
16.3.5. By Application
16.3.6. By End User
16.3.7. By Sales Channels
16.4. Key Takeaways
17. Key Countries Sleeping Bags Market Analysis
17.1. U.S.
17.1.1. Pricing Analysis
17.1.2. Market Share Analysis, 2021
17.1.2.1. By By Properties
17.1.2.2. By By Insulation Type
17.1.2.3. By By Shape
17.1.2.4. By Application
17.1.2.5. By End User
17.1.2.6. By Sales Channels
17.2. Canada
17.2.1. Pricing Analysis
17.2.2. Market Share Analysis, 2021
17.2.2.1. By By Properties
17.2.2.2. By By Insulation Type
17.2.2.3. By By Shape
17.2.2.4. By Application
17.2.2.5. By End User
17.2.2.6. By Sales Channels
17.3. Brazil
17.3.1. Pricing Analysis
17.3.2. Market Share Analysis, 2021
17.3.2.1. By By Properties
17.3.2.2. By By Insulation Type
17.3.2.3. By By Shape
17.3.2.4. By Application
17.3.2.5. By End User
17.3.2.6. By Sales Channels
17.4. Mexico
17.4.1. Pricing Analysis
17.4.2. Market Share Analysis, 2021
17.4.2.1. By By Properties
17.4.2.2. By By Insulation Type
17.4.2.3. By By Shape
17.4.2.4. By Application
17.4.2.5. By End User
17.4.2.6. By Sales Channels
17.5. Argentina
17.5.1. Pricing Analysis
17.5.2. Market Share Analysis, 2021
17.5.2.1. By By Properties
17.5.2.2. By By Insulation Type
17.5.2.3. By By Shape
17.5.2.4. By Application
17.5.2.5. By End User
17.5.2.6. By Sales Channels
17.6. Germany
17.6.1. Pricing Analysis
17.6.2. Market Share Analysis, 2021
17.6.2.1. By By Properties
17.6.2.2. By By Insulation Type
17.6.2.3. By By Shape
17.6.2.4. By Application
17.6.2.5. By End User
17.6.2.6. By Sales Channels
17.7. Italy
17.7.1. Pricing Analysis
17.7.2. Market Share Analysis, 2021
17.7.2.1. By By Properties
17.7.2.2. By By Insulation Type
17.7.2.3. By By Shape
17.7.2.4. By Application
17.7.2.5. By End User
17.7.2.6. By Sales Channels
17.8. France
17.8.1. Pricing Analysis
17.8.2. Market Share Analysis, 2021
17.8.2.1. By By Properties
17.8.2.2. By By Insulation Type
17.8.2.3. By By Shape
17.8.2.4. By Application
17.8.2.5. By End User
17.8.2.6. By Sales Channels
17.9. U.K.
17.9.1. Pricing Analysis
17.9.2. Market Share Analysis, 2021
17.9.2.1. By By Properties
17.9.2.2. By By Insulation Type
17.9.2.3. By By Shape
17.9.2.4. By Application
17.9.2.5. By End User
17.9.2.6. By Sales Channels
17.10. Spain
17.10.1. Pricing Analysis
17.10.2. Market Share Analysis, 2021
17.10.2.1. By By Properties
17.10.2.2. By By Insulation Type
17.10.2.3. By By Shape
17.10.2.4. By Application
17.10.2.5. By End User
17.10.2.6. By Sales Channels
17.11. Russia
17.11.1. Pricing Analysis
17.11.2. Market Share Analysis, 2021
17.11.2.1. By By Properties
17.11.2.2. By By Insulation Type
17.11.2.3. By By Shape
17.11.2.4. By Application
17.11.2.5. By End User
17.11.2.6. By Sales Channels
17.12. BENELUX
17.12.1. Pricing Analysis
17.12.2. Market Share Analysis, 2021
17.12.2.1. By By Properties
17.12.2.2. By By Insulation Type
17.12.2.3. By By Shape
17.12.2.4. By Application
17.12.2.5. By End User
17.12.2.6. By Sales Channels
17.13. China
17.13.1. Pricing Analysis
17.13.2. Market Share Analysis, 2021
17.13.2.1. By By Properties
17.13.2.2. By By Insulation Type
17.13.2.3. By By Shape
17.13.2.4. By Application
17.13.2.5. By End User
17.13.2.6. By Sales Channels
17.14. Japan
17.14.1. Pricing Analysis
17.14.2. Market Share Analysis, 2021
17.14.2.1. By By Properties
17.14.2.2. By By Insulation Type
17.14.2.3. By By Shape
17.14.2.4. By Application
17.14.2.5. By End User
17.14.2.6. By Sales Channels
17.15. South Korea
17.15.1. Pricing Analysis
17.15.2. Market Share Analysis, 2021
17.15.2.1. By By Properties
17.15.2.2. By By Insulation Type
17.15.2.3. By By Shape
17.15.2.4. By Application
17.15.2.5. By End User
17.15.2.6. By Sales Channels
17.16. India
17.16.1. Pricing Analysis
17.16.2. Market Share Analysis, 2021
17.16.2.1. By By Properties
17.16.2.2. By By Insulation Type
17.16.2.3. By By Shape
17.16.2.4. By Application
17.16.2.5. By End User
17.16.2.6. By Sales Channels
17.17. GCC Countries
17.17.1. Pricing Analysis
17.17.2. Market Share Analysis, 2021
17.17.2.1. By By Properties
17.17.2.2. By By Insulation Type
17.17.2.3. By By Shape
17.17.2.4. By Application
17.17.2.5. By End User
17.17.2.6. By Sales Channels
18. Market Structure Analysis
18.1. Competition Dashboard
18.2. Competition Benchmarking
18.3. Market Share Analysis of Top Players
18.3.1. By Regional
18.3.2. By By Properties
18.3.3. By By Insulation Type
18.3.4. By By Shape
18.3.5. By Application
18.3.6. By End User
18.3.7. By Sales Channels
19. Competition Analysis
19.1. Competition Deep Dive
19.1.1. Oase Outdoors
19.1.1.1. Overview
19.1.1.2. Product Portfolio
19.1.1.3. Profitability by Market Segment
19.1.1.4. Sales Footprint
19.1.1.5. Strategy Overview
19.1.1.5.1. Marketing Strategy
19.1.1.5.2. Product Strategy
19.1.2. Big Agnes
19.1.2.1. Overview
19.1.2.2. Product Portfolio
19.1.2.3. Profitability by Market Segment
19.1.2.4. Sales Footprint
19.1.2.5. Strategy Overview
19.1.2.5.1. Marketing Strategy
19.1.2.5.2. Product Strategy
19.1.3. V F Corp
19.1.3.1. Overview
19.1.3.2. Product Portfolio
19.1.3.3. Profitability by Market Segment
19.1.3.4. Sales Footprint
19.1.3.5. Strategy Overview
19.1.3.5.1. Marketing Strategy
19.1.3.5.2. Product Strategy
19.1.4. Snugpak
19.1.4.1. Overview
19.1.4.2. Product Portfolio
19.1.4.3. Profitability by Market Segment
19.1.4.4. Sales Footprint
19.1.4.5. Strategy Overview
19.1.4.5.1. Marketing Strategy
19.1.4.5.2. Product Strategy
19.1.5. AMG Group
19.1.5.1. Overview
19.1.5.2. Product Portfolio
19.1.5.3. Profitability by Market Segment
19.1.5.4. Sales Footprint
19.1.5.5. Strategy Overview
19.1.5.5.1. Marketing Strategy
19.1.5.5.2. Product Strategy
19.1.6. Jack Wolfskin
19.1.6.1. Overview
19.1.6.2. Product Portfolio
19.1.6.3. Profitability by Market Segment
19.1.6.4. Sales Footprint
19.1.6.5. Strategy Overview
19.1.6.5.1. Marketing Strategy
19.1.6.5.2. Product Strategy
19.1.7. Columbia Sportswear
19.1.7.1. Overview
19.1.7.2. Product Portfolio
19.1.7.3. Profitability by Market Segment
19.1.7.4. Sales Footprint
19.1.7.5. Strategy Overview
19.1.7.5.1. Marketing Strategy
19.1.7.5.2. Product Strategy
19.1.8. Exxel Outdoors
19.1.8.1. Overview
19.1.8.2. Product Portfolio
19.1.8.3. Profitability by Market Segment
19.1.8.4. Sales Footprint
19.1.8.5. Strategy Overview
19.1.8.5.1. Marketing Strategy
19.1.8.5.2. Product Strategy
19.1.9. Gelert
19.1.9.1. Overview
19.1.9.2. Product Portfolio
19.1.9.3. Profitability by Market Segment
19.1.9.4. Sales Footprint
19.1.9.5. Strategy Overview
19.1.9.5.1. Marketing Strategy
19.1.9.5.2. Product Strategy
19.1.10. Oase Outdoors
19.1.10.1. Overview
19.1.10.2. Product Portfolio
19.1.10.3. Profitability by Market Segment
19.1.10.4. Sales Footprint
19.1.10.5. Strategy Overview
19.1.10.5.1. Marketing Strategy
19.1.10.5.2. Product Strategy
19.1.11. Big Agnes
19.1.11.1. Overview
19.1.11.2. Product Portfolio
19.1.11.3. Profitability by Market Segment
19.1.11.4. Sales Footprint
19.1.11.5. Strategy Overview
19.1.11.5.1. Marketing Strategy
19.1.11.5.2. Product Strategy
19.1.12. Columbia Sportswear
19.1.12.1. Overview
19.1.12.2. Product Portfolio
19.1.12.3. Profitability by Market Segment
19.1.12.4. Sales Footprint
19.1.12.5. Strategy Overview
19.1.12.5.1. Marketing Strategy
19.1.12.5.2. Product Strategy
19.1.13. Exxel Outdoors
19.1.13.1. Overview
19.1.13.2. Product Portfolio
19.1.13.3. Profitability by Market Segment
19.1.13.4. Sales Footprint
19.1.13.5. Strategy Overview
19.1.13.5.1. Marketing Strategy
19.1.13.5.2. Product Strategy
19.1.14. Jack Wolfskin
19.1.14.1. Overview
19.1.14.2. Product Portfolio
19.1.14.3. Profitability by Market Segment
19.1.14.4. Sales Footprint
19.1.14.5. Strategy Overview
19.1.14.5.1. Marketing Strategy
19.1.14.5.2. Product Strategy
19.1.15. Snugpak
19.1.15.1. Overview
19.1.15.2. Product Portfolio
19.1.15.3. Profitability by Market Segment
19.1.15.4. Sales Footprint
19.1.15.5. Strategy Overview
19.1.15.5.1. Marketing Strategy
19.1.15.5.2. Product Strategy
19.1.16. Vaude
19.1.16.1. Overview
19.1.16.2. Product Portfolio
19.1.16.3. Profitability by Market Segment
19.1.16.4. Sales Footprint
19.1.16.5. Strategy Overview
19.1.16.5.1. Marketing Strategy
19.1.16.5.2. Product Strategy
19.1.17. Johnson Outdoors
19.1.17.1. Overview
19.1.17.2. Product Portfolio
19.1.17.3. Profitability by Market Segment
19.1.17.4. Sales Footprint
19.1.17.5. Strategy Overview
19.1.17.5.1. Marketing Strategy
19.1.17.5.2. Product Strategy
20. Assumptions & Acronyms Used
21. Research Methodology
Let us know your requirement to get
100% FREE customization
Table 1: Global Sleeping Bags Market Value (US$ Mn) Forecast by Region, 2017-2032
Table 2: Global Sleeping Bags Market Volume(Mn units) Forecast by Region, 2017-2032
Table 3: Global Sleeping Bags Market Value (US$ Mn) Forecast by By Properties , 2017-2032
Table 4: Global Sleeping Bags Market Volume(Mn units) Forecast by By Properties , 2017-2032
Table 5: Global Sleeping Bags Market Value (US$ Mn) Forecast by By Insulation Type, 2017-2032
Table 6: Global Sleeping Bags Market Volume(Mn units) Forecast by By Insulation Type, 2017-2032
Table 7: Global Sleeping Bags Market Value (US$ Mn) Forecast by By Shape, 2017-2032
Table 8: Global Sleeping Bags Market Volume(Mn units) Forecast by By Shape, 2017-2032
Table 9: Global Sleeping Bags Market Value (US$ Mn) Forecast by Application, 2017-2032
Table 10: Global Sleeping Bags Market Volume(Mn units) Forecast by Application, 2017-2032
Table 11: Global Sleeping Bags Market Value (US$ Mn) Forecast by End User, 2017-2032
Table 12: Global Sleeping Bags Market Volume(Mn units) Forecast by End User, 2017-2032
Table 13: Global Sleeping Bags Market Value (US$ Mn) Forecast by Sales Channels , 2017-2032
Table 14: Global Sleeping Bags Market Volume(Mn units) Forecast by Sales Channels , 2017-2032
Table 15: North America Sleeping Bags Market Value (US$ Mn) Forecast by Country, 2017-2032
Table 16: North America Sleeping Bags Market Volume(Mn units) Forecast by Country, 2017-2032
Table 17: North America Sleeping Bags Market Value (US$ Mn) Forecast by By Properties , 2017-2032
Table 18: North America Sleeping Bags Market Volume(Mn units) Forecast by By Properties , 2017-2032
Table 19: North America Sleeping Bags Market Value (US$ Mn) Forecast by By Insulation Type, 2017-2032
Table 20: North America Sleeping Bags Market Volume(Mn units) Forecast by By Insulation Type, 2017-2032
Table 21: North America Sleeping Bags Market Value (US$ Mn) Forecast by By Shape, 2017-2032
Table 22: North America Sleeping Bags Market Volume(Mn units) Forecast by By Shape, 2017-2032
Table 23: North America Sleeping Bags Market Value (US$ Mn) Forecast by Application, 2017-2032
Table 24: North America Sleeping Bags Market Volume(Mn units) Forecast by Application, 2017-2032
Table 25: North America Sleeping Bags Market Value (US$ Mn) Forecast by End User, 2017-2032
Table 26: North America Sleeping Bags Market Volume(Mn units) Forecast by End User, 2017-2032
Table 27: North America Sleeping Bags Market Value (US$ Mn) Forecast by Sales Channels , 2017-2032
Table 28: North America Sleeping Bags Market Volume(Mn units) Forecast by Sales Channels , 2017-2032
Table 29: Latin America Sleeping Bags Market Value (US$ Mn) Forecast by Country, 2017-2032
Table 30: Latin America Sleeping Bags Market Volume(Mn units) Forecast by Country, 2017-2032
Table 31: Latin America Sleeping Bags Market Value (US$ Mn) Forecast by By Properties , 2017-2032
Table 32: Latin America Sleeping Bags Market Volume(Mn units) Forecast by By Properties , 2017-2032
Table 33: Latin America Sleeping Bags Market Value (US$ Mn) Forecast by By Insulation Type, 2017-2032
Table 34: Latin America Sleeping Bags Market Volume(Mn units) Forecast by By Insulation Type, 2017-2032
Table 35: Latin America Sleeping Bags Market Value (US$ Mn) Forecast by By Shape, 2017-2032
Table 36: Latin America Sleeping Bags Market Volume(Mn units) Forecast by By Shape, 2017-2032
Table 37: Latin America Sleeping Bags Market Value (US$ Mn) Forecast by Application, 2017-2032
Table 38: Latin America Sleeping Bags Market Volume(Mn units) Forecast by Application, 2017-2032
Table 39: Latin America Sleeping Bags Market Value (US$ Mn) Forecast by End User, 2017-2032
Table 40: Latin America Sleeping Bags Market Volume(Mn units) Forecast by End User, 2017-2032
Table 41: Latin America Sleeping Bags Market Value (US$ Mn) Forecast by Sales Channels , 2017-2032
Table 42: Latin America Sleeping Bags Market Volume(Mn units) Forecast by Sales Channels , 2017-2032
Table 43: Europe Sleeping Bags Market Value (US$ Mn) Forecast by Country, 2017-2032
Table 44: Europe Sleeping Bags Market Volume(Mn units) Forecast by Country, 2017-2032
Table 45: Europe Sleeping Bags Market Value (US$ Mn) Forecast by By Properties , 2017-2032
Table 46: Europe Sleeping Bags Market Volume(Mn units) Forecast by By Properties , 2017-2032
Table 47: Europe Sleeping Bags Market Value (US$ Mn) Forecast by By Insulation Type, 2017-2032
Table 48: Europe Sleeping Bags Market Volume(Mn units) Forecast by By Insulation Type, 2017-2032
Table 49: Europe Sleeping Bags Market Value (US$ Mn) Forecast by By Shape, 2017-2032
Table 50: Europe Sleeping Bags Market Volume(Mn units) Forecast by By Shape, 2017-2032
Table 51: Europe Sleeping Bags Market Value (US$ Mn) Forecast by Application, 2017-2032
Table 52: Europe Sleeping Bags Market Volume(Mn units) Forecast by Application, 2017-2032
Table 53: Europe Sleeping Bags Market Value (US$ Mn) Forecast by End User, 2017-2032
Table 54: Europe Sleeping Bags Market Volume(Mn units) Forecast by End User, 2017-2032
Table 55: Europe Sleeping Bags Market Value (US$ Mn) Forecast by Sales Channels , 2017-2032
Table 56: Europe Sleeping Bags Market Volume(Mn units) Forecast by Sales Channels , 2017-2032
Table 57: Asia Pacific Sleeping Bags Market Value (US$ Mn) Forecast by Country, 2017-2032
Table 58: Asia Pacific Sleeping Bags Market Volume(Mn units) Forecast by Country, 2017-2032
Table 59: Asia Pacific Sleeping Bags Market Value (US$ Mn) Forecast by By Properties , 2017-2032
Table 60: Asia Pacific Sleeping Bags Market Volume(Mn units) Forecast by By Properties , 2017-2032
Table 61: Asia Pacific Sleeping Bags Market Value (US$ Mn) Forecast by By Insulation Type, 2017-2032
Table 62: Asia Pacific Sleeping Bags Market Volume(Mn units) Forecast by By Insulation Type, 2017-2032
Table 63: Asia Pacific Sleeping Bags Market Value (US$ Mn) Forecast by By Shape, 2017-2032
Table 64: Asia Pacific Sleeping Bags Market Volume(Mn units) Forecast by By Shape, 2017-2032
Table 65: Asia Pacific Sleeping Bags Market Value (US$ Mn) Forecast by Application, 2017-2032
Table 66: Asia Pacific Sleeping Bags Market Volume(Mn units) Forecast by Application, 2017-2032
Table 67: Asia Pacific Sleeping Bags Market Value (US$ Mn) Forecast by End User, 2017-2032
Table 68: Asia Pacific Sleeping Bags Market Volume(Mn units) Forecast by End User, 2017-2032
Table 69: Asia Pacific Sleeping Bags Market Value (US$ Mn) Forecast by Sales Channels , 2017-2032
Table 70: Asia Pacific Sleeping Bags Market Volume(Mn units) Forecast by Sales Channels , 2017-2032
Table 71: MEA Sleeping Bags Market Value (US$ Mn) Forecast by Country, 2017-2032
Table 72: MEA Sleeping Bags Market Volume(Mn units) Forecast by Country, 2017-2032
Table 73: MEA Sleeping Bags Market Value (US$ Mn) Forecast by By Properties , 2017-2032
Table 74: MEA Sleeping Bags Market Volume(Mn units) Forecast by By Properties , 2017-2032
Table 75: MEA Sleeping Bags Market Value (US$ Mn) Forecast by By Insulation Type, 2017-2032
Table 76: MEA Sleeping Bags Market Volume(Mn units) Forecast by By Insulation Type, 2017-2032
Table 77: MEA Sleeping Bags Market Value (US$ Mn) Forecast by By Shape, 2017-2032
Table 78: MEA Sleeping Bags Market Volume(Mn units) Forecast by By Shape, 2017-2032
Table 79: MEA Sleeping Bags Market Value (US$ Mn) Forecast by Application, 2017-2032
Table 80: MEA Sleeping Bags Market Volume(Mn units) Forecast by Application, 2017-2032
Table 81: MEA Sleeping Bags Market Value (US$ Mn) Forecast by End User, 2017-2032
Table 82: MEA Sleeping Bags Market Volume(Mn units) Forecast by End User, 2017-2032
Table 83: MEA Sleeping Bags Market Value (US$ Mn) Forecast by Sales Channels , 2017-2032
Table 84: MEA Sleeping Bags Market Volume(Mn units) Forecast by Sales Channels , 2017-2032
Find your sweet spots for generating winning opportunities in this market.
Talk to AnalystFigure 1: Global Sleeping Bags Market Value (US$ Mn) by By Properties , 2022-2032
Figure 2: Global Sleeping Bags Market Value (US$ Mn) by By Insulation Type, 2022-2032
Figure 3: Global Sleeping Bags Market Value (US$ Mn) by By Shape, 2022-2032
Figure 4: Global Sleeping Bags Market Value (US$ Mn) by Application, 2022-2032
Figure 5: Global Sleeping Bags Market Value (US$ Mn) by End User, 2022-2032
Figure 6: Global Sleeping Bags Market Value (US$ Mn) by Sales Channels , 2022-2032
Figure 7: Global Sleeping Bags Market Value (US$ Mn) by Region, 2022-2032
Figure 8: Global Sleeping Bags Market Value (US$ Mn) Analysis by Region, 2017-2032
Figure 9: Global Sleeping Bags Market Volume(Mn units) Analysis by Region, 2017-2032
Figure 10: Global Sleeping Bags Market Value Share (%) and BPS Analysis by Region, 2022-2032
Figure 11: Global Sleeping Bags Market Y-o-Y Growth (%) Projections by Region, 2022-2032
Figure 12: Global Sleeping Bags Market Value (US$ Mn) Analysis by By Properties , 2017-2032
Figure 13: Global Sleeping Bags Market Volume(Mn units) Analysis by By Properties , 2017-2032
Figure 14: Global Sleeping Bags Market Value Share (%) and BPS Analysis by By Properties , 2022-2032
Figure 15: Global Sleeping Bags Market Y-o-Y Growth (%) Projections by By Properties , 2022-2032
Figure 16: Global Sleeping Bags Market Value (US$ Mn) Analysis by By Insulation Type, 2017-2032
Figure 17: Global Sleeping Bags Market Volume(Mn units) Analysis by By Insulation Type, 2017-2032
Figure 18: Global Sleeping Bags Market Value Share (%) and BPS Analysis by By Insulation Type, 2022-2032
Figure 19: Global Sleeping Bags Market Y-o-Y Growth (%) Projections by By Insulation Type, 2022-2032
Figure 20: Global Sleeping Bags Market Value (US$ Mn) Analysis by By Shape, 2017-2032
Figure 21: Global Sleeping Bags Market Volume(Mn units) Analysis by By Shape, 2017-2032
Figure 22: Global Sleeping Bags Market Value Share (%) and BPS Analysis by By Shape, 2022-2032
Figure 23: Global Sleeping Bags Market Y-o-Y Growth (%) Projections by By Shape, 2022-2032
Figure 24: Global Sleeping Bags Market Value (US$ Mn) Analysis by Application, 2017-2032
Figure 25: Global Sleeping Bags Market Volume(Mn units) Analysis by Application, 2017-2032
Figure 26: Global Sleeping Bags Market Value Share (%) and BPS Analysis by Application, 2022-2032
Figure 27: Global Sleeping Bags Market Y-o-Y Growth (%) Projections by Application, 2022-2032
Figure 28: Global Sleeping Bags Market Value (US$ Mn) Analysis by End User, 2017-2032
Figure 29: Global Sleeping Bags Market Volume(Mn units) Analysis by End User, 2017-2032
Figure 30: Global Sleeping Bags Market Value Share (%) and BPS Analysis by End User, 2022-2032
Figure 31: Global Sleeping Bags Market Y-o-Y Growth (%) Projections by End User, 2022-2032
Figure 32: Global Sleeping Bags Market Value (US$ Mn) Analysis by Sales Channels , 2017-2032
Figure 33: Global Sleeping Bags Market Volume(Mn units) Analysis by Sales Channels , 2017-2032
Figure 34: Global Sleeping Bags Market Value Share (%) and BPS Analysis by Sales Channels , 2022-2032
Figure 35: Global Sleeping Bags Market Y-o-Y Growth (%) Projections by Sales Channels , 2022-2032
Figure 36: Global Sleeping Bags Market Attractiveness by By Properties , 2022-2032
Figure 37: Global Sleeping Bags Market Attractiveness by By Insulation Type, 2022-2032
Figure 38: Global Sleeping Bags Market Attractiveness by By Shape, 2022-2032
Figure 39: Global Sleeping Bags Market Attractiveness by Application, 2022-2032
Figure 40: Global Sleeping Bags Market Attractiveness by End User, 2022-2032
Figure 41: Global Sleeping Bags Market Attractiveness by Sales Channels , 2022-2032
Figure 42: Global Sleeping Bags Market Attractiveness by Region, 2022-2032
Figure 43: North America Sleeping Bags Market Value (US$ Mn) by By Properties , 2022-2032
Figure 44: North America Sleeping Bags Market Value (US$ Mn) by By Insulation Type, 2022-2032
Figure 45: North America Sleeping Bags Market Value (US$ Mn) by By Shape, 2022-2032
Figure 46: North America Sleeping Bags Market Value (US$ Mn) by Application, 2022-2032
Figure 47: North America Sleeping Bags Market Value (US$ Mn) by End User, 2022-2032
Figure 48: North America Sleeping Bags Market Value (US$ Mn) by Sales Channels , 2022-2032
Figure 49: North America Sleeping Bags Market Value (US$ Mn) by Country, 2022-2032
Figure 50: North America Sleeping Bags Market Value (US$ Mn) Analysis by Country, 2017-2032
Figure 51: North America Sleeping Bags Market Volume(Mn units) Analysis by Country, 2017-2032
Figure 52: North America Sleeping Bags Market Value Share (%) and BPS Analysis by Country, 2022-2032
Figure 53: North America Sleeping Bags Market Y-o-Y Growth (%) Projections by Country, 2022-2032
Figure 54: North America Sleeping Bags Market Value (US$ Mn) Analysis by By Properties , 2017-2032
Figure 55: North America Sleeping Bags Market Volume(Mn units) Analysis by By Properties , 2017-2032
Figure 56: North America Sleeping Bags Market Value Share (%) and BPS Analysis by By Properties , 2022-2032
Figure 57: North America Sleeping Bags Market Y-o-Y Growth (%) Projections by By Properties , 2022-2032
Figure 58: North America Sleeping Bags Market Value (US$ Mn) Analysis by By Insulation Type, 2017-2032
Figure 59: North America Sleeping Bags Market Volume(Mn units) Analysis by By Insulation Type, 2017-2032
Figure 60: North America Sleeping Bags Market Value Share (%) and BPS Analysis by By Insulation Type, 2022-2032
Figure 61: North America Sleeping Bags Market Y-o-Y Growth (%) Projections by By Insulation Type, 2022-2032
Figure 62: North America Sleeping Bags Market Value (US$ Mn) Analysis by By Shape, 2017-2032
Figure 63: North America Sleeping Bags Market Volume(Mn units) Analysis by By Shape, 2017-2032
Figure 64: North America Sleeping Bags Market Value Share (%) and BPS Analysis by By Shape, 2022-2032
Figure 65: North America Sleeping Bags Market Y-o-Y Growth (%) Projections by By Shape, 2022-2032
Figure 66: North America Sleeping Bags Market Value (US$ Mn) Analysis by Application, 2017-2032
Figure 67: North America Sleeping Bags Market Volume(Mn units) Analysis by Application, 2017-2032
Figure 68: North America Sleeping Bags Market Value Share (%) and BPS Analysis by Application, 2022-2032
Figure 69: North America Sleeping Bags Market Y-o-Y Growth (%) Projections by Application, 2022-2032
Figure 70: North America Sleeping Bags Market Value (US$ Mn) Analysis by End User, 2017-2032
Figure 71: North America Sleeping Bags Market Volume(Mn units) Analysis by End User, 2017-2032
Figure 72: North America Sleeping Bags Market Value Share (%) and BPS Analysis by End User, 2022-2032
Figure 73: North America Sleeping Bags Market Y-o-Y Growth (%) Projections by End User, 2022-2032
Figure 74: North America Sleeping Bags Market Value (US$ Mn) Analysis by Sales Channels , 2017-2032
Figure 75: North America Sleeping Bags Market Volume(Mn units) Analysis by Sales Channels , 2017-2032
Figure 76: North America Sleeping Bags Market Value Share (%) and BPS Analysis by Sales Channels , 2022-2032
Figure 77: North America Sleeping Bags Market Y-o-Y Growth (%) Projections by Sales Channels , 2022-2032
Figure 78: North America Sleeping Bags Market Attractiveness by By Properties , 2022-2032
Figure 79: North America Sleeping Bags Market Attractiveness by By Insulation Type, 2022-2032
Figure 80: North America Sleeping Bags Market Attractiveness by By Shape, 2022-2032
Figure 81: North America Sleeping Bags Market Attractiveness by Application, 2022-2032
Figure 82: North America Sleeping Bags Market Attractiveness by End User, 2022-2032
Figure 83: North America Sleeping Bags Market Attractiveness by Sales Channels , 2022-2032
Figure 84: North America Sleeping Bags Market Attractiveness by Country, 2022-2032
Figure 85: Latin America Sleeping Bags Market Value (US$ Mn) by By Properties , 2022-2032
Figure 86: Latin America Sleeping Bags Market Value (US$ Mn) by By Insulation Type, 2022-2032
Figure 87: Latin America Sleeping Bags Market Value (US$ Mn) by By Shape, 2022-2032
Figure 88: Latin America Sleeping Bags Market Value (US$ Mn) by Application, 2022-2032
Figure 89: Latin America Sleeping Bags Market Value (US$ Mn) by End User, 2022-2032
Figure 90: Latin America Sleeping Bags Market Value (US$ Mn) by Sales Channels , 2022-2032
Figure 91: Latin America Sleeping Bags Market Value (US$ Mn) by Country, 2022-2032
Figure 92: Latin America Sleeping Bags Market Value (US$ Mn) Analysis by Country, 2017-2032
Figure 93: Latin America Sleeping Bags Market Volume(Mn units) Analysis by Country, 2017-2032
Figure 94: Latin America Sleeping Bags Market Value Share (%) and BPS Analysis by Country, 2022-2032
Figure 95: Latin America Sleeping Bags Market Y-o-Y Growth (%) Projections by Country, 2022-2032
Figure 96: Latin America Sleeping Bags Market Value (US$ Mn) Analysis by By Properties , 2017-2032
Figure 97: Latin America Sleeping Bags Market Volume(Mn units) Analysis by By Properties , 2017-2032
Figure 98: Latin America Sleeping Bags Market Value Share (%) and BPS Analysis by By Properties , 2022-2032
Figure 99: Latin America Sleeping Bags Market Y-o-Y Growth (%) Projections by By Properties , 2022-2032
Figure 100: Latin America Sleeping Bags Market Value (US$ Mn) Analysis by By Insulation Type, 2017-2032
Figure 101: Latin America Sleeping Bags Market Volume(Mn units) Analysis by By Insulation Type, 2017-2032
Figure 102: Latin America Sleeping Bags Market Value Share (%) and BPS Analysis by By Insulation Type, 2022-2032
Figure 103: Latin America Sleeping Bags Market Y-o-Y Growth (%) Projections by By Insulation Type, 2022-2032
Figure 104: Latin America Sleeping Bags Market Value (US$ Mn) Analysis by By Shape, 2017-2032
Figure 105: Latin America Sleeping Bags Market Volume(Mn units) Analysis by By Shape, 2017-2032
Figure 106: Latin America Sleeping Bags Market Value Share (%) and BPS Analysis by By Shape, 2022-2032
Figure 107: Latin America Sleeping Bags Market Y-o-Y Growth (%) Projections by By Shape, 2022-2032
Figure 108: Latin America Sleeping Bags Market Value (US$ Mn) Analysis by Application, 2017-2032
Figure 109: Latin America Sleeping Bags Market Volume(Mn units) Analysis by Application, 2017-2032
Figure 110: Latin America Sleeping Bags Market Value Share (%) and BPS Analysis by Application, 2022-2032
Figure 111: Latin America Sleeping Bags Market Y-o-Y Growth (%) Projections by Application, 2022-2032
Figure 112: Latin America Sleeping Bags Market Value (US$ Mn) Analysis by End User, 2017-2032
Figure 113: Latin America Sleeping Bags Market Volume(Mn units) Analysis by End User, 2017-2032
Figure 114: Latin America Sleeping Bags Market Value Share (%) and BPS Analysis by End User, 2022-2032
Figure 115: Latin America Sleeping Bags Market Y-o-Y Growth (%) Projections by End User, 2022-2032
Figure 116: Latin America Sleeping Bags Market Value (US$ Mn) Analysis by Sales Channels , 2017-2032
Figure 117: Latin America Sleeping Bags Market Volume(Mn units) Analysis by Sales Channels , 2017-2032
Figure 118: Latin America Sleeping Bags Market Value Share (%) and BPS Analysis by Sales Channels , 2022-2032
Figure 119: Latin America Sleeping Bags Market Y-o-Y Growth (%) Projections by Sales Channels , 2022-2032
Figure 120: Latin America Sleeping Bags Market Attractiveness by By Properties , 2022-2032
Figure 121: Latin America Sleeping Bags Market Attractiveness by By Insulation Type, 2022-2032
Figure 122: Latin America Sleeping Bags Market Attractiveness by By Shape, 2022-2032
Figure 123: Latin America Sleeping Bags Market Attractiveness by Application, 2022-2032
Figure 124: Latin America Sleeping Bags Market Attractiveness by End User, 2022-2032
Figure 125: Latin America Sleeping Bags Market Attractiveness by Sales Channels , 2022-2032
Figure 126: Latin America Sleeping Bags Market Attractiveness by Country, 2022-2032
Figure 127: Europe Sleeping Bags Market Value (US$ Mn) by By Properties , 2022-2032
Figure 128: Europe Sleeping Bags Market Value (US$ Mn) by By Insulation Type, 2022-2032
Figure 129: Europe Sleeping Bags Market Value (US$ Mn) by By Shape, 2022-2032
Figure 130: Europe Sleeping Bags Market Value (US$ Mn) by Application, 2022-2032
Figure 131: Europe Sleeping Bags Market Value (US$ Mn) by End User, 2022-2032
Figure 132: Europe Sleeping Bags Market Value (US$ Mn) by Sales Channels , 2022-2032
Figure 133: Europe Sleeping Bags Market Value (US$ Mn) by Country, 2022-2032
Figure 134: Europe Sleeping Bags Market Value (US$ Mn) Analysis by Country, 2017-2032
Figure 135: Europe Sleeping Bags Market Volume(Mn units) Analysis by Country, 2017-2032
Figure 136: Europe Sleeping Bags Market Value Share (%) and BPS Analysis by Country, 2022-2032
Figure 137: Europe Sleeping Bags Market Y-o-Y Growth (%) Projections by Country, 2022-2032
Figure 138: Europe Sleeping Bags Market Value (US$ Mn) Analysis by By Properties , 2017-2032
Figure 139: Europe Sleeping Bags Market Volume(Mn units) Analysis by By Properties , 2017-2032
Figure 140: Europe Sleeping Bags Market Value Share (%) and BPS Analysis by By Properties , 2022-2032
Figure 141: Europe Sleeping Bags Market Y-o-Y Growth (%) Projections by By Properties , 2022-2032
Figure 142: Europe Sleeping Bags Market Value (US$ Mn) Analysis by By Insulation Type, 2017-2032
Figure 143: Europe Sleeping Bags Market Volume(Mn units) Analysis by By Insulation Type, 2017-2032
Figure 144: Europe Sleeping Bags Market Value Share (%) and BPS Analysis by By Insulation Type, 2022-2032
Figure 145: Europe Sleeping Bags Market Y-o-Y Growth (%) Projections by By Insulation Type, 2022-2032
Figure 146: Europe Sleeping Bags Market Value (US$ Mn) Analysis by By Shape, 2017-2032
Figure 147: Europe Sleeping Bags Market Volume(Mn units) Analysis by By Shape, 2017-2032
Figure 148: Europe Sleeping Bags Market Value Share (%) and BPS Analysis by By Shape, 2022-2032
Figure 149: Europe Sleeping Bags Market Y-o-Y Growth (%) Projections by By Shape, 2022-2032
Figure 150: Europe Sleeping Bags Market Value (US$ Mn) Analysis by Application, 2017-2032
Figure 151: Europe Sleeping Bags Market Volume(Mn units) Analysis by Application, 2017-2032
Figure 152: Europe Sleeping Bags Market Value Share (%) and BPS Analysis by Application, 2022-2032
Figure 153: Europe Sleeping Bags Market Y-o-Y Growth (%) Projections by Application, 2022-2032
Figure 154: Europe Sleeping Bags Market Value (US$ Mn) Analysis by End User, 2017-2032
Figure 155: Europe Sleeping Bags Market Volume(Mn units) Analysis by End User, 2017-2032
Figure 156: Europe Sleeping Bags Market Value Share (%) and BPS Analysis by End User, 2022-2032
Figure 157: Europe Sleeping Bags Market Y-o-Y Growth (%) Projections by End User, 2022-2032
Figure 158: Europe Sleeping Bags Market Value (US$ Mn) Analysis by Sales Channels , 2017-2032
Figure 159: Europe Sleeping Bags Market Volume(Mn units) Analysis by Sales Channels , 2017-2032
Figure 160: Europe Sleeping Bags Market Value Share (%) and BPS Analysis by Sales Channels , 2022-2032
Figure 161: Europe Sleeping Bags Market Y-o-Y Growth (%) Projections by Sales Channels , 2022-2032
Figure 162: Europe Sleeping Bags Market Attractiveness by By Properties , 2022-2032
Figure 163: Europe Sleeping Bags Market Attractiveness by By Insulation Type, 2022-2032
Figure 164: Europe Sleeping Bags Market Attractiveness by By Shape, 2022-2032
Figure 165: Europe Sleeping Bags Market Attractiveness by Application, 2022-2032
Figure 166: Europe Sleeping Bags Market Attractiveness by End User, 2022-2032
Figure 167: Europe Sleeping Bags Market Attractiveness by Sales Channels , 2022-2032
Figure 168: Europe Sleeping Bags Market Attractiveness by Country, 2022-2032
Figure 169: Asia Pacific Sleeping Bags Market Value (US$ Mn) by By Properties , 2022-2032
Figure 170: Asia Pacific Sleeping Bags Market Value (US$ Mn) by By Insulation Type, 2022-2032
Figure 171: Asia Pacific Sleeping Bags Market Value (US$ Mn) by By Shape, 2022-2032
Figure 172: Asia Pacific Sleeping Bags Market Value (US$ Mn) by Application, 2022-2032
Figure 173: Asia Pacific Sleeping Bags Market Value (US$ Mn) by End User, 2022-2032
Figure 174: Asia Pacific Sleeping Bags Market Value (US$ Mn) by Sales Channels , 2022-2032
Figure 175: Asia Pacific Sleeping Bags Market Value (US$ Mn) by Country, 2022-2032
Figure 176: Asia Pacific Sleeping Bags Market Value (US$ Mn) Analysis by Country, 2017-2032
Figure 177: Asia Pacific Sleeping Bags Market Volume(Mn units) Analysis by Country, 2017-2032
Figure 178: Asia Pacific Sleeping Bags Market Value Share (%) and BPS Analysis by Country, 2022-2032
Figure 179: Asia Pacific Sleeping Bags Market Y-o-Y Growth (%) Projections by Country, 2022-2032
Figure 180: Asia Pacific Sleeping Bags Market Value (US$ Mn) Analysis by By Properties , 2017-2032
Figure 181: Asia Pacific Sleeping Bags Market Volume(Mn units) Analysis by By Properties , 2017-2032
Figure 182: Asia Pacific Sleeping Bags Market Value Share (%) and BPS Analysis by By Properties , 2022-2032
Figure 183: Asia Pacific Sleeping Bags Market Y-o-Y Growth (%) Projections by By Properties , 2022-2032
Figure 184: Asia Pacific Sleeping Bags Market Value (US$ Mn) Analysis by By Insulation Type, 2017-2032
Figure 185: Asia Pacific Sleeping Bags Market Volume(Mn units) Analysis by By Insulation Type, 2017-2032
Figure 186: Asia Pacific Sleeping Bags Market Value Share (%) and BPS Analysis by By Insulation Type, 2022-2032
Figure 187: Asia Pacific Sleeping Bags Market Y-o-Y Growth (%) Projections by By Insulation Type, 2022-2032
Figure 188: Asia Pacific Sleeping Bags Market Value (US$ Mn) Analysis by By Shape, 2017-2032
Figure 189: Asia Pacific Sleeping Bags Market Volume(Mn units) Analysis by By Shape, 2017-2032
Figure 190: Asia Pacific Sleeping Bags Market Value Share (%) and BPS Analysis by By Shape, 2022-2032
Figure 191: Asia Pacific Sleeping Bags Market Y-o-Y Growth (%) Projections by By Shape, 2022-2032
Figure 192: Asia Pacific Sleeping Bags Market Value (US$ Mn) Analysis by Application, 2017-2032
Figure 193: Asia Pacific Sleeping Bags Market Volume(Mn units) Analysis by Application, 2017-2032
Figure 194: Asia Pacific Sleeping Bags Market Value Share (%) and BPS Analysis by Application, 2022-2032
Figure 195: Asia Pacific Sleeping Bags Market Y-o-Y Growth (%) Projections by Application, 2022-2032
Figure 196: Asia Pacific Sleeping Bags Market Value (US$ Mn) Analysis by End User, 2017-2032
Figure 197: Asia Pacific Sleeping Bags Market Volume(Mn units) Analysis by End User, 2017-2032
Figure 198: Asia Pacific Sleeping Bags Market Value Share (%) and BPS Analysis by End User, 2022-2032
Figure 199: Asia Pacific Sleeping Bags Market Y-o-Y Growth (%) Projections by End User, 2022-2032
Figure 200: Asia Pacific Sleeping Bags Market Value (US$ Mn) Analysis by Sales Channels , 2017-2032
Figure 201: Asia Pacific Sleeping Bags Market Volume(Mn units) Analysis by Sales Channels , 2017-2032
Figure 202: Asia Pacific Sleeping Bags Market Value Share (%) and BPS Analysis by Sales Channels , 2022-2032
Figure 203: Asia Pacific Sleeping Bags Market Y-o-Y Growth (%) Projections by Sales Channels , 2022-2032
Figure 204: Asia Pacific Sleeping Bags Market Attractiveness by By Properties , 2022-2032
Figure 205: Asia Pacific Sleeping Bags Market Attractiveness by By Insulation Type, 2022-2032
Figure 206: Asia Pacific Sleeping Bags Market Attractiveness by By Shape, 2022-2032
Figure 207: Asia Pacific Sleeping Bags Market Attractiveness by Application, 2022-2032
Figure 208: Asia Pacific Sleeping Bags Market Attractiveness by End User, 2022-2032
Figure 209: Asia Pacific Sleeping Bags Market Attractiveness by Sales Channels , 2022-2032
Figure 210: Asia Pacific Sleeping Bags Market Attractiveness by Country, 2022-2032
Figure 211: MEA Sleeping Bags Market Value (US$ Mn) by By Properties , 2022-2032
Figure 212: MEA Sleeping Bags Market Value (US$ Mn) by By Insulation Type, 2022-2032
Figure 213: MEA Sleeping Bags Market Value (US$ Mn) by By Shape, 2022-2032
Figure 214: MEA Sleeping Bags Market Value (US$ Mn) by Application, 2022-2032
Figure 215: MEA Sleeping Bags Market Value (US$ Mn) by End User, 2022-2032
Figure 216: MEA Sleeping Bags Market Value (US$ Mn) by Sales Channels , 2022-2032
Figure 217: MEA Sleeping Bags Market Value (US$ Mn) by Country, 2022-2032
Figure 218: MEA Sleeping Bags Market Value (US$ Mn) Analysis by Country, 2017-2032
Figure 219: MEA Sleeping Bags Market Volume(Mn units) Analysis by Country, 2017-2032
Figure 220: MEA Sleeping Bags Market Value Share (%) and BPS Analysis by Country, 2022-2032
Figure 221: MEA Sleeping Bags Market Y-o-Y Growth (%) Projections by Country, 2022-2032
Figure 222: MEA Sleeping Bags Market Value (US$ Mn) Analysis by By Properties , 2017-2032
Figure 223: MEA Sleeping Bags Market Volume(Mn units) Analysis by By Properties , 2017-2032
Figure 224: MEA Sleeping Bags Market Value Share (%) and BPS Analysis by By Properties , 2022-2032
Figure 225: MEA Sleeping Bags Market Y-o-Y Growth (%) Projections by By Properties , 2022-2032
Figure 226: MEA Sleeping Bags Market Value (US$ Mn) Analysis by By Insulation Type, 2017-2032
Figure 227: MEA Sleeping Bags Market Volume(Mn units) Analysis by By Insulation Type, 2017-2032
Figure 228: MEA Sleeping Bags Market Value Share (%) and BPS Analysis by By Insulation Type, 2022-2032
Figure 229: MEA Sleeping Bags Market Y-o-Y Growth (%) Projections by By Insulation Type, 2022-2032
Figure 230: MEA Sleeping Bags Market Value (US$ Mn) Analysis by By Shape, 2017-2032
Figure 231: MEA Sleeping Bags Market Volume(Mn units) Analysis by By Shape, 2017-2032
Figure 232: MEA Sleeping Bags Market Value Share (%) and BPS Analysis by By Shape, 2022-2032
Figure 233: MEA Sleeping Bags Market Y-o-Y Growth (%) Projections by By Shape, 2022-2032
Figure 234: MEA Sleeping Bags Market Value (US$ Mn) Analysis by Application, 2017-2032
Figure 235: MEA Sleeping Bags Market Volume(Mn units) Analysis by Application, 2017-2032
Figure 236: MEA Sleeping Bags Market Value Share (%) and BPS Analysis by Application, 2022-2032
Figure 237: MEA Sleeping Bags Market Y-o-Y Growth (%) Projections by Application, 2022-2032
Figure 238: MEA Sleeping Bags Market Value (US$ Mn) Analysis by End User, 2017-2032
Figure 239: MEA Sleeping Bags Market Volume(Mn units) Analysis by End User, 2017-2032
Figure 240: MEA Sleeping Bags Market Value Share (%) and BPS Analysis by End User, 2022-2032
Figure 241: MEA Sleeping Bags Market Y-o-Y Growth (%) Projections by End User, 2022-2032
Figure 242: MEA Sleeping Bags Market Value (US$ Mn) Analysis by Sales Channels , 2017-2032
Figure 243: MEA Sleeping Bags Market Volume(Mn units) Analysis by Sales Channels , 2017-2032
Figure 244: MEA Sleeping Bags Market Value Share (%) and BPS Analysis by Sales Channels , 2022-2032
Figure 245: MEA Sleeping Bags Market Y-o-Y Growth (%) Projections by Sales Channels , 2022-2032
Figure 246: MEA Sleeping Bags Market Attractiveness by By Properties , 2022-2032
Figure 247: MEA Sleeping Bags Market Attractiveness by By Insulation Type, 2022-2032
Figure 248: MEA Sleeping Bags Market Attractiveness by By Shape, 2022-2032
Figure 249: MEA Sleeping Bags Market Attractiveness by Application, 2022-2032
Figure 250: MEA Sleeping Bags Market Attractiveness by End User, 2022-2032
Figure 251: MEA Sleeping Bags Market Attractiveness by Sales Channels , 2022-2032
Figure 252: MEA Sleeping Bags Market Attractiveness by Country, 2022-2032
Need specific information?
Request CustomizationExplore Consumer Product Insights
View Reports