The viscosupplementation market is estimated to be valued at USD 2.2 billion in 2025. It is projected to reach USD 3.8 billion by 2035, registering a compound annual growth rate (CAGR) of 5.7% over the forecast period. The market is projected to add an absolute dollar opportunity of USD 1.7 billion over the forecast period. This reflects a 1.8 times growth at a compound annual growth rate of 5.7%. The market's evolution is expected to be shaped by rising aging demographics, demand for non-surgical osteoarthritis treatments, technological improvements in hyaluronic acid formulations, and growing preference for minimally invasive joint pain management solutions.
By 2030, the market is projected to reach USD 2.9 billion, adding USD 700 million in incremental value during the first half of the decade and the remaining USD 1.0 billion in the second half, indicating moderately accelerated growth. Innovation in single-injection formulations, cross-linked polymer technology, and enhanced viscosity profiles is gaining traction.
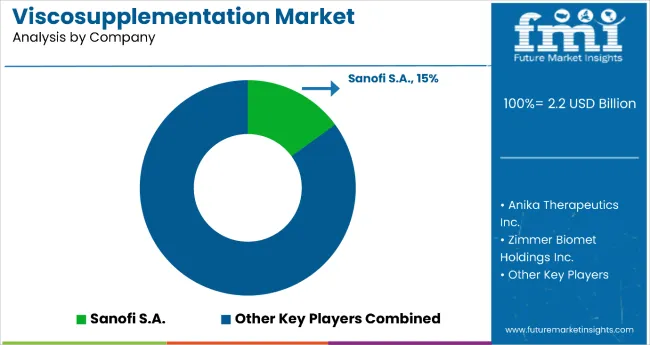
Companies such as Sanofi S.A. and Anika Therapeutics Inc. are advancing their competitive positions through investment in clinical research, product innovation programs, and global distribution networks. Rising osteoarthritis prevalence, expanding aging population, and improved treatment efficacy are supporting expansion into hospital, ambulatory surgical center, and orthopedic clinic applications. Market performance will remain anchored in clinical efficacy standards, patient safety profiles, and healthcare provider accessibility optimization benchmarks.
The market holds a significant and steadily growing share in its parent markets, accounting for 12.8% of the global osteoarthritis treatment segment due to its specialized joint lubrication capabilities. In the orthopedic injection segment, it commands an 18.5% share, supported by hyaluronic acid efficacy and non-surgical positioning. It contributes nearly 8.2% to the joint pain management market and 14.3% to the minimally invasive treatment segment. In orthopedic biologics, viscosupplements hold around 16.7% share, driven by natural joint fluid restoration requirements. Across the aging-related healthcare market, its share is close to 9.4%, owing to its position as a leading osteoarthritis intervention requiring minimal recovery time.
The market is undergoing a strategic transformation driven by rising demand for three-injection viscosupplements, enhanced cross-linking technologies, and improved patient convenience features. Advanced technologies using modified hyaluronic acid, extended-release formulations, and optimized molecular weights have enhanced treatment efficacy, duration of relief, and patient satisfaction, making viscosupplementation a viable alternative to surgical joint interventions and oral pain medications. Manufacturers are introducing specialized formulations, including single-injection options, combination therapies, and personalized treatment protocols tailored for different osteoarthritis severity levels and patient demographics, expanding their role beyond basic joint lubrication to comprehensive joint health solutions. Strategic collaborations between pharmaceutical companies and orthopedic specialists have accelerated innovation in delivery methods and market penetration.
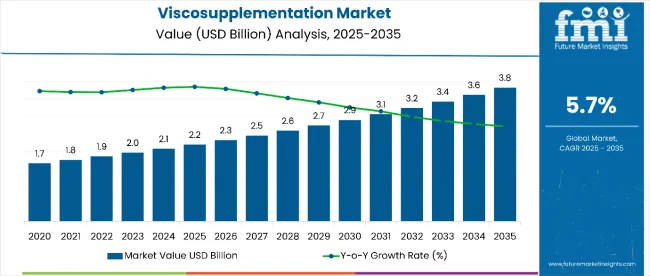
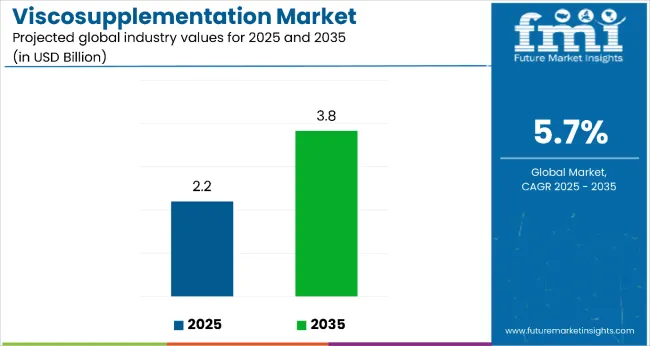
| Metric | Value |
|---|---|
| Estimated Size (2025E) | USD 2.2 billion |
| Projected Value (2035F) | USD 3.8 billion |
| CAGR (2025 to 2035) | 5.7% |
The viscosupplementation market’s steady growth is driven by increasing osteoarthritis prevalence, aging global population, and rising preference for non-surgical treatments, making it an attractive therapeutic category for healthcare providers and patients seeking effective joint pain management solutions. The growing understanding of minimally invasive procedures, joint preservation benefits, and improved quality of life appeals to patients prioritizing mobility, pain relief, and surgical avoidance.
A growing awareness of hyaluronic acid benefits, evidence-based clinical outcomes, and treatment accessibility is further propelling adoption, particularly in orthopedic practices, pain management centers, and aging patient demographics. Rising healthcare expenditure, expanding insurance coverage, and continuous clinical research are also enhancing market accessibility and physician adoption.
As aging populations and osteoarthritis burden accelerate across global markets and joint preservation becomes increasingly important, the market outlook remains favorable. With patients prioritizing mobility preservation, pain reduction, and non-surgical options, viscosupplementation is well-positioned to expand across various hospital, outpatient, and specialty orthopedic applications.
The market is segmented by product, application, end user, and region. By product, the market is divided into single injection, three injection, and five injection viscosupplementation. Based on application, the market is categorized into knee osteoarthritis, hip osteoarthritis, shoulder osteoarthritis, and others. In terms of end user, the market is segmented into hospitals, ambulatory surgical centers, orthopedic clinics, retail pharmacies, and online sales. Regionally, the market is classified into North America, Europe, Asia-Pacific, Latin America, and the Middle East & Africa.
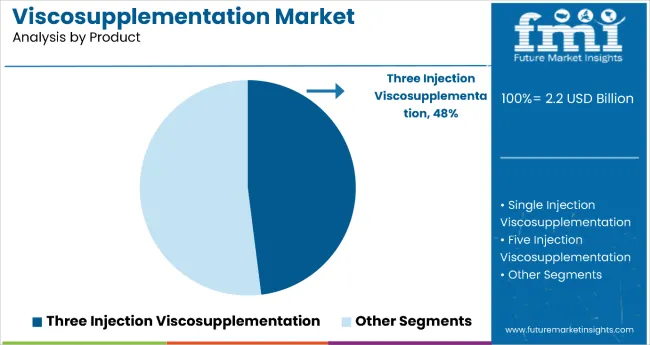
The three injection viscosupplementation segment holds a dominant position with 48% of the market share in the product category, owing to its optimal balance of treatment efficacy, clinical evidence, and patient compliance that enables sustained joint lubrication for moderate-to-severe osteoarthritis cases. Three injection protocols are widely used across hospital and outpatient settings due to their established clinical protocols, proven safety profiles, and familiarity among healthcare providers, which significantly improve treatment predictability and patient outcomes.
These protocols enable healthcare providers to achieve consistent therapeutic results while maintaining high safety standards and cost-effectiveness in osteoarthritis management. As demand for evidence-based treatments, predictable outcomes, and established protocols grows, the three-injection segment continues to gain preference in both traditional and modern orthopedic practice environments.
Manufacturers are investing in advanced formulation development, enhanced cross-linking technologies, and improved injection techniques to enhance efficacy, extend treatment duration, and improve patient comfort. The segment is poised to grow further as global clinical evidence favors multi-injection protocols and healthcare providers seek reliable treatment options.
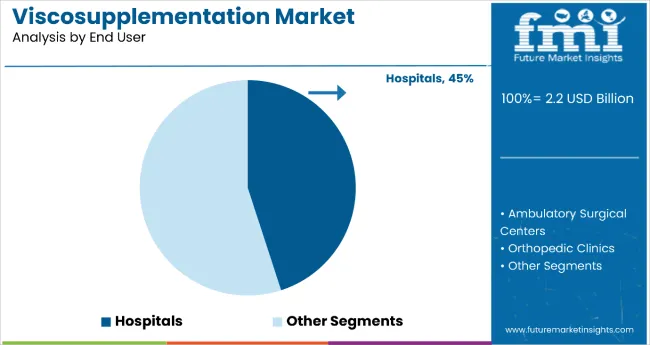
Hospital applications remain the core market segment, accounting for 45% of market share in 2025. They provide comprehensive patient care, advanced medical infrastructure, and specialized orthopedic services for complex osteoarthritis management in institutional healthcare settings. Their clinical capabilities support various injection procedures, patient monitoring, and follow-up care, making them essential venues for viscosupplementation treatments requiring medical supervision and emergency preparedness.
Hospital-based viscosupplementation also ensures optimal patient safety, standardized protocols, and integrated care coordination compared to other healthcare settings, while offering comprehensive insurance coverage and access to specialist consultations. This makes them indispensable in contemporary osteoarthritis treatment and joint preservation healthcare environments.
Ongoing demand for specialized orthopedic care and the infrastructure required for safe injection procedures are key trends driving the sustained relevance of hospital applications in this therapeutic category.
In 2024, global viscosupplementation adoption grew by 8% year-on-year, with North America and Europe capturing significant shares. Applications include knee osteoarthritis treatment, joint pain management, and mobility preservation solutions. Manufacturers are introducing enhanced formulations and longer-lasting options that deliver superior therapeutic outcomes and patient-centered convenience. Cross-linked formulations now support extended relief positioning. Evidence-based clinical studies and safety profiles provide physicians with confidence. Healthcare providers increasingly supply ready-to-use viscosupplement products with integrated injection systems to reduce procedure complexity.
Advanced Formulation Technology Accelerates Viscosupplementation Market Demand
Healthcare providers and orthopedic specialists are choosing advanced viscosupplement formulations to achieve superior joint lubrication, enhance patient outcomes, and meet growing demands for effective, minimally invasive osteoarthritis treatments. In clinical trials, enhanced cross-linked formulations deliver up to 40% longer-lasting relief compared to standard variants, with 25-30% improved patient satisfaction scores. Products equipped with advanced molecular weights maintain optimal joint function throughout extended treatment periods and diverse patient applications. In hospital settings, integrated injection systems help reduce procedure complexity while maintaining safety standards by up to 45%. Single-injection applications are now being deployed for patient convenience, increasing adoption in sectors demanding comprehensive treatment efficiency.
Cost Pressures, Limited Coverage and Competition Limit Growth
Market expansion is constrained by higher costs of advanced formulations, limited insurance coverage in emerging markets, and competition from alternative osteoarthritis treatments. Advanced viscosupplement prices range from USD 300 to USD 800 per treatment course, depending on formulation and injection protocol, which may limit accessibility and delay treatment in cost-sensitive healthcare systems. Limited insurance reimbursement restricts treatment access for many patients, extending wait times by 30-40% for approved procedures. Competition from corticosteroid injections and surgical options adds complexity to treatment positioning, especially for severe osteoarthritis cases. Limited awareness of viscosupplementation benefits restricts scalable adoption, particularly in emerging markets and primary care settings.
| Country | CAGR (2025 to 2035) |
|---|---|
| China | 8.5% |
| Brazil | 6.8% |
| Germany | 6.1% |
| UK | 5.9% |
| USA | 5.2% |
| Japan | 4.8% |
| France | 4.6% |
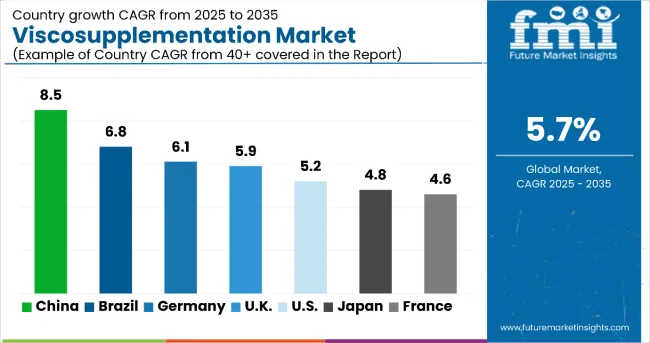
In the viscosupplementation market, China leads with the highest projected CAGR of 8.5% from 2025 to 2035, driven by a rapid aging population, increasing osteoarthritis prevalence, and expanding healthcare infrastructure development. Brazil follows with a CAGR of 6.8%, supported by growing healthcare access and rising life expectancy. Germany shows robust growth at 6.1%, benefiting from an advanced orthopedic care infrastructure and comprehensive insurance coverage. The UK, USA, Japan, and France demonstrate steady growth ranging from 4.6% to 5.9%, supported by established healthcare systems and aging demographics. These growth patterns reflect regional differences in healthcare infrastructure maturity, reimbursement policies, and osteoarthritis treatment adoption patterns.
The report covers an in-depth analysis of 40+ countries; seven top-performing OECD countries are highlighted below.
Revenue from viscosupplementation in China is projected to grow at a CAGR of 8.5% from 2025 to 2035, significantly exceeding the global average. Growth is fueled by rapid population aging, increasing osteoarthritis awareness, and expanding healthcare infrastructure across major cities, including Beijing, Shanghai, and Guangzhou. Chinese healthcare providers are increasingly adopting evidence-based joint preservation treatments as medical standards drive demand for effective interventions for osteoarthritis.
Key Statistics:
The viscosupplementation market in Brazil is anticipated to expand at a CAGR of 6.8% from 2025 to 2035, reflecting growing healthcare accessibility driven by an aging population and improved medical infrastructure. Growth is centered on hospital-based treatments and the expansion of orthopedic specialties in the São Paulo, Rio de Janeiro, and Brasília regions. Advanced treatment protocols, including three-injection series and enhanced formulations, are being deployed for aging populations and active lifestyle demographics seeking joint preservation.
Key Statistics:
Sales of viscosupplementation in Germany are projected to flourish at a CAGR of 6.1% from 2025 to 2035, driven by comprehensive healthcare coverage and advanced orthopedic infrastructure. Growth has been concentrated in specialized orthopedic practices and university medical centers in the Berlin, Munich, and Hamburg regions. Healthcare adoption is shifting from traditional pain management toward evidence-based joint preservation solutions. Advanced clinical protocols and reimbursement support are leading market deployment strategies.
Key Statistics:
The demand for viscosupplementation in the UK is expected to increase at a CAGR of 5.9% from 2025 to 2035, aligning with the mature European market average. Demand is driven by NHS coverage expansion, aging population demographics, and robust healthcare infrastructure in London, Manchester, and Birmingham markets. Evidence-based clinical outcomes and NICE guidelines are increasingly adopted by healthcare providers seeking effective osteoarthritis interventions.
Key Statistics:
The viscosupplementation market in the USA is expected to grow at a CAGR of 5.2% from 2025 to 2035, reflecting mature market dynamics with a focus on advanced formulations and clinical evidence. Growth is centered on hospital-based procedures and ambulatory surgical center adoption in California, Texas, and New York regions. Advanced treatment protocols, including single-injection options, extended-release formulations, and personalized treatment plans, are being deployed for aging baby boomer populations and active lifestyle demographics.
Key Statistics:
Revenue from viscosupplementation in Japan is projected to rise at a CAGR of 4.8% from 2025 to 2035, supported by the world's most aged society, established orthopedic care standards, and comprehensive healthcare coverage. Healthcare adoption in Tokyo, Osaka, and Nagoya is experiencing steady expansion in hospital-based treatments, specialized orthopedic clinics, and integrated care protocols. Japanese healthcare providers are leveraging advanced clinical protocols to meet expectations for high-quality joint preservation treatments.
Key Statistics:
The viscosupplementation market in France is expected to grow at a CAGR of 4.6% from 2025 to 2035, reflecting steady mature market growth with emphasis on clinical excellence and healthcare access. Growth is centered on hospital networks and specialized rheumatology practices in the Paris, Lyon, and Marseille regions. Evidence-based treatment protocols, comprehensive reimbursement coverage, and quality healthcare standards are being maintained for aging populations seeking joint preservation alternatives.
Key Statistics:
The Viscosupplementation Market is growing steadily due to the increasing prevalence of osteoarthritis, rising elderly population, and the growing preference for minimally invasive pain management therapies. Viscosupplementation involves injecting hyaluronic acid (HA) into synovial joints to restore lubrication, reduce pain, and improve mobility. The demand is increasing across both developed and emerging markets as patients seek alternatives to surgical intervention and long-term pharmacological treatments.
Global healthcare leaders such as Sanofi S.A., Zimmer Biomet Holdings Inc., and Bioventus LLC dominate the market with extensive portfolios of HA-based products for knee and other large-joint osteoarthritis. Sanofi remains a leading player with its Synvisc and Synvisc-One brands, which have set the global benchmark for viscosupplementation therapy efficacy. Zimmer Biomet offers the Gel-One cross-linked HA formulation that provides extended joint lubrication with fewer injections. Bioventus LLC continues to expand its Durolane product line across international markets, emphasizing single-injection convenience and long-term pain relief.
Anika Therapeutics Inc. and Fidia Farmaceutici S.p.A. are key innovators in cross-linked HA technology and sustained-release formulations. Anika specializes in HA products designed for enhanced viscosity and biological performance, while Fidia provides a broad range of viscosupplementation therapies, including Hyalgan and Hymovis, focusing on patient comfort and clinical durability.
Ferring B.V., Seikagaku Corporation, and Chugai Pharmaceutical Co. Ltd. strengthen the market in Asia and Europe through continuous R&D in novel HA derivatives and combination therapies aimed at promoting cartilage repair and regeneration. Seikagaku Corporation, a pioneer in HA-based biomaterials, supports long-acting formulations used widely in orthopedic and rheumatologic care.
| Items | Value |
|---|---|
| Quantitative Units (2025) | USD 2.2 Billion |
| Product | Single Injection, Three Injection, Five Injection Viscosupplementation |
| Application | Knee Osteoarthritis, Hip Osteoarthritis, Shoulder Osteoarthritis, Others |
| End User | Hospitals, Ambulatory Surgical Centers, Orthopedic Clinics, Retail Pharmacies, Online Sales |
| Regions Covered | North America, Europe, Asia Pacific, Latin America, Middle East & Africa |
| Countries Covered | United States, Canada, United Kingdom, Germany, France, China, Japan, South Korea, Brazil, Australia, India and 40+ Countries |
| Key Companies Profiled | Sanofi S.A., Zimmer Biomet Holdings Inc., Bioventus LLC, Anika Therapeutics Inc., Fidia Farmaceutici S.p.A., Ferring B.V., Seikagaku Corporation, Chugai Pharmaceutical Co. Ltd. |
| Additional Attributes | Dollar sales by product and application; regional demand trends; competitive landscape; patient preferences; adoption in orthopedic and osteoarthritis treatment; innovations in formulation and delivery; integration with minimally invasive procedures; healthcare infrastructure growth |
The global viscosupplementation market is estimated to be valued at USD 2.2 billion in 2025.
The market size for viscosupplementation is projected to reach USD 3.8 billion by 2035.
The viscosupplementation market is expected to grow at a 5.7% CAGR between 2025 and 2035.
Three injection viscosupplementation is projected to lead with 48% market share in 2025.
Hospitals are expected to command 45% share in the viscosupplementation market in 2025.


Our Research Products

The "Full Research Suite" delivers actionable market intel, deep dives on markets or technologies, so clients act faster, cut risk, and unlock growth.

The Leaderboard benchmarks and ranks top vendors, classifying them as Established Leaders, Leading Challengers, or Disruptors & Challengers.

Locates where complements amplify value and substitutes erode it, forecasting net impact by horizon

We deliver granular, decision-grade intel: market sizing, 5-year forecasts, pricing, adoption, usage, revenue, and operational KPIs—plus competitor tracking, regulation, and value chains—across 60 countries broadly.

Spot the shifts before they hit your P&L. We track inflection points, adoption curves, pricing moves, and ecosystem plays to show where demand is heading, why it is changing, and what to do next across high-growth markets and disruptive tech

Real-time reads of user behavior. We track shifting priorities, perceptions of today’s and next-gen services, and provider experience, then pace how fast tech moves from trial to adoption, blending buyer, consumer, and channel inputs with social signals (#WhySwitch, #UX).

Partner with our analyst team to build a custom report designed around your business priorities. From analysing market trends to assessing competitors or crafting bespoke datasets, we tailor insights to your needs.
Supplier Intelligence
Discovery & Profiling
Capacity & Footprint
Performance & Risk
Compliance & Governance
Commercial Readiness
Who Supplies Whom
Scorecards & Shortlists
Playbooks & Docs
Category Intelligence
Definition & Scope
Demand & Use Cases
Cost Drivers
Market Structure
Supply Chain Map
Trade & Policy
Operating Norms
Deliverables
Buyer Intelligence
Account Basics
Spend & Scope
Procurement Model
Vendor Requirements
Terms & Policies
Entry Strategy
Pain Points & Triggers
Outputs
Pricing Analysis
Benchmarks
Trends
Should-Cost
Indexation
Landed Cost
Commercial Terms
Deliverables
Brand Analysis
Positioning & Value Prop
Share & Presence
Customer Evidence
Go-to-Market
Digital & Reputation
Compliance & Trust
KPIs & Gaps
Outputs
Full Research Suite comprises of:
Market outlook & trends analysis
Interviews & case studies
Strategic recommendations
Vendor profiles & capabilities analysis
5-year forecasts
8 regions and 60+ country-level data splits
Market segment data splits
12 months of continuous data updates
DELIVERED AS:
PDF EXCEL ONLINE
Viscosupplementation Industry Analysis in Europe - Size, Share & Forecast 2025 to 2035
Russia Viscosupplementation Market Analysis – Growth, Applications & Outlook 2025–2035
Hyaluronic Viscosupplementation Market Size and Share Forecast Outlook 2025 to 2035

Thank you!
You will receive an email from our Business Development Manager. Please be sure to check your SPAM/JUNK folder too.
Chat With
MaRIA