Herbal Supplement Market Size and Share Forecast Outlook 2025 to 2035

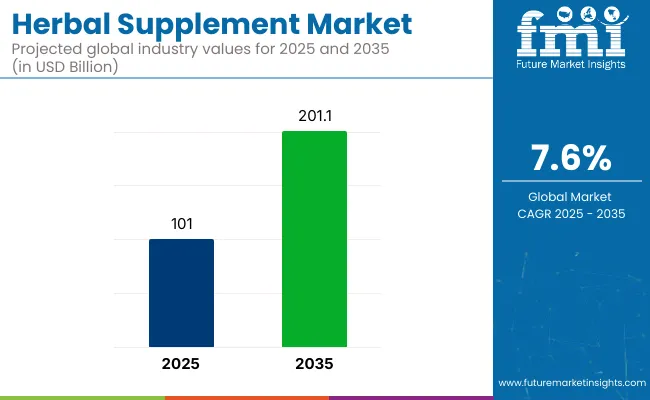
The global herbal supplement market is projected to grow from USD 101.0 billion in 2025 to USD 201.1 billion by 2035, registering a CAGR of 7.6%. Market expansion is being driven by increasing consumer preference for natural, plant-based health solutions and rising awareness of preventive healthcare.
Quick Stats for Herbal Supplement Market

  • Market Value (2025): USD 101.0 billion
  • Forecast Value (2035): USD 201.1 billion
  • Forecast CAGR: 7.6%
  • Consumer Orientation Segment Leader in 2025: Women (40% share)
  • Top Application Segment: Immune & Digestive Health (35% share)
  • Key Growth Region: North America (United States is the fastest-growing market with a 7.2% CAGR)

Herbal Supplement Market

Metric Value
Industry Size (2025E) USD 101.0 billion
Industry Value (2035F) USD 201.1 billion
CAGR (2025 to 2035) 7.6%

Shifts toward clean-label products, growing aging populations, and higher rates of chronic lifestyle diseases are encouraging adoption of herbal supplements across various demographics.

The herbal supplement market holds approximately 43% share of the global nutritional supplements market and around 21% of the dietary supplements market, reflecting its core position in natural health solutions. Within the functional foods and beverages market, it contributes nearly 8%, while its share in the consumer healthcare products market is about 3.5%.

In the pharmaceutical and botanical products market, herbal supplements represent close to 2%, and account for less than 0.5% of the broader pharmaceutical market. These figures highlight the sector’s significance in wellness-focused categories, with room for growth across overlapping health and nutrition domains.

Government regulations impacting the market emphasize product safety, efficacy, and labeling transparency. In India, regulations such as the Drugs and Cosmetics Act, 1940, the Food Safety and Standards Act (FSSA), 2006, and AYUSH guidelines mandate stringent quality control, proper herbal identification, and adherence to safety standards for herbal formulations.

Globally, bodies like the FDA, EFSA, and WHO set protocols for claims, good manufacturing practices (GMP), and botanical authentication. These frameworks are fueling the adoption of standardized herbal supplements, ensuring consumer trust and fostering market growth through compliance and innovation.

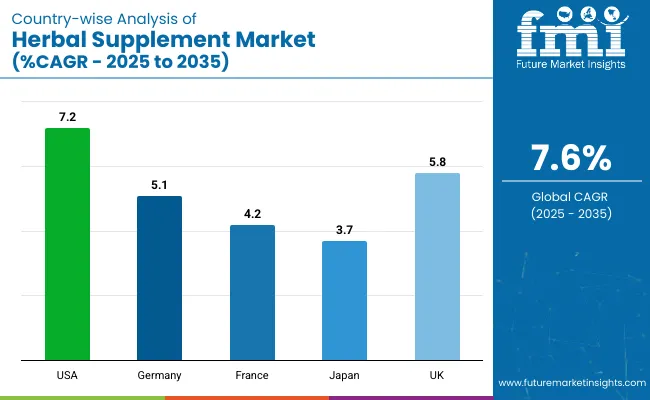
The United States is projected to be the fastest-growing market, expanding at a CAGR of 7.2% from 2025 to 2035. Women will lead the consumer orientation segment with a 40% share, while immune & digestive health will dominate the application segment with a 35% share in 2025. The UK and Germany markets are expected to grow steadily, with CAGRs of 5.8% and 5.1%, respectively. Japan and France are projected to experience moderate growth, with CAGRs of 3.7% and 4.2%, respectively.

Analyzing Herbal Supplement Market by Top Investment Segments

The herbal supplement market is segmented by form, ingredient, consumer orientation, application, distribution channel, and region. By form, the market is divided into soft gel/pills, confectionery products, gummies, chewable pills, gel caps, powder, and liquid. In terms of ingredients, the market is classified into moringa, echinacea, flaxseeds, turmeric, ginger, ginseng, and other ingredients like horehound and elderberry.

Based on consumer orientation, the market is divided into men, women, senior citizens, and others (kids & toddlers). In terms of application, the market is segmented into weight loss, sports nutrition, general well-being, immune & digestive health, bone & joint health, heart health, and other specific requirements like anti-allergies & eye health.

By distribution channel, the market is classified into hypermarkets/supermarkets, convenience stores, drug stores and pharmacies, health and wellness stores, and online retailing. Regionally, the market is divided into North America, Latin America, Western Europe, Eastern Europe, South Asia and Pacific, East Asia, and the Middle East & Africa.

Soft Gel/Pills to Lead the Form Segment with 30% Market Share

Soft gel/pills are expected to dominate the form segment with a 30% market share by 2025, driven by their convenience, ease of swallowing, accurate dosage, and extended shelf-life preferred by both adults and seniors.
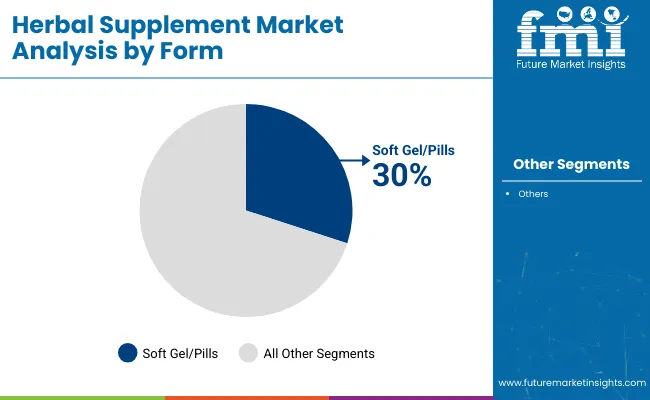
  • Soft gels and pills are convenient for both adults and children, offering a controlled and accurate dosage.
  • Increased demand for convenience-based supplements will drive growth for this form type.

Herbal Supplement Market Analysis By Form

Moringa to Dominate the Ingredient Segment with 32.4% Market Share in 2025

Moringa is projected to lead the ingredient segment with a 32.4% market share in 2025, owing to its high nutritional value, antioxidant properties, and growing use in immunity-boosting and wellness-focused herbal supplements.
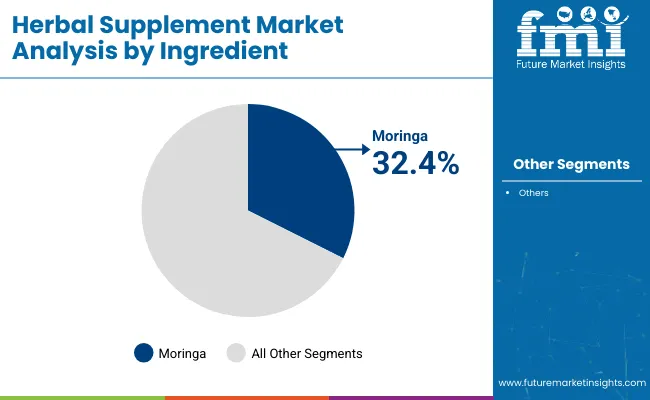
  • Moringa is a superfood, known for its antioxidant properties and ability to support immune health.
  • The growing awareness of its health benefits will continue to drive its demand in the market.

Herbal Supplement Market Analysis By Ingredient

Women to Lead the Consumer Orientation Segment with 40% Market Share

Women are projected to lead the consumer orientation segment with a 40% market share in 2025, driven by rising demand for beauty, wellness, and hormonal health supplements tailored specifically to female health needs.
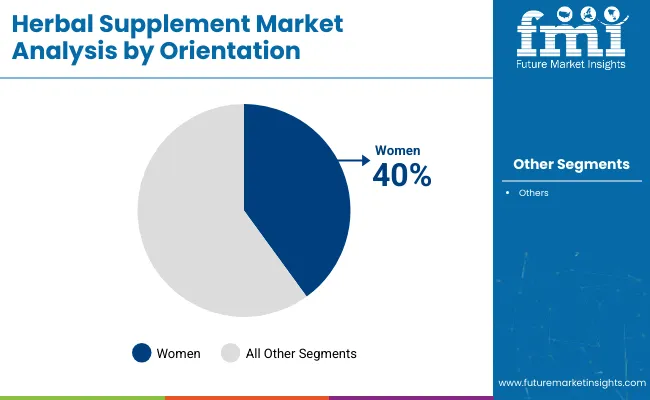
  • Women are increasingly seeking supplements for general well-being, immune health, and beauty support, which will continue to boost demand in this segment.
  • The rise in health-conscious women looking for plant-based and natural supplements will drive growth in this segment.

Herbal Supplement Market Analysis By Orientation

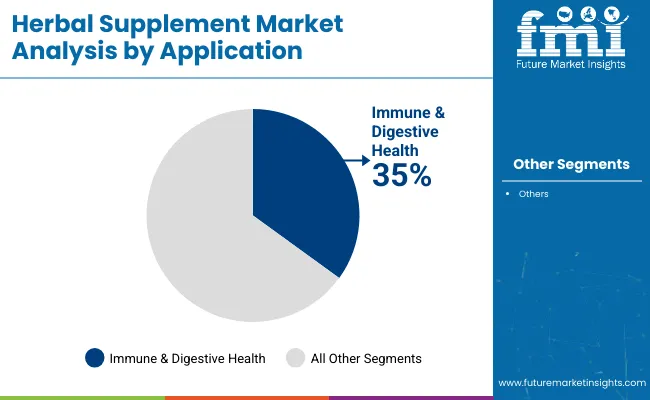
Immune & Digestive Health to Lead the Application Segment with 35% Market Share

Immune and digestive health is projected to dominate the application segment with a 35% market share in 2025, fueled by growing consumer focus on gut health, disease prevention, and post-pandemic immunity enhancement.
  • Increased health awareness around immunity, especially post-pandemic, is driving the demand for immune-boosting herbal supplements.
  • Consumers’ growing reliance on digestive health products will contribute significantly to market growth.

Herbal Supplement Market Analysis By Application

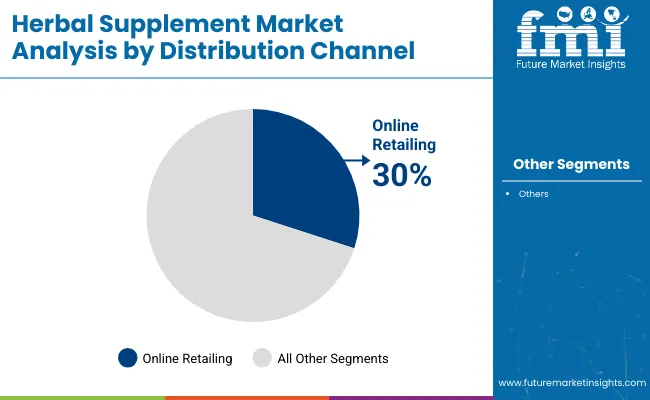
Online Retailing to Capture 30% of the Distribution Channel Segment in 2025

Online retailing is expected to lead the distribution channel segment with a 30% market share by 2025, driven by rising e-commerce adoption, convenience, wider product availability, and increased consumer preference for doorstep delivery of supplements.
  • The growing trend of e-commerce and direct-to-consumer sales will continue to fuel online retail growth.
  • The convenience and accessibility of purchasing supplements online will drive more consumers to prefer this channel.

Herbal Supplement Market Analysis By Distribution Channel

Top Herbal Supplement Market Dynamics

The global market is experiencing steady growth, driven by the increasing demand for natural, plant-based products and consumer preference for holistic health solutions. Herbal supplements play a vital role in enhancing health and wellness by providing various benefits such as immune support, digestive health, and mental well-being.

Recent Trends in the Herbal Supplement Market

  • Rising demand for plant-based and organic supplements, driven by consumer preference for clean-label products that align with their health-conscious lifestyle.
  • Growing popularity of adaptogens such as ashwagandha and Rhodiolarosea for stress management and mental health support.
  • Focus on sustainable sourcing of ingredients, with an increasing emphasis on eco-friendly packaging and ethical harvesting practices.

Challenges in the Herbal Supplement Market
  • Regulatory hurdles around labeling and health claims in different regions pose challenges for global distribution and market entry.
  • Quality and consistency of herbal supplements are often difficult to control, leading to concerns over efficacy and safety, especially in unregulated markets.

Top Countries Manufacturing and Distributing Herbal Supplements

Country Wise Analysis Of Herbal Supplement Market

The United States maintains its dominance due to growing consumer interest in plant-based wellness solutions, a strong retail network, and proactive adoption of natural products for preventive healthcare.

Germany Herbal Supplement Market and France Herbal Supplement Market remain robust, supported by EU organic certification mandates and national wellness campaigns. In contrast, developed economies such as the United States (7.2% CAGR), United Kingdom (5.8% CAGR), and Japan (3.7% CAGR) are growing steadily at a rate of 0.91 to 0.95 times the global average.

The United States leads the herbal supplement market in growth, supported by rising demand for immune boosters, clean-label products, and widespread e-commerce adoption. The United Kingdom follows, with growing consumer interest in vegan, adaptogenic, and beauty supplements, particularly among younger demographics.

The Germany market is expanding steadily due to strong pharmacy networks and a national push for certified organic products. The France market benefits from increased demand in heart, bone, and anti-allergy segments, driven by holistic health preferences. The Japan market, while growing slower, remains value-focused with continued interest in kampo formulations and preventative care among senior consumers.

The report covers in-depth analysis of 40+ countries; five top-performing OECD countries are highlighted below.

In-depth Analysis of United States Herbal Supplement Market

The United States herbal supplement market is slated to grow at a CAGR of 7.2% from 2025 to 2035. Growth is driven by increasing awareness around lifestyle diseases, widespread availability of herbal products through pharmacies and online platforms, and the adoption of plant-based supplements for immunity and energy.

  • High demand in immune boosters, sleep aids, and general wellness
  • Expansion in e-commerce and clean-label segments

Growth Outlook for Germany Herbal Supplement Sales

The Germany herbal supplement revenue is poised to expand at a CAGR of 5.1% during the forecast period. Market performance is tied to rising consumer preference for organic and non-synthetic wellness solutions. Focus on certified organic supplements in joint and digestive health

  • Strong retail pharmacy networks and physician-recommended brands

Demand Trends in France Herbal Supplement Market

The herbal supplement demand in France is projected to expand at a CAGR of 4.2% from 2025 to 2035. Growth is driven by an increase in herbal solutions for bone health, heart health, and anti-allergy benefits. Demand rising in anti-allergy and cardiovascular herbal segments

  • Preference for chewables and capsules with verified therapeutic benefits

Japan Herbal Supplement Sales Analysis

The Japan herbal supplement revenue is projected to grow at a CAGR of 3.7% from 2025 to 2035, representing the slowest among the top five nations at 0.49 times the global pace.

  • High preference for kampo-based and native plant formulations
  • Steady demand from senior population seeking preventative care

Consumption Trends in United Kingdom Herbal Supplement Market

The United Kingdom herbal supplement market is forecast to grow at a CAGR of 5.8% between 2025 and 2035. Post-Brexit divergence in regulatory frameworks has introduced market challenges, but consumer interest in clean-label and vegan supplements continues to rise.

  • Growing popularity of vegan, adaptogenic, and beauty supplements
  • Retail pharmacies and online platforms are driving accessibility

Leading Herbal Supplement Suppliers and Manufacturers

The market is moderately consolidated, with prominent players such as Glanbia plc, Jarrow Formulas, Inc., Archer Daniels Midland Company, Nature’s Bounty, and Herbalife International of America, Inc. leading the industry. These companies offer a wide range of herbal formulations that cater to diverse consumer needs across wellness, immunity, digestion, and sports nutrition.

Glanbia plc focuses on clinically supported ingredients and performance nutrition. Jarrow Formulas, Inc. is known for high-quality supplements backed by scientific research. Archer Daniels Midland Company offers botanical-based solutions integrated with advanced food technologies. Nature’s Bounty delivers a broad range of herbal products through mass retail and pharmacy chains. Herbalife emphasizes meal replacement and weight management solutions with herbal components.

Recent Herbal Supplement Industry News

In April 2024, Glanbia announced the acquisition of Flavor Producers to bolster its flavour offering range.

Herbal Supplement Market Report Scope

Report Attributes Details
Market Size (2025) USD 101.0 billion
Projected Market Size (2035) USD 201.1 billion
CAGR (2025 to 2035) 7.6%
Base Year for Estimation 2024
Historical Period 2020 to 2024
Projections Period 2025 to 2035
Report Parameter USD billion for value/ volume in metric tons
Form Analyzed Soft Gel/Pills, Confectionery Products, Gummies, Chewable Pills, Gel Caps, Powder, Liquid
Ingredients Analyzed Moringa, Echinacea, Flaxseeds, Turmeric, Ginger, Ginseng, Other Ingredients (Horehound, Elderberry, etc.)
Consumer Orientation Analyzed Men, Women, Senior Citizens, Others (Kids & Toddlers)
Application Analyzed Weight Loss, Sports Nutrition, General Well-being, Immune & Digestive Health, Bone & Joint Health, Heart Health, Other Specific Requirements (Supplements, Anti-allergies & Eye-health)
Distribution Channel Analyzed Hypermarkets/Supermarkets, Convenience Stores, Drug Stores and Pharmacies, Health and Wellness Stores, Online Retailing
Regions Covered North America, Latin America, Western Europe, Eastern Europe, South Asia and Pacific, East Asia, Middle East & Africa
Countries Covered United States, United Kingdom, Germany, France, Japan, China, India, Brazil, South Korea, Australia
Key Players Influencing the Market Glanbia plc, Jarrow Formulas, Inc., Archer Daniels Midland Company, Nature’s Bounty, Herbalife International of America, Inc., Blackmores, Nutraceutical International Corporation, Gaia Herbs, Ancient Green Fields Pvt. Ltd, Now Foods
Additional Attributes Dollar sales by product form, share by ingredient type, regional demand trends, regulatory impact, clean-label trends, competitive benchmarking

Key Segmentation

By Form Type:

  • Soft Gel or Pills
  • Confectionery Products
    • Gummies
    • Chews
    • Others
  • Pharmaceutical Products
    • Chewable pills
    • Gel caps
    • Powder
    • Liquid

By Ingredient Type:

  • Moringa
  • Echinacea
  • Flaxseeds
  • Turmeric
  • Ginger
  • Ginseng
  • Other ingredients (Horehound, Elderberry, etc.)

By Consumer Orientation:

  • Men
  • Women
  • Senior citizens
  • Others (Kids & Toddlers)

By Application:

  • Weight Loss
  • Sports Nutrition
  • General Well-being
  • Immune & Digestive Health
  • Bone & Joint Health
  • Heart Health
  • Other specific requirements (Supplements, Anti-allergies & Eye-health)

By Distribution Channel:

  • Store Based Retailing
  • Hypermarkets/Supermarkets
  • Convenience Stores
  • Drug Stores and Pharmacies
  • Health and Wellness Stores
  • Other Retailers
  • Online Retailing

By Region:

  • North America
  • Latin America
  • Europe
  • East Asia
  • South Asia and Pacific
  • Middle East and Africa (MEA)

Table of Content

  1. Executive Summary
    • Global Market Outlook
    • Demand-side Trends
    • Supply-side Trends
    • Technology Roadmap Analysis
    • Analysis and Recommendations
  2. Market Overview
    • Market Coverage/Taxonomy
    • Market Definition/Scope/Limitations
  3. Market Background
    • Market Dynamics
      • Drivers
      • Restraints
      • Opportunity
      • Trends
    • Scenario Forecast
      • Demand in Optimistic Scenario
      • Demand in Likely Scenario
      • Demand in Conservative Scenario
    • Opportunity Map Analysis
    • Product Life Cycle Analysis
    • Supply Chain Analysis
      • Supply Side Participants and their Roles
        • Producers
        • Mid-Level Participants (Traders/ Agents/ Brokers)
        • Wholesalers and Distributors
      • Value Added and Value Created at Node in the Supply Chain
      • List of Raw Material Suppliers
      • List of Existing and Potential Buyer’s
    • Investment Feasibility Matrix
    • Value Chain Analysis
      • Profit Margin Analysis
      • Wholesalers and Distributors
      • Retailers
    • PESTLE and Porter’s Analysis
    • Regulatory Landscape
      • By Key Regions
      • By Key Countries
    • Regional Parent Market Outlook
    • Production and Consumption Statistics
    • Import and Export Statistics
  4. Global Market Analysis 2020 to 2024 and Forecast, 2025 to 2035
    • Historical Market Size Value (USD Billion) & Volume (Metric Tons) Analysis, 2020 to 2024
    • Current and Future Market Size Value (USD Billion) & Volume (Metric Tons) Projections, 2025 to 2035
      • Y-o-Y Growth Trend Analysis
      • Absolute $ Opportunity Analysis
  5. Global Market Pricing Analysis 2020 to 2024 and Forecast 2025 to 2035
  6. Global Market Analysis 2020 to 2024 and Forecast 2025 to 2035, By Form
    • Introduction/Key Findings
    • Historical Market Size Value (USD Billion) & Volume (Metric Tons) Analysis By Form, 2020 to 2024
    • Current and Future Market Size Value (USD Billion) & Volume (Metric Tons) Analysis and Forecast By Form, 2025 to 2035
      • Soft Gel/Pills
      • Confectionery Products
      • Gummies
      • Chewable Pills
      • Gel Caps
      • Powder
      • Liquid
    • Y-o-Y Growth Trend Analysis By Form, 2020 to 2024
    • Absolute $ Opportunity Analysis By Form, 2025 to 2035
  7. Global Market Analysis 2020 to 2024 and Forecast 2025 to 2035, By Ingredients
    • Introduction/Key Findings
    • Historical Market Size Value (USD Billion) & Volume (Metric Tons) Analysis By Ingredients, 2020 to 2024
    • Current and Future Market Size Value (USD Billion) & Volume (Metric Tons) Analysis and Forecast By Ingredients, 2025 to 2035
      • Moringa
      • Echinacea
      • Flaxseeds
      • Turmeric
      • Ginger
      • Ginseng
      • Other Ingredients (Horehound, Elderberry, etc)
    • Y-o-Y Growth Trend Analysis By Ingredients, 2020 to 2024
    • Absolute $ Opportunity Analysis By Ingredients, 2025 to 2035
  8. Global Market Analysis 2020 to 2024 and Forecast 2025 to 2035, By Consumer Orientation
    • Introduction/Key Findings
    • Historical Market Size Value (USD Billion) & Volume (Metric Tons) Analysis By Consumer Orientation, 2020 to 2024
    • Current and Future Market Size Value (USD Billion) & Volume (Metric Tons) Analysis and Forecast By Consumer Orientation, 2025 to 2035
      • Men
      • Women
      • Senior Citizens
      • Others (Kids & Toddlers)
    • Y-o-Y Growth Trend Analysis By Consumer Orientation, 2020 to 2024
    • Absolute $ Opportunity Analysis By Consumer Orientation, 2025 to 2035
  9. Global Market Analysis 2020 to 2024 and Forecast 2025 to 2035, By Application
    • Introduction/Key Findings
    • Historical Market Size Value (USD Billion) & Volume (Metric Tons) Analysis By Application, 2020 to 2024
    • Current and Future Market Size Value (USD Billion) & Volume (Metric Tons) Analysis and Forecast By Application, 2025 to 2035
      • Weight Loss
      • Sports Nutrition
      • General Well-being
      • Immune & Digestive Health
      • Bone & Joint Health
      • Heart Health
      • Other Specific Requirements (Supplements, Anti-allergies & Eye-health)
    • Y-o-Y Growth Trend Analysis By Application, 2020 to 2024
    • Absolute $ Opportunity Analysis By Application, 2025 to 2035
  10. Global Market Analysis 2020 to 2024 and Forecast 2025 to 2035, By Distribution Channel
    • Introduction/Key Findings
    • Historical Market Size Value (USD Billion) & Volume (Metric Tons) Analysis By Distribution Channel, 2020 to 2024
    • Current and Future Market Size Value (USD Billion) & Volume (Metric Tons) Analysis and Forecast By Distribution Channel, 2025 to 2035
      • Hypermarkets/Supermarkets
      • Convenience Stores
      • Drug Stores and Pharmacies
      • Health and Wellness Stores
      • Online Retailing
    • Y-o-Y Growth Trend Analysis By Distribution Channel, 2020 to 2024
    • Absolute $ Opportunity Analysis By Distribution Channel, 2025 to 2035
  11. Global Market Analysis 2020 to 2024 and Forecast 2025 to 2035, By Region
    • Introduction
    • Historical Market Size Value (USD Billion) & Volume (Metric Tons) Analysis By Region, 2020 to 2024
    • Current Market Size Value (USD Billion) & Volume (Metric Tons) Analysis and Forecast By Region, 2025 to 2035
      • North America
      • Latin America
      • Western Europe
      • Eastern Europe
      • East Asia
      • South Asia & Pacific
      • Middle East and Africa
    • Market Attractiveness Analysis By Region
  12. North America Market Analysis 2020 to 2024 and Forecast 2025 to 2035, By Country
    • Historical Market Size Value (USD Billion) & Volume (Metric Tons) Trend Analysis By Market Taxonomy, 2020 to 2024
    • Market Size Value (USD Billion) & Volume (Metric Tons) Forecast By Market Taxonomy, 2025 to 2035
      • By Country
        • USA
        • Canada
        • Mexico
      • By Form
      • By Ingredients
      • By Consumer Orientation
      • By Application
      • By Distribution Channel
    • Market Attractiveness Analysis
      • By Country
      • By Form
      • By Ingredients
      • By Consumer Orientation
      • By Application
      • By Distribution Channel
    • Key Takeaways
  13. Latin America Market Analysis 2020 to 2024 and Forecast 2025 to 2035, By Country
    • Historical Market Size Value (USD Billion) & Volume (Metric Tons) Trend Analysis By Market Taxonomy, 2020 to 2024
    • Market Size Value (USD Billion) & Volume (Metric Tons) Forecast By Market Taxonomy, 2025 to 2035
      • By Country
        • Brazil
        • Argentina
        • Rest of LATAM
      • By Form
      • By Ingredients
      • By Consumer Orientation
      • By Application
      • By Distribution Channel
    • Market Attractiveness Analysis
      • By Country
      • By Form
      • By Ingredients
      • By Consumer Orientation
      • By Application
      • By Distribution Channel
    • Key Takeaways
  14. Western Europe Market Analysis 2020 to 2024 and Forecast 2025 to 2035, By Country
    • Historical Market Size Value (USD Billion) & Volume (Metric Tons) Trend Analysis By Market Taxonomy, 2020 to 2024
    • Market Size Value (USD Billion) & Volume (Metric Tons) Forecast By Market Taxonomy, 2025 to 2035
      • By Country
        • Germany
        • Italy
        • France
        • UK
        • Spain
        • BENELUX
        • Nordic
        • Rest of W.Europe
      • By Form
      • By Ingredients
      • By Consumer Orientation
      • By Application
      • By Distribution Channel
    • Market Attractiveness Analysis
      • By Country
      • By Form
      • By Ingredients
      • By Consumer Orientation
      • By Application
      • By Distribution Channel
    • Key Takeaways
  15. Eastern Europe Market Analysis 2020 to 2024 and Forecast 2025 to 2035, By Country
    • Historical Market Size Value (USD Billion) & Volume (Metric Tons) Trend Analysis By Market Taxonomy, 2020 to 2024
    • Market Size Value (USD Billion) & Volume (Metric Tons) Forecast By Market Taxonomy, 2025 to 2035
      • By Country
        • Russia
        • Hungary
        • Poland
        • Balkan & Baltics
        • Rest of E. Europe
      • By Form
      • By Ingredients
      • By Consumer Orientation
      • By Application
      • By Distribution Channel
    • Market Attractiveness Analysis
      • By Country
      • By Form
      • By Ingredients
      • By Consumer Orientation
      • By Application
      • By Distribution Channel
    • Key Takeaways
  16. East Asia Market Analysis 2020 to 2024 and Forecast 2025 to 2035, By Country
    • Historical Market Size Value (USD Billion) & Volume (Metric Tons) Trend Analysis By Market Taxonomy, 2020 to 2024
    • Market Size Value (USD Billion) & Volume (Metric Tons) Forecast By Market Taxonomy, 2025 to 2035
      • By Country
        • China
        • Japan
        • South Korea
      • By Form
      • By Ingredients
      • By Consumer Orientation
      • By Application
      • By Distribution Channel
    • Market Attractiveness Analysis
      • By Country
      • By Form
      • By Ingredients
      • By Consumer Orientation
      • By Application
      • By Distribution Channel
    • Key Takeaways
  17. South Asia & Pacific Market Analysis 2020 to 2024 and Forecast 2025 to 2035, By Country
    • Historical Market Size Value (USD Billion) & Volume (Metric Tons) Trend Analysis By Market Taxonomy, 2020 to 2024
    • Market Size Value (USD Billion) & Volume (Metric Tons) Forecast By Market Taxonomy, 2025 to 2035
      • By Country
        • India
        • Australia & New Zealand
        • ASEAN
        • Rest of SAP
      • By Form
      • By Ingredients
      • By Consumer Orientation
      • By Application
      • By Distribution Channel
    • Market Attractiveness Analysis
      • By Country
      • By Form
      • By Ingredients
      • By Consumer Orientation
      • By Application
      • By Distribution Channel
    • Key Takeaways
  18. Middle East and Africa Market Analysis 2020 to 2024 and Forecast 2025 to 2035, By Country
    • Historical Market Size Value (USD Billion) & Volume (Metric Tons) Trend Analysis By Market Taxonomy, 2020 to 2024
    • Market Size Value (USD Billion) & Volume (Metric Tons) Forecast By Market Taxonomy, 2025 to 2035
      • By Country
        • GCC Countries
        • Northern Africa
        • South Africa
        • Turkiye
        • Rest of MEA
      • By Form
      • By Ingredients
      • By Consumer Orientation
      • By Application
      • By Distribution Channel
    • Market Attractiveness Analysis
      • By Country
      • By Form
      • By Ingredients
      • By Consumer Orientation
      • By Application
      • By Distribution Channel
    • Key Takeaways
  19. Key Countries Market Analysis
    • USA
      • Pricing Analysis
      • Market Share Analysis, 2024
        • By Form
        • By Ingredients
        • By Consumer Orientation
        • By Application
        • By Distribution Channel
    • Canada
      • Pricing Analysis
      • Market Share Analysis, 2024
        • By Form
        • By Ingredients
        • By Consumer Orientation
        • By Application
        • By Distribution Channel
    • Brazil
      • Pricing Analysis
      • Market Share Analysis, 2024
        • By Form
        • By Ingredients
        • By Consumer Orientation
        • By Application
        • By Distribution Channel
    • Mexico
      • Pricing Analysis
      • Market Share Analysis, 2024
        • By Form
        • By Ingredients
        • By Consumer Orientation
        • By Application
        • By Distribution Channel
    • Argentina
      • Pricing Analysis
      • Market Share Analysis, 2024
        • By Form
        • By Ingredients
        • By Consumer Orientation
        • By Application
        • By Distribution Channel
  20. Market Structure Analysis
    • Competition Dashboard
    • Competition Benchmarking
    • Market Share Analysis of Top Players
      • By Regional
      • By Form
      • By Ingredients
      • By Consumer Orientation
      • By Application
      • By Distribution Channel
  21. Competition Analysis
    • Competition Deep Dive
      • Glanbia plc
        • Overview
        • Product Portfolio
        • Profitability by Market Segments (Product/Age /Sales Channel/Region)
        • Sales Footprint
        • Strategy Overview
          • Marketing Strategy
          • Product Strategy
          • Channel Strategy
      • Jarrow Formulas, Inc.
        • Overview
        • Product Portfolio
        • Profitability by Market Segments (Product/Age /Sales Channel/Region)
        • Sales Footprint
        • Strategy Overview
          • Marketing Strategy
          • Product Strategy
          • Channel Strategy
      • Archer Daniels Midland Company
        • Overview
        • Product Portfolio
        • Profitability by Market Segments (Product/Age /Sales Channel/Region)
        • Sales Footprint
        • Strategy Overview
          • Marketing Strategy
          • Product Strategy
          • Channel Strategy
      • Nature’s Bounty
        • Overview
        • Product Portfolio
        • Profitability by Market Segments (Product/Age /Sales Channel/Region)
        • Sales Footprint
        • Strategy Overview
          • Marketing Strategy
          • Product Strategy
          • Channel Strategy
      • Herbalife International of America, Inc
        • Overview
        • Product Portfolio
        • Profitability by Market Segments (Product/Age /Sales Channel/Region)
        • Sales Footprint
        • Strategy Overview
          • Marketing Strategy
          • Product Strategy
          • Channel Strategy
      • Blackmores
        • Overview
        • Product Portfolio
        • Profitability by Market Segments (Product/Age /Sales Channel/Region)
        • Sales Footprint
        • Strategy Overview
          • Marketing Strategy
          • Product Strategy
          • Channel Strategy
      • Nutraceutical International Corporation
        • Overview
        • Product Portfolio
        • Profitability by Market Segments (Product/Age /Sales Channel/Region)
        • Sales Footprint
        • Strategy Overview
          • Marketing Strategy
          • Product Strategy
          • Channel Strategy
      • Gaia Herbs
        • Overview
        • Product Portfolio
        • Profitability by Market Segments (Product/Age /Sales Channel/Region)
        • Sales Footprint
        • Strategy Overview
          • Marketing Strategy
          • Product Strategy
          • Channel Strategy
      • Jarrow Formulas, Inc
        • Overview
        • Product Portfolio
        • Profitability by Market Segments (Product/Age /Sales Channel/Region)
        • Sales Footprint
        • Strategy Overview
          • Marketing Strategy
          • Product Strategy
          • Channel Strategy
      • Ancient GreenFields Pvt. Ltd
        • Overview
        • Product Portfolio
        • Profitability by Market Segments (Product/Age /Sales Channel/Region)
        • Sales Footprint
        • Strategy Overview
          • Marketing Strategy
          • Product Strategy
          • Channel Strategy
  22. Assumptions & Acronyms Used
  23. Research Methodology

List of Tables

  • Table 1: Global Market Value (USD Billion) Forecast by Region, 2020-2035
  • Table 2: Global Market Volume (Metric Tons) Forecast by Region, 2020-2035
  • Table 3: Global Market Value (USD Billion) Forecast by Form, 2020-2035
  • Table 4: Global Market Volume (Metric Tons) Forecast by Form, 2020-2035
  • Table 5: Global Market Value (USD Billion) Forecast by Ingredients, 2020-2035
  • Table 6: Global Market Volume (Metric Tons) Forecast by Ingredients, 2020-2035
  • Table 7: Global Market Value (USD Billion) Forecast by Consumer Orientation, 2020-2035
  • Table 8: Global Market Volume (Metric Tons) Forecast by Consumer Orientation, 2020-2035
  • Table 9: Global Market Value (USD Billion) Forecast by Application, 2020-2035
  • Table 10: Global Market Volume (Metric Tons) Forecast by Application, 2020-2035
  • Table 11: Global Market Value (USD Billion) Forecast by Distribution Channel, 2020-2035
  • Table 12: Global Market Volume (Metric Tons) Forecast by Distribution Channel, 2020-2035
  • Table 13: North America Market Value (USD Billion) Forecast by Country, 2020-2035
  • Table 14: North America Market Volume (Metric Tons) Forecast by Country, 2020-2035
  • Table 15: North America Market Value (USD Billion) Forecast by Form, 2020-2035
  • Table 16: North America Market Volume (Metric Tons) Forecast by Form, 2020-2035
  • Table 17: North America Market Value (USD Billion) Forecast by Ingredients, 2020-2035
  • Table 18: North America Market Volume (Metric Tons) Forecast by Ingredients, 2020-2035
  • Table 19: North America Market Value (USD Billion) Forecast by Consumer Orientation, 2020-2035
  • Table 20: North America Market Volume (Metric Tons) Forecast by Consumer Orientation, 2020-2035
  • Table 21: North America Market Value (USD Billion) Forecast by Application, 2020-2035
  • Table 22: North America Market Volume (Metric Tons) Forecast by Application, 2020-2035
  • Table 23: North America Market Value (USD Billion) Forecast by Distribution Channel, 2020-2035
  • Table 24: North America Market Volume (Metric Tons) Forecast by Distribution Channel, 2020-2035
  • Table 25: Latin America Market Value (USD Billion) Forecast by Country, 2020-2035
  • Table 26: Latin America Market Volume (Metric Tons) Forecast by Country, 2020-2035
  • Table 27: Latin America Market Value (USD Billion) Forecast by Form, 2020-2035
  • Table 28: Latin America Market Volume (Metric Tons) Forecast by Form, 2020-2035
  • Table 29: Latin America Market Value (USD Billion) Forecast by Ingredients, 2020-2035
  • Table 30: Latin America Market Volume (Metric Tons) Forecast by Ingredients, 2020-2035
  • Table 31: Latin America Market Value (USD Billion) Forecast by Consumer Orientation, 2020-2035
  • Table 32: Latin America Market Volume (Metric Tons) Forecast by Consumer Orientation, 2020-2035
  • Table 33: Latin America Market Value (USD Billion) Forecast by Application, 2020-2035
  • Table 34: Latin America Market Volume (Metric Tons) Forecast by Application, 2020-2035
  • Table 35: Latin America Market Value (USD Billion) Forecast by Distribution Channel, 2020-2035
  • Table 36: Latin America Market Volume (Metric Tons) Forecast by Distribution Channel, 2020-2035
  • Table 37: Western Europe Market Value (USD Billion) Forecast by Country, 2020-2035
  • Table 38: Western Europe Market Volume (Metric Tons) Forecast by Country, 2020-2035
  • Table 39: Western Europe Market Value (USD Billion) Forecast by Form, 2020-2035
  • Table 40: Western Europe Market Volume (Metric Tons) Forecast by Form, 2020-2035
  • Table 41: Western Europe Market Value (USD Billion) Forecast by Ingredients, 2020-2035
  • Table 42: Western Europe Market Volume (Metric Tons) Forecast by Ingredients, 2020-2035
  • Table 43: Western Europe Market Value (USD Billion) Forecast by Consumer Orientation, 2020-2035
  • Table 44: Western Europe Market Volume (Metric Tons) Forecast by Consumer Orientation, 2020-2035
  • Table 45: Western Europe Market Value (USD Billion) Forecast by Application, 2020-2035
  • Table 46: Western Europe Market Volume (Metric Tons) Forecast by Application, 2020-2035
  • Table 47: Western Europe Market Value (USD Billion) Forecast by Distribution Channel, 2020-2035
  • Table 48: Western Europe Market Volume (Metric Tons) Forecast by Distribution Channel, 2020-2035
  • Table 49: Eastern Europe Market Value (USD Billion) Forecast by Country, 2020-2035
  • Table 50: Eastern Europe Market Volume (Metric Tons) Forecast by Country, 2020-2035
  • Table 51: Eastern Europe Market Value (USD Billion) Forecast by Form, 2020-2035
  • Table 52: Eastern Europe Market Volume (Metric Tons) Forecast by Form, 2020-2035
  • Table 53: Eastern Europe Market Value (USD Billion) Forecast by Ingredients, 2020-2035
  • Table 54: Eastern Europe Market Volume (Metric Tons) Forecast by Ingredients, 2020-2035
  • Table 55: Eastern Europe Market Value (USD Billion) Forecast by Consumer Orientation, 2020-2035
  • Table 56: Eastern Europe Market Volume (Metric Tons) Forecast by Consumer Orientation, 2020-2035
  • Table 57: Eastern Europe Market Value (USD Billion) Forecast by Application, 2020-2035
  • Table 58: Eastern Europe Market Volume (Metric Tons) Forecast by Application, 2020-2035
  • Table 59: Eastern Europe Market Value (USD Billion) Forecast by Distribution Channel, 2020-2035
  • Table 60: Eastern Europe Market Volume (Metric Tons) Forecast by Distribution Channel, 2020-2035
  • Table 61: East Asia Market Value (USD Billion) Forecast by Country, 2020-2035
  • Table 62: East Asia Market Volume (Metric Tons) Forecast by Country, 2020-2035
  • Table 63: East Asia Market Value (USD Billion) Forecast by Form, 2020-2035
  • Table 64: East Asia Market Volume (Metric Tons) Forecast by Form, 2020-2035
  • Table 65: East Asia Market Value (USD Billion) Forecast by Ingredients, 2020-2035
  • Table 66: East Asia Market Volume (Metric Tons) Forecast by Ingredients, 2020-2035
  • Table 67: East Asia Market Value (USD Billion) Forecast by Consumer Orientation, 2020-2035
  • Table 68: East Asia Market Volume (Metric Tons) Forecast by Consumer Orientation, 2020-2035
  • Table 69: East Asia Market Value (USD Billion) Forecast by Application, 2020-2035
  • Table 70: East Asia Market Volume (Metric Tons) Forecast by Application, 2020-2035
  • Table 71: East Asia Market Value (USD Billion) Forecast by Distribution Channel, 2020-2035
  • Table 72: East Asia Market Volume (Metric Tons) Forecast by Distribution Channel, 2020-2035
  • Table 73: South Asia & Pacific Market Value (USD Billion) Forecast by Country, 2020-2035
  • Table 74: South Asia & Pacific Market Volume (Metric Tons) Forecast by Country, 2020-2035
  • Table 75: South Asia & Pacific Market Value (USD Billion) Forecast by Form, 2020-2035
  • Table 76: South Asia & Pacific Market Volume (Metric Tons) Forecast by Form, 2020-2035
  • Table 77: South Asia & Pacific Market Value (USD Billion) Forecast by Ingredients, 2020-2035
  • Table 78: South Asia & Pacific Market Volume (Metric Tons) Forecast by Ingredients, 2020-2035
  • Table 79: South Asia & Pacific Market Value (USD Billion) Forecast by Consumer Orientation, 2020-2035
  • Table 80: South Asia & Pacific Market Volume (Metric Tons) Forecast by Consumer Orientation, 2020-2035
  • Table 81: South Asia & Pacific Market Value (USD Billion) Forecast by Application, 2020-2035
  • Table 82: South Asia & Pacific Market Volume (Metric Tons) Forecast by Application, 2020-2035
  • Table 83: South Asia & Pacific Market Value (USD Billion) Forecast by Distribution Channel, 2020-2035
  • Table 84: South Asia & Pacific Market Volume (Metric Tons) Forecast by Distribution Channel, 2020-2035
  • Table 85: Middle East and Africa Market Value (USD Billion) Forecast by Country, 2020-2035
  • Table 86: Middle East and Africa Market Volume (Metric Tons) Forecast by Country, 2020-2035
  • Table 87: Middle East and Africa Market Value (USD Billion) Forecast by Form, 2020-2035
  • Table 88: Middle East and Africa Market Volume (Metric Tons) Forecast by Form, 2020-2035
  • Table 89: Middle East and Africa Market Value (USD Billion) Forecast by Ingredients, 2020-2035
  • Table 90: Middle East and Africa Market Volume (Metric Tons) Forecast by Ingredients, 2020-2035
  • Table 91: Middle East and Africa Market Value (USD Billion) Forecast by Consumer Orientation, 2020-2035
  • Table 92: Middle East and Africa Market Volume (Metric Tons) Forecast by Consumer Orientation, 2020-2035
  • Table 93: Middle East and Africa Market Value (USD Billion) Forecast by Application, 2020-2035
  • Table 94: Middle East and Africa Market Volume (Metric Tons) Forecast by Application, 2020-2035
  • Table 95: Middle East and Africa Market Value (USD Billion) Forecast by Distribution Channel, 2020-2035
  • Table 96: Middle East and Africa Market Volume (Metric Tons) Forecast by Distribution Channel, 2020-2035

List of Figures

  • Figure 1: Global Market Volume (Metric Tons) Forecast 2020-2035
  • Figure 2: Global Market Pricing Analysis
  • Figure 3: Global Market Value (USD Billion) Forecast 2020-2035
  • Figure 4: Global Market Value Share and BPS Analysis by Form, 2025 and 2035
  • Figure 5: Global Market Y-o-Y Growth Comparison by Form, 2025-2035
  • Figure 6: Global Market Attractiveness Analysis by Form
  • Figure 7: Global Market Value Share and BPS Analysis by Ingredients, 2025 and 2035
  • Figure 8: Global Market Y-o-Y Growth Comparison by Ingredients, 2025-2035
  • Figure 9: Global Market Attractiveness Analysis by Ingredients
  • Figure 10: Global Market Value Share and BPS Analysis by Consumer Orientation, 2025 and 2035
  • Figure 11: Global Market Y-o-Y Growth Comparison by Consumer Orientation, 2025-2035
  • Figure 12: Global Market Attractiveness Analysis by Consumer Orientation
  • Figure 13: Global Market Value Share and BPS Analysis by Application, 2025 and 2035
  • Figure 14: Global Market Y-o-Y Growth Comparison by Application, 2025-2035
  • Figure 15: Global Market Attractiveness Analysis by Application
  • Figure 16: Global Market Value Share and BPS Analysis by Distribution Channel, 2025 and 2035
  • Figure 17: Global Market Y-o-Y Growth Comparison by Distribution Channel, 2025-2035
  • Figure 18: Global Market Attractiveness Analysis by Distribution Channel
  • Figure 19: Global Market Value (USD Billion) Share and BPS Analysis by Region, 2025 and 2035
  • Figure 20: Global Market Y-o-Y Growth Comparison by Region, 2025-2035
  • Figure 21: Global Market Attractiveness Analysis by Region
  • Figure 22: North America Market Incremental $ Opportunity, 2025-2035
  • Figure 23: Latin America Market Incremental $ Opportunity, 2025-2035
  • Figure 24: Western Europe Market Incremental $ Opportunity, 2025-2035
  • Figure 25: Eastern Europe Market Incremental $ Opportunity, 2025-2035
  • Figure 26: East Asia Market Incremental $ Opportunity, 2025-2035
  • Figure 27: South Asia & Pacific Market Incremental $ Opportunity, 2025-2035
  • Figure 28: Middle East and Africa Market Incremental $ Opportunity, 2025-2035
  • Figure 29: North America Market Value Share and BPS Analysis by Country, 2025 and 2035
  • Figure 30: North America Market Value Share and BPS Analysis by Form, 2025 and 2035
  • Figure 31: North America Market Y-o-Y Growth Comparison by Form, 2025-2035
  • Figure 32: North America Market Attractiveness Analysis by Form
  • Figure 33: North America Market Value Share and BPS Analysis by Ingredients, 2025 and 2035
  • Figure 34: North America Market Y-o-Y Growth Comparison by Ingredients, 2025-2035
  • Figure 35: North America Market Attractiveness Analysis by Ingredients
  • Figure 36: North America Market Value Share and BPS Analysis by Consumer Orientation, 2025 and 2035
  • Figure 37: North America Market Y-o-Y Growth Comparison by Consumer Orientation, 2025-2035
  • Figure 38: North America Market Attractiveness Analysis by Consumer Orientation
  • Figure 39: North America Market Value Share and BPS Analysis by Application, 2025 and 2035
  • Figure 40: North America Market Y-o-Y Growth Comparison by Application, 2025-2035
  • Figure 41: North America Market Attractiveness Analysis by Application
  • Figure 42: North America Market Value Share and BPS Analysis by Distribution Channel, 2025 and 2035
  • Figure 43: North America Market Y-o-Y Growth Comparison by Distribution Channel, 2025-2035
  • Figure 44: North America Market Attractiveness Analysis by Distribution Channel
  • Figure 45: Latin America Market Value Share and BPS Analysis by Country, 2025 and 2035
  • Figure 46: Latin America Market Value Share and BPS Analysis by Form, 2025 and 2035
  • Figure 47: Latin America Market Y-o-Y Growth Comparison by Form, 2025-2035
  • Figure 48: Latin America Market Attractiveness Analysis by Form
  • Figure 49: Latin America Market Value Share and BPS Analysis by Ingredients, 2025 and 2035
  • Figure 50: Latin America Market Y-o-Y Growth Comparison by Ingredients, 2025-2035
  • Figure 51: Latin America Market Attractiveness Analysis by Ingredients
  • Figure 52: Latin America Market Value Share and BPS Analysis by Consumer Orientation, 2025 and 2035
  • Figure 53: Latin America Market Y-o-Y Growth Comparison by Consumer Orientation, 2025-2035
  • Figure 54: Latin America Market Attractiveness Analysis by Consumer Orientation
  • Figure 55: Latin America Market Value Share and BPS Analysis by Application, 2025 and 2035
  • Figure 56: Latin America Market Y-o-Y Growth Comparison by Application, 2025-2035
  • Figure 57: Latin America Market Attractiveness Analysis by Application
  • Figure 58: Latin America Market Value Share and BPS Analysis by Distribution Channel, 2025 and 2035
  • Figure 59: Latin America Market Y-o-Y Growth Comparison by Distribution Channel, 2025-2035
  • Figure 60: Latin America Market Attractiveness Analysis by Distribution Channel
  • Figure 61: Western Europe Market Value Share and BPS Analysis by Country, 2025 and 2035
  • Figure 62: Western Europe Market Value Share and BPS Analysis by Form, 2025 and 2035
  • Figure 63: Western Europe Market Y-o-Y Growth Comparison by Form, 2025-2035
  • Figure 64: Western Europe Market Attractiveness Analysis by Form
  • Figure 65: Western Europe Market Value Share and BPS Analysis by Ingredients, 2025 and 2035
  • Figure 66: Western Europe Market Y-o-Y Growth Comparison by Ingredients, 2025-2035
  • Figure 67: Western Europe Market Attractiveness Analysis by Ingredients
  • Figure 68: Western Europe Market Value Share and BPS Analysis by Consumer Orientation, 2025 and 2035
  • Figure 69: Western Europe Market Y-o-Y Growth Comparison by Consumer Orientation, 2025-2035
  • Figure 70: Western Europe Market Attractiveness Analysis by Consumer Orientation
  • Figure 71: Western Europe Market Value Share and BPS Analysis by Application, 2025 and 2035
  • Figure 72: Western Europe Market Y-o-Y Growth Comparison by Application, 2025-2035
  • Figure 73: Western Europe Market Attractiveness Analysis by Application
  • Figure 74: Western Europe Market Value Share and BPS Analysis by Distribution Channel, 2025 and 2035
  • Figure 75: Western Europe Market Y-o-Y Growth Comparison by Distribution Channel, 2025-2035
  • Figure 76: Western Europe Market Attractiveness Analysis by Distribution Channel
  • Figure 77: Eastern Europe Market Value Share and BPS Analysis by Country, 2025 and 2035
  • Figure 78: Eastern Europe Market Value Share and BPS Analysis by Form, 2025 and 2035
  • Figure 79: Eastern Europe Market Y-o-Y Growth Comparison by Form, 2025-2035
  • Figure 80: Eastern Europe Market Attractiveness Analysis by Form
  • Figure 81: Eastern Europe Market Value Share and BPS Analysis by Ingredients, 2025 and 2035
  • Figure 82: Eastern Europe Market Y-o-Y Growth Comparison by Ingredients, 2025-2035
  • Figure 83: Eastern Europe Market Attractiveness Analysis by Ingredients
  • Figure 84: Eastern Europe Market Value Share and BPS Analysis by Consumer Orientation, 2025 and 2035
  • Figure 85: Eastern Europe Market Y-o-Y Growth Comparison by Consumer Orientation, 2025-2035
  • Figure 86: Eastern Europe Market Attractiveness Analysis by Consumer Orientation
  • Figure 87: Eastern Europe Market Value Share and BPS Analysis by Application, 2025 and 2035
  • Figure 88: Eastern Europe Market Y-o-Y Growth Comparison by Application, 2025-2035
  • Figure 89: Eastern Europe Market Attractiveness Analysis by Application
  • Figure 90: Eastern Europe Market Value Share and BPS Analysis by Distribution Channel, 2025 and 2035
  • Figure 91: Eastern Europe Market Y-o-Y Growth Comparison by Distribution Channel, 2025-2035
  • Figure 92: Eastern Europe Market Attractiveness Analysis by Distribution Channel
  • Figure 93: East Asia Market Value Share and BPS Analysis by Country, 2025 and 2035
  • Figure 94: East Asia Market Value Share and BPS Analysis by Form, 2025 and 2035
  • Figure 95: East Asia Market Y-o-Y Growth Comparison by Form, 2025-2035
  • Figure 96: East Asia Market Attractiveness Analysis by Form
  • Figure 97: East Asia Market Value Share and BPS Analysis by Ingredients, 2025 and 2035
  • Figure 98: East Asia Market Y-o-Y Growth Comparison by Ingredients, 2025-2035
  • Figure 99: East Asia Market Attractiveness Analysis by Ingredients
  • Figure 100: East Asia Market Value Share and BPS Analysis by Consumer Orientation, 2025 and 2035
  • Figure 101: East Asia Market Y-o-Y Growth Comparison by Consumer Orientation, 2025-2035
  • Figure 102: East Asia Market Attractiveness Analysis by Consumer Orientation
  • Figure 103: East Asia Market Value Share and BPS Analysis by Application, 2025 and 2035
  • Figure 104: East Asia Market Y-o-Y Growth Comparison by Application, 2025-2035
  • Figure 105: East Asia Market Attractiveness Analysis by Application
  • Figure 106: East Asia Market Value Share and BPS Analysis by Distribution Channel, 2025 and 2035
  • Figure 107: East Asia Market Y-o-Y Growth Comparison by Distribution Channel, 2025-2035
  • Figure 108: East Asia Market Attractiveness Analysis by Distribution Channel
  • Figure 109: South Asia & Pacific Market Value Share and BPS Analysis by Country, 2025 and 2035
  • Figure 110: South Asia & Pacific Market Value Share and BPS Analysis by Form, 2025 and 2035
  • Figure 111: South Asia & Pacific Market Y-o-Y Growth Comparison by Form, 2025-2035
  • Figure 112: South Asia & Pacific Market Attractiveness Analysis by Form
  • Figure 113: South Asia & Pacific Market Value Share and BPS Analysis by Ingredients, 2025 and 2035
  • Figure 114: South Asia & Pacific Market Y-o-Y Growth Comparison by Ingredients, 2025-2035
  • Figure 115: South Asia & Pacific Market Attractiveness Analysis by Ingredients
  • Figure 116: South Asia & Pacific Market Value Share and BPS Analysis by Consumer Orientation, 2025 and 2035
  • Figure 117: South Asia & Pacific Market Y-o-Y Growth Comparison by Consumer Orientation, 2025-2035
  • Figure 118: South Asia & Pacific Market Attractiveness Analysis by Consumer Orientation
  • Figure 119: South Asia & Pacific Market Value Share and BPS Analysis by Application, 2025 and 2035
  • Figure 120: South Asia & Pacific Market Y-o-Y Growth Comparison by Application, 2025-2035
  • Figure 121: South Asia & Pacific Market Attractiveness Analysis by Application
  • Figure 122: South Asia & Pacific Market Value Share and BPS Analysis by Distribution Channel, 2025 and 2035
  • Figure 123: South Asia & Pacific Market Y-o-Y Growth Comparison by Distribution Channel, 2025-2035
  • Figure 124: South Asia & Pacific Market Attractiveness Analysis by Distribution Channel
  • Figure 125: Middle East and Africa Market Value Share and BPS Analysis by Country, 2025 and 2035
  • Figure 126: Middle East and Africa Market Value Share and BPS Analysis by Form, 2025 and 2035
  • Figure 127: Middle East and Africa Market Y-o-Y Growth Comparison by Form, 2025-2035
  • Figure 128: Middle East and Africa Market Attractiveness Analysis by Form
  • Figure 129: Middle East and Africa Market Value Share and BPS Analysis by Ingredients, 2025 and 2035
  • Figure 130: Middle East and Africa Market Y-o-Y Growth Comparison by Ingredients, 2025-2035
  • Figure 131: Middle East and Africa Market Attractiveness Analysis by Ingredients
  • Figure 132: Middle East and Africa Market Value Share and BPS Analysis by Consumer Orientation, 2025 and 2035
  • Figure 133: Middle East and Africa Market Y-o-Y Growth Comparison by Consumer Orientation, 2025-2035
  • Figure 134: Middle East and Africa Market Attractiveness Analysis by Consumer Orientation
  • Figure 135: Middle East and Africa Market Value Share and BPS Analysis by Application, 2025 and 2035
  • Figure 136: Middle East and Africa Market Y-o-Y Growth Comparison by Application, 2025-2035
  • Figure 137: Middle East and Africa Market Attractiveness Analysis by Application
  • Figure 138: Middle East and Africa Market Value Share and BPS Analysis by Distribution Channel, 2025 and 2035
  • Figure 139: Middle East and Africa Market Y-o-Y Growth Comparison by Distribution Channel, 2025-2035
  • Figure 140: Middle East and Africa Market Attractiveness Analysis by Distribution Channel
  • Figure 141: Global Market - Tier Structure Analysis
  • Figure 142: Global Market - Company Share Analysis

Frequently Asked Questions

What is the projected size of the herbal supplement market in 2025?

The market is valued at USD 101.0 billion in 2025.

What is the outlook on herbal supplement demand by 2035?

The market is forecasted to reach USD 201.1 billion by 2035, reflecting a CAGR of 7.6%.

Which segment leads the herbal supplement market by consumer orientation in 2025?

Women will dominate the consumer orientation segment, accounting for 40% of the global market share in 2025.

What is the top application sector for the herbal supplement market in 2025?

Immune & digestive health will lead the application segment with a 35% share in 2025.

Which country is projected to have the fastest-growing herbal supplement market?

The United States is projected to grow at the highest rate, with a CAGR of 7.2% from 2025 to 2035.

Explore Similar Insights

Future Market Insights

Herbal Supplement Market