Plant-based Beverages Market
Surge in Veganism to Drive the Sales of Plant-based Beverages: FMI Explores Product Demand in 30+ Countries
Plant-based Beverages Market by Source, Nature, Format, Packaging, Sales Channel & Region | Forecast 2023 to 2033
Plant-based Beverages Market Outlook (2023 to 2033)
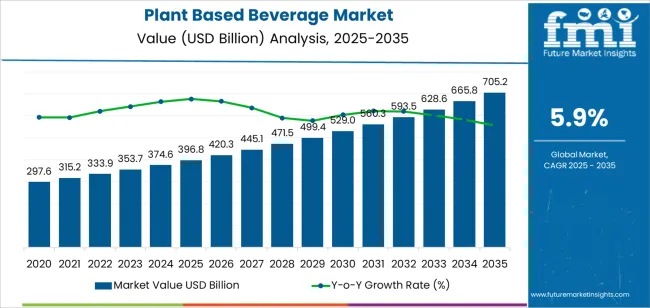
The global plant-based beverages market is expected to grow at a CAGR of 6.6% during the period 2023 to 2033. The market is valued at US$ 351.7 billion as of 2023, and by 2033, the market is expected to reach a valuation of US$ 668.9 billion.
Some of the factors which might surge the market growth are:
- High nutritional content is associated with the consumption of plants.
- Increased adoption of veganism and vegetarianism.
- Does not contribute to the increasing carbon footprints, thereby promoting the idea of sustainability.
The increase in the consumption of plant-based food, which has multiplied many times in the recent time period, is one of the primary drivers for the rise in demand for the product. Plant-based beverages have entered the mainstream and are showing no signs of slowing down. Dairy alternatives gaining traction as a healthier dietary option among consumers. Sales of plant-based milk are expected to increase significantly in 2023, providing chances for manufacturers to capitalize on this burgeoning market.
The global market for plant-based beverages is also being driven by the middle class's high disposable income and rising urbanization. People belonging to the age group of 18-40 years are more likely to choose plant-based food based on a survey conducted by British Nutrition Foundation. This is owing to the rising awareness pertaining to animal cruelty, as a result of which people are reducing the consumption of even milk-based products.
Plant-based beverages have been steadily growing in this fast-paced environment, but it has recently gained notoriety due to a rise in flexitarians. One-third of customers in the US and Europe now consider themselves flexitarians, as they want to add to their diet rather than restrict it. As a result, sales of plant-based beverages will increase.
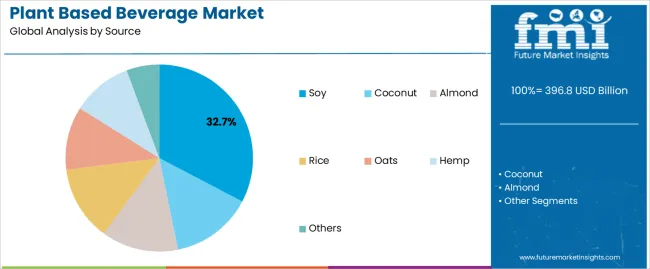
In terms of plant-based beverages rice milk, soymilk, and almond milk are some of the most widely consumed options. They are regarded as healthy since they contain a number of crucial vitamins and minerals. Additionally, they have no lactose and little to no fat and cholesterol. Based on data released by the National Institute of Diabetes and Digestive and Kidney Diseases, a staggering 65% of the world population suffers from lactose intolerance. This as well represents a lot of scope for the market.
In both the developed and developing markets, plant-based beverages have been particularly well-liked. The increase in dairy allergy causes can be blamed for this. The market for plant-based beverages is expanding as a result of rising health consciousness and disposable income. The introduction of new healthy components by various market participants is another element that contributes to the market's continued expansion.
Due to the rising dietary trend of adopting vegan diets and beverages due to customer concern about their health, the Asia-Pacific zone is predicted to lead the market. Additionally, the popularity of plant-based beverages among consumers is growing rapidly in the Asia-Pacific area.
Leading producers in Asian nations like India, China, and Japan are providing a variety of vegan beverages. The North American region, on the other hand, is anticipated to expand at a quicker CAGR because of the growing demands for plant-based beverages, organic juices, and dairy substitutes brought on by the high rates of diabetes and obesity.
Attributes |
Value |
Plant-based Beverages Market Value (2022) |
US$ 329.3 billion |
Plant-based Beverages Market Value (2023) |
US$ 351.7 billion |
Plant-based Beverages Market Forecast Value (2033) |
US$ 668.9 billion |
Plant-based Beverages Market Expected CAGR (2023 to 2033) |
6.6% |
Let us know your requirement to get
100% FREE customization
Historical Outlook (2017 to 2022) vs Future Projections: Stats Explained
Despite the increase in the popularity of plant-based beverages, the figures for the expected CAGR have been reduced as compared to the historical CAGR. The historical CAGR for the market was 7.3%, and the projected CAGR for the forecast period is 6.6%. The pandemic created supply chain disruptions which led to the scarcity of raw materials. Apart from that, brewing tensions amongst nations leading to war in some parts of the world has worsened the scenario.
However, the researchers from FMI are of the view that the prevailing situation may not exist for too long. Consequently, the plant-based beverages market would bounce back because of the marketing efforts of the manufacturers. FMI has anticipated short-term, medium-term, and long-term impacts on the market based on the research.
- Short term (2023 to 2026): Health and wellness have been increasingly fashionable in the post-covid era. The global wellness market was estimated to be worth more than $4 trillion in 2021. Consumers have been pushed to choose healthier alternatives to various meals as the number of people suffering from diabetes and obesity has increased. Apart from that, rapid urbanization and penetration of the internet are expected to surge the market growth.
- Medium-term (2026 to 2029): With the expansion of digital marketing, plant-based beverages are in a great position to take advantage of this expanding trend. During these times, the plant-based trend might have exploded in popularity in the beverage industry. The marketers would be cashing in on the health halo that makes plant-based beverages great platforms for functional additives.
- Long term (2029 to 2033): At this point in time, it is expected that people would be having a lot of awareness. This is to the extent that even when two products have identical nutrition facts labels, more than four out of ten shoppers believe plant-based options are healthier. Moreover, owing to the introduction of technologies like Web 3.0 and metaverse, choosing the right brand would become much easier.
Surging Awareness regarding the side-effects of Non-veg Food to Drive the Market
Healthcare experts are of the view that despite being a rich source of a lot of nutrients, excessive consumption of non-vegetarian food and beverages can take on a toll on health. One of the biggest drawbacks associated with the consumption of meats is that it may lead to poor digestion because of the high amount of protein. Certain medical studies have also pointed out that excess consumption of non-veg food can reduce lifespan.
The experts have also mentioned that increased consumption of red meat can lead to heart complications like hypertension, COPD, etc. One of the most important observations has been that high consumption of red meat is linked to cancer, especially colon cancer. Owing to these factors, a lot of people who would consume non-veg items are changing their diet chart and replacing them with vegetarian food. This represents a lot of potential for the plant-based beverages market, and a lot of people have started replacing the meat-based diet, especially breakfasts with plant-based beverages. These indicate the advantages of the plant-based beverage.
Find your sweet spots for generating winning opportunities in this market.
Talk to AnalystKey Trend: Global Manufacturers playing a crucial Role in Driving the Market
There are a number of manufacturers who are investing huge amounts in producing plant-based drinks. For example, in June 2022, Nestle introduced a new plant-based milk for toddlers aged 1-3 years. The best thing about this product is that apart from being a conventional milk alternative, it can be used as a general drink, and can be added to smoothies. The high nutritional content offered by this drink has been hugely appreciated by parents across the world and is receiving accolades.
Likewise, Three plant-based beverage brands, Koia Keto, Koia Core, and Koia Coffee, were introduced in 2019. Coconut milk, MCT oil, and plant-based protein make up the new product range. There are three flavors of Koia coffee, including Mocha Latte, Vanilla Latte, and Salted Caramel.
Providing consumers with more options for plant-based beverages that are rich in nutrition in 2020 was Califia Farms LP's stated goal.
The manufacturers are also working on products like meal replacement shakes, which are both plant-based and keto-friendly. Although keto gives a great opportunity for businesses that specialize in plant-based nutrition, it is still not widely accepted. Taking a keto-friendly stance by emphasizing the elements that will appeal to keto enthusiasts while remaining inclusive to all customers is the approach currently employed.
Adjacent View for Plant-based Beverages Market
Plant-based Beverages Market:
Attributes |
Plant-based Beverages Market |
Anticipated CAGR (2023 to 2033) |
6.6% |
Market Value (2023) |
US$ 351.7 billion |
Growth Factor |
High nutrition content, no contribution to Carbon footprints |
Future Opportunities |
Increase in the adoption of veganism |
Market Trends |
Global players focusing more on plant-based beverages |
Plant-based Snacks Market:
Attributes |
Plant-based Snacks Market |
Anticipated CAGR (2023 to 2033) |
8.7% |
Market Value (2023) |
US$ 34.3 billion |
Growth Factor |
Surging demand for convenience meals |
Future Opportunities |
Increasing awareness regarding the importance of fitness |
Market Trends |
Increasing interest in meat substitutes |
Plant-based Iron Supplements Market:
Attributes |
Plant-based Iron Supplements Market |
Anticipated CAGR (2023 to 2033) |
5.5% |
Market Value (2023) |
US$ 219.96 million |
Growth Factor |
Insufficient availability of iron in regular diet |
Future Opportunities |
Surging demand for clean-label ingredients |
Market Trends |
Ethical concerns over the usage of animal ingredients |

A unified Market Research Subscription Platform, built for today's disparate research needs.
Country-wise Analysis
Regions | North America |
Countries | USA |
CAGR (2023 to 2033) | 5.2% |
Regions | Europe |
Countries | UK |
CAGR (2023 to 2033) | 6.1% |
Regions | Asia Pacific |
Countries | China, Japan, India |
CAGR (2023 to 2033) | 7.4%, 4%, 7.1% |
Rising health consciousness to increase the sales of plant-based beverages in the USA
The almond-based plant-based beverages category dominated the market in terms of volume, with a revenue share of more than 50% in the USA. Consumers' increased disposable money, along with a growing awareness of healthier lifestyles, is driving the plant-based beverages market growth. Moreover, based on the statistics released by Statista, there are more than 15.5 million vegetarians in the US, and the numbers may rise.
Attributes |
Details |
USA Market Expected Size (2033) |
US$ 82.2 billion |
USA Market Absolute Dollar Growth (US$ Million/Billion) |
US$ 32.5 billion |
CAGR % 2017 to 2022 |
6.3% |
To attract more customers, manufacturers are employing novel plant-based packaging solutions. Glass bottles, pouches, cartons, and cans are increasingly available for plant-based beverages. Furthermore, the presence of a large number of companies dealing with plant-based products is expected to further surge the market share.
Rising nutritional intake to propel the market in the UK
Consumers are focused on simple and healthy vegetarian and plant-based beverages to boost immunity and preserve general health. Consumers are willing to pay more for beverages that have higher nutritional and medical benefits.
Attributes |
Details |
UK Market Expected Size (2033) |
US$ 13 billion |
UK Market Absolute Dollar Growth (US$ Million/Billion) |
US$ 5.8 billion |
CAGR % 2017 to 2022 |
7.2% |
Soy-based beverages are predicted to increase steadily over the forecast period, encouraging the plant-based beverages market in the UK. Thanks to rising consumer demand for nutritional and allergy-free drinks. Furthermore, as the UK economy is battling uncertainty, experts are of the opinion that consumption of cow-based products may turn out to be a costly affair. Instead, the analysts are of the view that consumption of plant-based alternatives would assist in saving huge sums of money.
Rising consumption of plant-based milk to boost the market in China
The use of plant-based milk in a variety of beverages is expected to boost owing to surging awareness regarding the availability of such products. Apart from that, a number of deaths owing to cardiovascular diseases have been reported in China. In 2019 alone, China reported 5.09 million CVD deaths. These figures certainly reveal the significance of plant-based beverages for the Chinese, as these beverages assist in the normal functioning of the heart.
Attributes |
Details |
China Market Expected Size (2033) |
US$ 114.9 billion |
China Market Absolute Dollar Growth (US$ Million/Billion) |
US$ 58.7 billion |
CAGR % 2017 to 2022 |
8.8% |
Apart from that, the manufacturers are also launching a number of flavoured products to capture consumer attention, and venturing into plant-based meat as well. Several small and medium-sized players are emerging to capture niche product segments. Therefore, they are launching hazelnut-based beverages, hemp-based beverages, and flax-based beverages in China. Leading companies offer various almond-based beverages, soy-based beverages, coconut-based beverages, oats-based beverages, and rice-based beverages.
The trend of reduced fat intake to boost the market in Japan
Japanese consumers are becoming more health-conscious, which is resulting in lower sugar and fat consumption, as well as higher protein consumption and overall nutritional balance, therefore, promoting the adoption of plant-based beverages in the country.
Attributes |
Details |
Japan Market Expected Size (2033) |
US$ 11.4 billion |
Japan Market Absolute Dollar Growth (US$ Million/Billion) |
US$ 3.7 billion |
CAGR % 2017 to 2022 |
4.7% |
The plant-based beverages market in the country has been driven by increased consumer spending power and the expanding adoption of a vegan diet. Moreover, the Japanese market is mainly driven by surging demand for soy-based products. The low price of soy milk coupled with a lot of health benefits is driving the sales of soy milk in Japan. Furthermore, even the almond milk market has been growing at a decent rate. This can be seen in the form of the huge acceptance of Almond Kouka.
Rise in demand for plant-based protein to propel the market in India
An increase in protein-fortified plant-based milk, innovative plant-based mixes, and barista adoption of oat milk are among recent category advances.
Attributes |
Details |
India Market Expected Size (2033) |
US$ 91.3 billion |
India Market Absolute Dollar Growth (US$ Million/Billion) |
US$ 45.2 billion |
CAGR % 2017 to 2022 |
9.7% |
In addition, as a result of the country's response to covid-19, online orders for plant-based milk have increased, boosting plant-based beverage sales in India. India can be considered a potential market, especially for soy-based drinks. Soybean production has been witnessing rapid expansion, which is due to the incentives provided by the government. For example, the Maharashtra government aims to cover nearly 400 soybean companies by the end of the plan, which started in June. The implementation of such policies has assisted in surging the arrival of soybean crops from 0.8 MMT to 1.5 MMT in December 2022 across India.
Segment-wise Insights
Segment | Source |
Attributes | Plant-based juices |
CAGR % 2017 to 2022 | 7.1% |
CAGR % 2023 to End of Forecast(2033) | 6.4% |
Segment | Nature |
Attributes | Conventional |
CAGR % 2017 to 2022 | 7.2% |
CAGR % 2023 to End of Forecast(2033) | 6% |
The rise in consumption of plant-based juices propelled the market growth
Consumers are growing more health-conscious, and they prefer plant-based juices to other beverages on the market, such as carbonated juices and energy drinks. Consumers are becoming more aware of the advantages of plant-based juices as well as the trend of pairing diverse flavours of food and beverages. Moreover, the fact that vegetable juices are low in carbs and can be included in the keto diet as well.
The packaging of these juices is done in such a manner that they are portable. Furthermore, rapid urbanisation has led to a number of corporates looking for ways to quench their thirst as soon as possible, and at the same time maintain a robust body. All these factors have led to an increase in the demand for plant-based juices.
Rising consumption of conventional plant-based beverages to boost the market
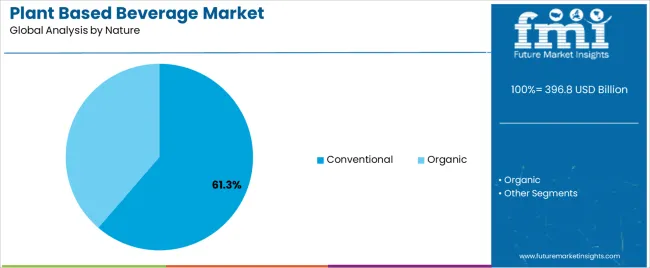
Conventional plant-based beverages are affordable as compared to organic beverages. Apart from that, despite the requirement for organic drinks, the market is witnessing a huge demand-supply gap. Furthermore, the production cost associated with organic drinks is much higher as compared to conventional drinks.
Organic plant-based beverages are estimated to surge because organic plant-based beverages are healthier and made with higher-quality natural ingredients. As a result, the vast majority of plant-based beverage makers use USDA-certified, organic, and non-GMO ingredients to gain consumer trust. This development is expected to have a favourable effect on overall plant-based beverages market demand.
Scope for innovation to boost the flavoured plant-based beverages market
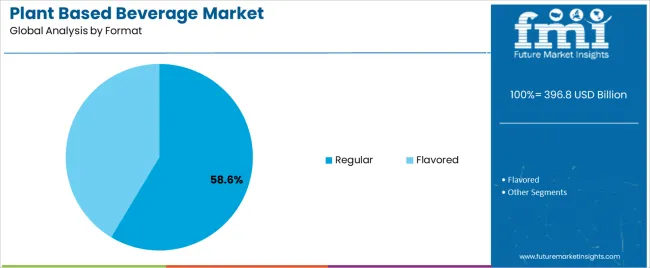
The flavoured segment of the plant-based beverages market stands at a market share of 27% in 2023 and is expected to rise at a CAGR of 7.6% by 2033. It is because producers of plant-based products are consistently providing consumers with more inventive items with distinctive ingredients and flavours. Plant-based beverage innovation helps address the growing customer demand for healthier beverages while maintaining the product's quality.
For example, the Indian subsidiary of American chocolate and confectionery company Hershey announced (December 2021) that it has expanded its portfolio of plant-based drink brand Sofit with the launch of the Sofit Almond drink.
Rising adoption of carton packaging driven by environmental concerns
Carton packaging of plant-based beverages stands at a market share of 64% in 2023 and is expected to rise at a CAGR of 7% by 2033. Carton packaging has been extremely popular among plant-based beverage manufacturers due to decreased (transport) costs and consumer convenience. Plant-based beverage manufacturers have also been pushed to use carton packaging as a result of rising sustainability concerns in various parts of the world.
Tetra Pak, for example, makes plant-based drinking containers entirely out of sustainable packaging materials. The Tetra Rex carton was created in collaboration with the bio-polymer manufacturer Braskem. This is made from sustainably derived paperboard and revolutionary bio-based plastics.
Optimized experience of a convenience store to boost the sales
The plant-based beverages market's convenience store distribution channel has a market share of 13.9% in 2023 and is predicted to grow at a CAGR of 6.0% by 2033.
Convenience stores are rapidly evolving to meet consumer demands for services that are up to date with developing technology, convenience, and upgraded experiences. Convenience store sales of plant-based beverages are increasing as a result of this. Apart from that, the touch and feel factor that is associated with these stores is expected to further surge the market share. Apart from that, the tie-ups of convenience stores with local players would ensure that these companies gain a lot more traction. This would certainly help in the economic growth as well if the local player turns out to be a huge company in the future.
Lactose-free Beverages turns out to be the Mantra for the Start-ups
The new players in the market are drawing the prospect’s attention by manufacturing lactose-free, gluten-free, and cholesterol-free beverages. The companies are making use of Artificial Intelligence to prepare the next generation of plant-based beverages that look and function the same way as animal-based beverages.
Ripple Foods was started in 2014. The start-up is into manufacturing dairy-free milk and milk products. It extracts protein from peas and combines it with fat and sugar to create milk-like products. The start-up has also claimed that all its products are vegan. In September 2021, Ripple Foods raised US$ 60 million in the series E funding round which was led by Rage Capital, Ajax Strategies, and S2G Ventures.
Major Players counting upon Energy Efficiency for Productivity
The key players operating in the market are focusing on digital innovation and engineering expertise to drive energy efficiency. This is done to accelerate the decarbonization journey. Furthermore, the manufacturers are also forming strategic partnerships with local renewable energy providers to surge energy resilience.
For example, Danone announced ‘Refuel Danone’, to transform energy footprints to make operations agile, energy efficient, and more sustainable.
Some of the recent developments in the plant-based beverages market are:
- In April 2022, Danone formed a strategic alliance with CCU for its water business in Argentina.
- In December 2022, Pacific Foods announced that Minneapolis-based Little & Co. will be its lead strategy and creative agency.
The top players in this market are:
Company |
Description |
Danone S.A. |
Danone S.A. has been a part of this industry for more than a century. The company has always been faithful to its original purpose of selling healthy, delicious products tailored to fulfill nutritional needs. Apart from that, the company has also been manufacturing innovative, top-quality products that meet the expectations of consumers at every stage. The company has always worked on the mission of ‘One Planet, One Health’. It is a by default call to action for the company. It is aimed at a movement that nurtures the adoption of healthier, more sustainable eating and drinking habits. |
Pacific Foods of Oregon |
Pacific Foods of Oregon has always been manufacturing premium quality ingredients for soup, broth, stock, and plant-based milk. Apart from that, the company has also been manufacturing organic, plant-based, kusher, and gluten-free products for setting the right mood. For more than 2 decades, the company has been innovating in the space of plant-based beverages and organic soups. The company has always offered the breadth of products that the customers are seeking. Each variety of the Barista Series™ Plant-Based Beverages withstands the high heat of steaming. |
Daikin Industries |
Daikin has always believed that the air in each space should be ideally suited to the available environment. Thus, the company has always taken efforts to manage the temperature. The research conducted by the company promises the ability to modulate sensory elements. The company has always taken steps to create value by anticipating future needs. Moreover, the company has also taken steps to contribute to society in the best possible manner. |
Other companies profiled are United Technologies and China International Marine Containers.
Plant-based Beverages Market Segmentation
By Source:
- Dairy Alternatives (Almond Milk, Soy Milk, Coconut Milk, Rice Milk, Oats Milk, Seed Milk, Cashew Milk, and Others)
- RTD Drinks (Coffee, Tea),
- Plant-based Juices (Fruit, Vegetable)
By Nature:
- Organic,
- Conventional
By Format:
- Regular
- Flavoured
By Packaging:
- Glass Bottles
- Plastic Bottles and Pouches
- Carton Packaging
- Cans
By Sales Channel:
- Hypermarkets/Supermarkets
- Convenience Stores
- Independent Small Groceries
- Speciality Stores
- Online Retailers
By Region:
- North America
- Western Europe
- Eastern Europe
- Latin America
- Asia-Pacific excluding Japan (APEJ)
- Japan
- Middle East and Africa (MEA)
Frequently Asked Questions
What is the Plant-based Beverages Market size as of 2023?
The global plant-based beverages market holds a valuation of US$ 351.7 billion as of 2023.
At what rate would Plant-based Beverages Market Grow?
The plant-based beverages market is expected to grow at 6.6% CAGR from 2023 to 2033.
What is the Demand Outlook for the Plant-based Beverages Market?
The global plant-based beverages market is forecasted to surpass US$ 668.9 billion by 2033.
Which Region is the Largest Plant-based Beverages Market?
Asia Pacific is the largest plant-based beverage market.
What are the Main Drivers of the Plant-based Beverages Market?
The main drivers are the increased adoption of veganism and the side effects of the consumption of non-veg food.
Table of Content
1. Executive Summary | Plant-based Beverages Market 1.1. Global Market Outlook 1.2. Demand-side Trends 1.3. Supply-side Trends 1.4. Technology Roadmap Analysis 1.5. Analysis and Recommendations 2. Market Overview 2.1. Market Coverage / Taxonomy 2.2. Market Definition / Scope / Limitations 3. Market Background 3.1. Market Dynamics 3.1.1. Drivers 3.1.2. Restraints 3.1.3. Opportunity 3.1.4. Trends 3.2. Scenario Forecast 3.2.1. Demand in Optimistic Scenario 3.2.2. Demand in Likely Scenario 3.2.3. Demand in Conservative Scenario 3.3. Opportunity Map Analysis 3.4. Product Life Cycle Analysis 3.5. Supply Chain Analysis 3.5.1. Supply Side Participants and their Roles 3.5.1.1. Producers 3.5.1.2. Mid-Level Participants (Traders/ Agents/ Brokers) 3.5.1.3. Wholesalers and Distributors 3.5.2. Value Added and Value Created at Node in the Supply Chain 3.5.3. List of Raw Material Suppliers 3.5.4. List of Existing and Potential Buyers 3.6. Investment Feasibility Matrix 3.7. Value Chain Analysis 3.7.1. Profit Margin Analysis 3.7.2. Wholesalers and Distributors 3.7.3. Retailers 3.8. PESTLE and Porter’s Analysis 3.9. Regulatory Landscape 3.9.1. By Key Regions 3.9.2. By Key Countries 3.10. Regional Parent Market Outlook 3.11. Production and Consumption Statistics 3.12. Import and Export Statistics 4. Global Market Analysis 2017 to 2022 and Forecast, 2023 to 2033 4.1. Historical Market Size Value (US$ Million) & Volume (Litres) Analysis, 2017 to 2022 4.2. Current and Future Market Size Value (US$ Million) & Volume (Litres) Projections, 2023 to 2033 4.2.1. Y-o-Y Growth Trend Analysis 4.2.2. Absolute $ Opportunity Analysis 5. Global Market Analysis 2017 to 2022 and Forecast 2023 to 2033, By Source 5.1. Introduction / Key Findings 5.2. Historical Market Size Value (US$ Million) & Volume (Litres) Analysis By Source, 2017 to 2022 5.3. Current and Future Market Size Value (US$ Million) & Volume (Litres) Analysis and Forecast By Source, 2023 to 2033 5.3.1. Dairy Alternatives 5.3.1.1. Almond Milk 5.3.1.2. Soy Milk 5.3.1.3. Coconut Milk 5.3.1.4. Rice Milk 5.3.1.5. Oats Milk 5.3.1.6. Seed Milk 5.3.1.7. Cashew Milk 5.3.1.8. Others 5.3.2. RTD Drinks 5.3.2.1. Coffee 5.3.2.2. Tea 5.3.3. Plant-Based Juices 5.3.3.1. Fruit 5.3.3.2. Vegetable 5.4. Y-o-Y Growth Trend Analysis By Source, 2017 to 2022 5.5. Absolute $ Opportunity Analysis By Source, 2023 to 2033 6. Global Market Analysis 2017 to 2022 and Forecast 2023 to 2033, By Nature 6.1. Introduction / Key Findings 6.2. Historical Market Size Value (US$ Million) & Volume (Litres) Analysis By Nature, 2017 to 2022 6.3. Current and Future Market Size Value (US$ Million) & Volume (Litres) Analysis and Forecast By Nature, 2023 to 2033 6.3.1. Organic 6.3.2. Conventional 6.4. Y-o-Y Growth Trend Analysis By Nature, 2017 to 2022 6.5. Absolute $ Opportunity Analysis By Nature, 2023 to 2033 7. Global Market Analysis 2017 to 2022 and Forecast 2023 to 2033, By Format 7.1. Introduction / Key Findings 7.2. Historical Market Size Value (US$ Million) & Volume (Litres) Analysis By Format, 2017 to 2022 7.3. Current and Future Market Size Value (US$ Million) & Volume (Litres) Analysis and Forecast By Format, 2023 to 2033 7.3.1. Regular 7.3.2. Flavored 7.4. Y-o-Y Growth Trend Analysis By Format, 2017 to 2022 7.5. Absolute $ Opportunity Analysis By Format, 2023 to 2033 8. Global Market Analysis 2017 to 2022 and Forecast 2023 to 2033, By Packaging 8.1. Introduction / Key Findings 8.2. Historical Market Size Value (US$ Million) & Volume (Litres) Analysis By Packaging, 2017 to 2022 8.3. Current and Future Market Size Value (US$ Million) & Volume (Litres) Analysis and Forecast By Packaging, 2023 to 2033 8.3.1. Glass Bottles 8.3.2. Plastic Bottles & Pouches 8.3.3. Carton Packaging 8.3.4. Cans 8.4. Y-o-Y Growth Trend Analysis By Packaging, 2017 to 2022 8.5. Absolute $ Opportunity Analysis By Packaging, 2023 to 2033 9. Global Market Analysis 2017 to 2022 and Forecast 2023 to 2033, By Sales Channel 9.1. Introduction / Key Findings 9.2. Historical Market Size Value (US$ Million) & Volume (Litres) Analysis By Sales Channel, 2017 to 2022 9.3. Current and Future Market Size Value (US$ Million) & Volume (Litres) Analysis and Forecast By Sales Channel, 2023 to 2033 9.3.1. Hypermarkets/Supermarkets 9.3.2. Convenience Stores 9.3.3. Independent Small Groceries 9.3.4. Speciality Stores 9.3.5. Online Retailers 9.4. Y-o-Y Growth Trend Analysis By Sales Channel, 2017 to 2022 9.5. Absolute $ Opportunity Analysis By Sales Channel, 2023 to 2033 10. Global Market Analysis 2017 to 2022 and Forecast 2023 to 2033, By Region 10.1. Introduction 10.2. Historical Market Size Value (US$ Million) & Volume (Litres) Analysis By Region, 2017 to 2022 10.3. Current Market Size Value (US$ Million) & Volume (Litres) Analysis and Forecast By Region, 2023 to 2033 10.3.1. North America 10.3.2. Latin America 10.3.3. Western Europe 10.3.4. Eastern Europe 10.3.5. Asia-Pacific excluding Japan (APEJ) 10.3.6. Japan 10.3.7. Middle East and Africa (MEA) 10.4. Market Attractiveness Analysis By Region 11. North America Market Analysis 2017 to 2022 and Forecast 2023 to 2033, By Country 11.1. Historical Market Size Value (US$ Million) & Volume (Litres) Trend Analysis By Market Taxonomy, 2017 to 2022 11.2. Market Size Value (US$ Million) & Volume (Litres) Forecast By Market Taxonomy, 2023 to 2033 11.2.1. By Country 11.2.1.1. United States of America 11.2.1.2. Canada 11.2.2. By Source 11.2.3. By Nature 11.2.4. By Format 11.2.5. By Packaging 11.2.6. By Sales Channel 11.3. Market Attractiveness Analysis 11.3.1. By Country 11.3.2. By Source 11.3.3. By Nature 11.3.4. By Format 11.3.5. By Packaging 11.3.6. By Sales Channel 11.4. Key Takeaways 12. Latin America Market Analysis 2017 to 2022 and Forecast 2023 to 2033, By Country 12.1. Historical Market Size Value (US$ Million) & Volume (Litres) Trend Analysis By Market Taxonomy, 2017 to 2022 12.2. Market Size Value (US$ Million) & Volume (Litres) Forecast By Market Taxonomy, 2023 to 2033 12.2.1. By Country 12.2.1.1. Brazil 12.2.1.2. Mexico 12.2.1.3. Rest of Latin America 12.2.2. By Source 12.2.3. By Nature 12.2.4. By Format 12.2.5. By Packaging 12.2.6. By Sales Channel 12.3. Market Attractiveness Analysis 12.3.1. By Country 12.3.2. By Source 12.3.3. By Nature 12.3.4. By Format 12.3.5. By Packaging 12.3.6. By Sales Channel 12.4. Key Takeaways 13. Western Europe Market Analysis 2017 to 2022 and Forecast 2023 to 2033, By Country 13.1. Historical Market Size Value (US$ Million) & Volume (Litres) Trend Analysis By Market Taxonomy, 2017 to 2022 13.2. Market Size Value (US$ Million) & Volume (Litres) Forecast By Market Taxonomy, 2023 to 2033 13.2.1. By Country 13.2.1.1. Germany 13.2.1.2. United Kingdom 13.2.1.3. France 13.2.1.4. Italy 13.2.1.5. Spain 13.2.1.6. Benelux 13.2.1.7. Nordic 13.2.1.8. Rest of Western Europe 13.2.2. By Source 13.2.3. By Nature 13.2.4. By Format 13.2.5. By Packaging 13.2.6. By Sales Channel 13.3. Market Attractiveness Analysis 13.3.1. By Country 13.3.2. By Source 13.3.3. By Nature 13.3.4. By Format 13.3.5. By Packaging 13.3.6. By Sales Channel 13.4. Key Takeaways 14. Eastern Europe Market Analysis 2017 to 2022 and Forecast 2023 to 2033, By Country 14.1. Historical Market Size Value (US$ Million) & Volume (Litres) Trend Analysis By Market Taxonomy, 2017 to 2022 14.2. Market Size Value (US$ Million) & Volume (Litres) Forecast By Market Taxonomy, 2023 to 2033 14.2.1. By Country 14.2.1.1. Russia 14.2.1.2. Poland 14.2.1.3. Rest of Eastern Europe 14.2.2. By Source 14.2.3. By Nature 14.2.4. By Format 14.2.5. By Packaging 14.2.6. By Sales Channel 14.3. Market Attractiveness Analysis 14.3.1. By Country 14.3.2. By Source 14.3.3. By Nature 14.3.4. By Format 14.3.5. By Packaging 14.3.6. By Sales Channel 14.4. Key Takeaways 15. APEJ Market Analysis 2017 to 2022 and Forecast 2023 to 2033, By Country 15.1. Historical Market Size Value (US$ Million) & Volume (Litres) Trend Analysis By Market Taxonomy, 2017 to 2022 15.2. Market Size Value (US$ Million) & Volume (Litres) Forecast By Market Taxonomy, 2023 to 2033 15.2.1. By Country 15.2.1.1. China 15.2.1.2. India 15.2.1.3. Australia and New Zealand 15.2.1.4. ASEAN 15.2.1.5. Rest of APEJ 15.2.2. By Source 15.2.3. By Nature 15.2.4. By Format 15.2.5. By Packaging 15.2.6. By Sales Channel 15.3. Market Attractiveness Analysis 15.3.1. By Country 15.3.2. By Source 15.3.3. By Nature 15.3.4. By Format 15.3.5. By Packaging 15.3.6. By Sales Channel 15.4. Key Takeaways 16. Japan Market Analysis 2017 to 2022 and Forecast 2023 to 2033, By Country 16.1. Historical Market Size Value (US$ Million) & Volume (Litres) Trend Analysis By Market Taxonomy, 2017 to 2022 16.2. Market Size Value (US$ Million) & Volume (Litres) Forecast By Market Taxonomy, 2023 to 2033 16.2.1. By Country 16.2.2. By Source 16.2.3. By Nature 16.2.4. By Format 16.2.5. By Packaging 16.2.6. By Sales Channel 16.3. Market Attractiveness Analysis 16.3.1. By Country 16.3.2. By Source 16.3.3. By Nature 16.3.4. By Format 16.3.5. By Packaging 16.3.6. By Sales Channel 16.4. Key Takeaways 17. MEA Market Analysis 2017 to 2022 and Forecast 2023 to 2033, By Country 17.1. Historical Market Size Value (US$ Million) & Volume (Litres) Trend Analysis By Market Taxonomy, 2017 to 2022 17.2. Market Size Value (US$ Million) & Volume (Litres) Forecast By Market Taxonomy, 2023 to 2033 17.2.1. By Country 17.2.1.1. GCC Countries 17.2.1.2. South Africa 17.2.1.3. Turkey 17.2.1.4. Rest of MEA 17.2.2. By Source 17.2.3. By Nature 17.2.4. By Format 17.2.5. By Packaging 17.2.6. By Sales Channel 17.3. Market Attractiveness Analysis 17.3.1. By Country 17.3.2. By Source 17.3.3. By Nature 17.3.4. By Format 17.3.5. By Packaging 17.3.6. By Sales Channel 17.4. Key Takeaways 18. Key Countries Market Analysis 18.1. United States of America 18.1.1. Pricing Analysis 18.1.2. Market Share Analysis, 2022 18.1.2.1. By Source 18.1.2.2. By Nature 18.1.2.3. By Format 18.1.2.4. By Packaging 18.1.2.5. By Sales Channel 18.2. Canada 18.2.1. Pricing Analysis 18.2.2. Market Share Analysis, 2022 18.2.2.1. By Source 18.2.2.2. By Nature 18.2.2.3. By Format 18.2.2.4. By Packaging 18.2.2.5. By Sales Channel 18.3. Brazil 18.3.1. Pricing Analysis 18.3.2. Market Share Analysis, 2022 18.3.2.1. By Source 18.3.2.2. By Nature 18.3.2.3. By Format 18.3.2.4. By Packaging 18.3.2.5. By Sales Channel 18.4. Mexico 18.4.1. Pricing Analysis 18.4.2. Market Share Analysis, 2022 18.4.2.1. By Source 18.4.2.2. By Nature 18.4.2.3. By Format 18.4.2.4. By Packaging 18.4.2.5. By Sales Channel 18.5. Germany 18.5.1. Pricing Analysis 18.5.2. Market Share Analysis, 2022 18.5.2.1. By Source 18.5.2.2. By Nature 18.5.2.3. By Format 18.5.2.4. By Packaging 18.5.2.5. By Sales Channel 18.6. United Kingdom 18.6.1. Pricing Analysis 18.6.2. Market Share Analysis, 2022 18.6.2.1. By Source 18.6.2.2. By Nature 18.6.2.3. By Format 18.6.2.4. By Packaging 18.6.2.5. By Sales Channel 18.7. France 18.7.1. Pricing Analysis 18.7.2. Market Share Analysis, 2022 18.7.2.1. By Source 18.7.2.2. By Nature 18.7.2.3. By Format 18.7.2.4. By Packaging 18.7.2.5. By Sales Channel 18.8. Italy 18.8.1. Pricing Analysis 18.8.2. Market Share Analysis, 2022 18.8.2.1. By Source 18.8.2.2. By Nature 18.8.2.3. By Format 18.8.2.4. By Packaging 18.8.2.5. By Sales Channel 18.9. Spain 18.9.1. Pricing Analysis 18.9.2. Market Share Analysis, 2022 18.9.2.1. By Source 18.9.2.2. By Nature 18.9.2.3. By Format 18.9.2.4. By Packaging 18.9.2.5. By Sales Channel 18.10. Benelux 18.10.1. Pricing Analysis 18.10.2. Market Share Analysis, 2022 18.10.2.1. By Source 18.10.2.2. By Nature 18.10.2.3. By Format 18.10.2.4. By Packaging 18.10.2.5. By Sales Channel 18.11. Nordic 18.11.1. Pricing Analysis 18.11.2. Market Share Analysis, 2022 18.11.2.1. By Source 18.11.2.2. By Nature 18.11.2.3. By Format 18.11.2.4. By Packaging 18.11.2.5. By Sales Channel 18.12. Russia 18.12.1. Pricing Analysis 18.12.2. Market Share Analysis, 2022 18.12.2.1. By Source 18.12.2.2. By Nature 18.12.2.3. By Format 18.12.2.4. By Packaging 18.12.2.5. By Sales Channel 18.13. Poland 18.13.1. Pricing Analysis 18.13.2. Market Share Analysis, 2022 18.13.2.1. By Source 18.13.2.2. By Nature 18.13.2.3. By Format 18.13.2.4. By Packaging 18.13.2.5. By Sales Channel 18.14. China 18.14.1. Pricing Analysis 18.14.2. Market Share Analysis, 2022 18.14.2.1. By Source 18.14.2.2. By Nature 18.14.2.3. By Format 18.14.2.4. By Packaging 18.14.2.5. By Sales Channel 18.15. India 18.15.1. Pricing Analysis 18.15.2. Market Share Analysis, 2022 18.15.2.1. By Source 18.15.2.2. By Nature 18.15.2.3. By Format 18.15.2.4. By Packaging 18.15.2.5. By Sales Channel 18.16. Australia and New Zealand 18.16.1. Pricing Analysis 18.16.2. Market Share Analysis, 2022 18.16.2.1. By Source 18.16.2.2. By Nature 18.16.2.3. By Format 18.16.2.4. By Packaging 18.16.2.5. By Sales Channel 18.17. ASIAN 18.17.1. Pricing Analysis 18.17.2. Market Share Analysis, 2022 18.17.2.1. By Source 18.17.2.2. By Nature 18.17.2.3. By Format 18.17.2.4. By Packaging 18.17.2.5. By Sales Channel 18.18. Japan 18.18.1. Pricing Analysis 18.18.2. Market Share Analysis, 2022 18.18.2.1. By Source 18.18.2.2. By Nature 18.18.2.3. By Format 18.18.2.4. By Packaging 18.18.2.5. By Sales Channel 18.19. GCC Countries 18.19.1. Pricing Analysis 18.19.2. Market Share Analysis, 2022 18.19.2.1. By Source 18.19.2.2. By Nature 18.19.2.3. By Format 18.19.2.4. By Packaging 18.19.2.5. By Sales Channel 18.20. South Africa 18.20.1. Pricing Analysis 18.20.2. Market Share Analysis, 2022 18.20.2.1. By Source 18.20.2.2. By Nature 18.20.2.3. By Format 18.20.2.4. By Packaging 18.20.2.5. By Sales Channel 18.21. Turkey 18.21.1. Pricing Analysis 18.21.2. Market Share Analysis, 2022 18.21.2.1. By Source 18.21.2.2. By Nature 18.21.2.3. By Format 18.21.2.4. By Packaging 18.21.2.5. By Sales Channel 19. Market Structure Analysis 19.1. Competition Dashboard 19.2. Competition Benchmarking 19.3. Market Share Analysis of Top Players 19.3.1. By Regional 19.3.2. By Source 19.3.3. By Nature 19.3.4. By Format 19.3.5. By Packaging 19.3.6. By Sales Channel 20. Competition Analysis 20.1. Competition Deep Dive 20.1.1. Value (US$ Million) & Volume (Litres)ed Technologies 20.1.1.1. Overview 20.1.1.2. Product Portfolio 20.1.1.3. Profitability by Market Segments 20.1.1.4. Sales Footprint 20.1.1.5. Strategy Overview 20.1.1.5.1. Marketing Strategy 20.1.1.5.2. Product Strategy 20.1.1.5.3. Channel Strategy 20.1.2. Daikin Industries 20.1.2.1. Overview 20.1.2.2. Product Portfolio 20.1.2.3. Profitability by Market Segments 20.1.2.4. Sales Footprint 20.1.2.5. Strategy Overview 20.1.2.5.1. Marketing Strategy 20.1.2.5.2. Product Strategy 20.1.2.5.3. Channel Strategy 20.1.3. Danone S.A 20.1.3.1. Overview 20.1.3.2. Product Portfolio 20.1.3.3. Profitability by Market Segments 20.1.3.4. Sales Footprint 20.1.3.5. Strategy Overview 20.1.3.5.1. Marketing Strategy 20.1.3.5.2. Product Strategy 20.1.3.5.3. Channel Strategy 20.1.4. Pacific Foods of Oregon, LLC 20.1.4.1. Overview 20.1.4.2. Product Portfolio 20.1.4.3. Profitability by Market Segments 20.1.4.4. Sales Footprint 20.1.4.5. Strategy Overview 20.1.4.5.1. Marketing Strategy 20.1.4.5.2. Product Strategy 20.1.4.5.3. Channel Strategy 20.1.5. China International Marine Containers 20.1.5.1. Overview 20.1.5.2. Product Portfolio 20.1.5.3. Profitability by Market Segments 20.1.5.4. Sales Footprint 20.1.5.5. Strategy Overview 20.1.5.5.1. Marketing Strategy 20.1.5.5.2. Product Strategy 20.1.5.5.3. Channel Strategy 20.1.6. Utility Trailer 20.1.6.1. Overview 20.1.6.2. Product Portfolio 20.1.6.3. Profitability by Market Segments 20.1.6.4. Sales Footprint 20.1.6.5. Strategy Overview 20.1.6.5.1. Marketing Strategy 20.1.6.5.2. Product Strategy 20.1.6.5.3. Channel Strategy 20.1.7. Singamas Container 20.1.7.1. Overview 20.1.7.2. Product Portfolio 20.1.7.3. Profitability by Market Segments 20.1.7.4. Sales Footprint 20.1.7.5. Strategy Overview 20.1.7.5.1. Marketing Strategy 20.1.7.5.2. Product Strategy 20.1.7.5.3. Channel Strategy 20.1.8. SunOpta 20.1.8.1. Overview 20.1.8.2. Product Portfolio 20.1.8.3. Profitability by Market Segments 20.1.8.4. Sales Footprint 20.1.8.5. Strategy Overview 20.1.8.5.1. Marketing Strategy 20.1.8.5.2. Product Strategy 20.1.8.5.3. Channel Strategy 20.1.9. The Hain Celestial Group, Inc. 20.1.9.1. Overview 20.1.9.2. Product Portfolio 20.1.9.3. Profitability by Market Segments 20.1.9.4. Sales Footprint 20.1.9.5. Strategy Overview 20.1.9.5.1. Marketing Strategy 20.1.9.5.2. Product Strategy 20.1.9.5.3. Channel Strategy 20.1.10. Freedom Foods Group Ltd. 20.1.10.1. Overview 20.1.10.2. Product Portfolio 20.1.10.3. Profitability by Market Segments 20.1.10.4. Sales Footprint 20.1.10.5. Strategy Overview 20.1.10.5.1. Marketing Strategy 20.1.10.5.2. Product Strategy 20.1.10.5.3. Channel Strategy 21. Assumptions & Acronyms Used 22. Research Methodology
Let us know your requirement to get
100% FREE customization
List of Tables
Table 1: Global Market Value (US$ Million) Forecast by Region, 2017 to 2033 Table 2: Global Market Volume (Litres) Forecast by Region, 2017 to 2033 Table 3: Global Market Value (US$ Million) Forecast by Source, 2017 to 2033 Table 4: Global Market Volume (Litres) Forecast by Source, 2017 to 2033 Table 5: Global Market Value (US$ Million) Forecast by Nature, 2017 to 2033 Table 6: Global Market Volume (Litres) Forecast by Nature, 2017 to 2033 Table 7: Global Market Value (US$ Million) Forecast by Format, 2017 to 2033 Table 8: Global Market Volume (Litres) Forecast by Format, 2017 to 2033 Table 9: Global Market Value (US$ Million) Forecast by Packaging, 2017 to 2033 Table 10: Global Market Volume (Litres) Forecast by Packaging, 2017 to 2033 Table 11: Global Market Value (US$ Million) Forecast by Sales Channel, 2017 to 2033 Table 12: Global Market Volume (Litres) Forecast by Sales Channel, 2017 to 2033 Table 13: North America Market Value (US$ Million) Forecast by Country, 2017 to 2033 Table 14: North America Market Volume (Litres) Forecast by Country, 2017 to 2033 Table 15: North America Market Value (US$ Million) Forecast by Source, 2017 to 2033 Table 16: North America Market Volume (Litres) Forecast by Source, 2017 to 2033 Table 17: North America Market Value (US$ Million) Forecast by Nature, 2017 to 2033 Table 18: North America Market Volume (Litres) Forecast by Nature, 2017 to 2033 Table 19: North America Market Value (US$ Million) Forecast by Format, 2017 to 2033 Table 20: North America Market Volume (Litres) Forecast by Format, 2017 to 2033 Table 21: North America Market Value (US$ Million) Forecast by Packaging, 2017 to 2033 Table 22: North America Market Volume (Litres) Forecast by Packaging, 2017 to 2033 Table 23: North America Market Value (US$ Million) Forecast by Sales Channel, 2017 to 2033 Table 24: North America Market Volume (Litres) Forecast by Sales Channel, 2017 to 2033 Table 25: Latin America Market Value (US$ Million) Forecast by Country, 2017 to 2033 Table 26: Latin America Market Volume (Litres) Forecast by Country, 2017 to 2033 Table 27: Latin America Market Value (US$ Million) Forecast by Source, 2017 to 2033 Table 28: Latin America Market Volume (Litres) Forecast by Source, 2017 to 2033 Table 29: Latin America Market Value (US$ Million) Forecast by Nature, 2017 to 2033 Table 30: Latin America Market Volume (Litres) Forecast by Nature, 2017 to 2033 Table 31: Latin America Market Value (US$ Million) Forecast by Format, 2017 to 2033 Table 32: Latin America Market Volume (Litres) Forecast by Format, 2017 to 2033 Table 33: Latin America Market Value (US$ Million) Forecast by Packaging, 2017 to 2033 Table 34: Latin America Market Volume (Litres) Forecast by Packaging, 2017 to 2033 Table 35: Latin America Market Value (US$ Million) Forecast by Sales Channel, 2017 to 2033 Table 36: Latin America Market Volume (Litres) Forecast by Sales Channel, 2017 to 2033 Table 37: Western Europe Market Value (US$ Million) Forecast by Country, 2017 to 2033 Table 38: Western Europe Market Volume (Litres) Forecast by Country, 2017 to 2033 Table 39: Western Europe Market Value (US$ Million) Forecast by Source, 2017 to 2033 Table 40: Western Europe Market Volume (Litres) Forecast by Source, 2017 to 2033 Table 41: Western Europe Market Value (US$ Million) Forecast by Nature, 2017 to 2033 Table 42: Western Europe Market Volume (Litres) Forecast by Nature, 2017 to 2033 Table 43: Western Europe Market Value (US$ Million) Forecast by Format, 2017 to 2033 Table 44: Western Europe Market Volume (Litres) Forecast by Format, 2017 to 2033 Table 45: Western Europe Market Value (US$ Million) Forecast by Packaging, 2017 to 2033 Table 46: Western Europe Market Volume (Litres) Forecast by Packaging, 2017 to 2033 Table 47: Western Europe Market Value (US$ Million) Forecast by Sales Channel, 2017 to 2033 Table 48: Western Europe Market Volume (Litres) Forecast by Sales Channel, 2017 to 2033 Table 49: Eastern Europe Market Value (US$ Million) Forecast by Country, 2017 to 2033 Table 50: Eastern Europe Market Volume (Litres) Forecast by Country, 2017 to 2033 Table 51: Eastern Europe Market Value (US$ Million) Forecast by Source, 2017 to 2033 Table 52: Eastern Europe Market Volume (Litres) Forecast by Source, 2017 to 2033 Table 53: Eastern Europe Market Value (US$ Million) Forecast by Nature, 2017 to 2033 Table 54: Eastern Europe Market Volume (Litres) Forecast by Nature, 2017 to 2033 Table 55: Eastern Europe Market Value (US$ Million) Forecast by Format, 2017 to 2033 Table 56: Eastern Europe Market Volume (Litres) Forecast by Format, 2017 to 2033 Table 57: Eastern Europe Market Value (US$ Million) Forecast by Packaging, 2017 to 2033 Table 58: Eastern Europe Market Volume (Litres) Forecast by Packaging, 2017 to 2033 Table 59: Eastern Europe Market Value (US$ Million) Forecast by Sales Channel, 2017 to 2033 Table 60: Eastern Europe Market Volume (Litres) Forecast by Sales Channel, 2017 to 2033 Table 61: APEJ Market Value (US$ Million) Forecast by Country, 2017 to 2033 Table 62: APEJ Market Volume (Litres) Forecast by Country, 2017 to 2033 Table 63: APEJ Market Value (US$ Million) Forecast by Source, 2017 to 2033 Table 64: APEJ Market Volume (Litres) Forecast by Source, 2017 to 2033 Table 65: APEJ Market Value (US$ Million) Forecast by Nature, 2017 to 2033 Table 66: APEJ Market Volume (Litres) Forecast by Nature, 2017 to 2033 Table 67: APEJ Market Value (US$ Million) Forecast by Format, 2017 to 2033 Table 68: APEJ Market Volume (Litres) Forecast by Format, 2017 to 2033 Table 69: APEJ Market Value (US$ Million) Forecast by Packaging, 2017 to 2033 Table 70: APEJ Market Volume (Litres) Forecast by Packaging, 2017 to 2033 Table 71: APEJ Market Value (US$ Million) Forecast by Sales Channel, 2017 to 2033 Table 72: APEJ Market Volume (Litres) Forecast by Sales Channel, 2017 to 2033 Table 73: Japan Market Value (US$ Million) Forecast by Country, 2017 to 2033 Table 74: Japan Market Volume (Litres) Forecast by Country, 2017 to 2033 Table 75: Japan Market Value (US$ Million) Forecast by Source, 2017 to 2033 Table 76: Japan Market Volume (Litres) Forecast by Source, 2017 to 2033 Table 77: Japan Market Value (US$ Million) Forecast by Nature, 2017 to 2033 Table 78: Japan Market Volume (Litres) Forecast by Nature, 2017 to 2033 Table 79: Japan Market Value (US$ Million) Forecast by Format, 2017 to 2033 Table 80: Japan Market Volume (Litres) Forecast by Format, 2017 to 2033 Table 81: Japan Market Value (US$ Million) Forecast by Packaging, 2017 to 2033 Table 82: Japan Market Volume (Litres) Forecast by Packaging, 2017 to 2033 Table 83: Japan Market Value (US$ Million) Forecast by Sales Channel, 2017 to 2033 Table 84: Japan Market Volume (Litres) Forecast by Sales Channel, 2017 to 2033 Table 85: MEA Market Value (US$ Million) Forecast by Country, 2017 to 2033 Table 86: MEA Market Volume (Litres) Forecast by Country, 2017 to 2033 Table 87: MEA Market Value (US$ Million) Forecast by Source, 2017 to 2033 Table 88: MEA Market Volume (Litres) Forecast by Source, 2017 to 2033 Table 89: MEA Market Value (US$ Million) Forecast by Nature, 2017 to 2033 Table 90: MEA Market Volume (Litres) Forecast by Nature, 2017 to 2033 Table 91: MEA Market Value (US$ Million) Forecast by Format, 2017 to 2033 Table 92: MEA Market Volume (Litres) Forecast by Format, 2017 to 2033 Table 93: MEA Market Value (US$ Million) Forecast by Packaging, 2017 to 2033 Table 94: MEA Market Volume (Litres) Forecast by Packaging, 2017 to 2033 Table 95: MEA Market Value (US$ Million) Forecast by Sales Channel, 2017 to 2033 Table 96: MEA Market Volume (Litres) Forecast by Sales Channel, 2017 to 2033
Find your sweet spots for generating winning opportunities in this market.
Talk to AnalystList of Charts
Figure 1: Global Market Value (US$ Million) by Source, 2023 to 2033 Figure 2: Global Market Value (US$ Million) by Nature, 2023 to 2033 Figure 3: Global Market Value (US$ Million) by Format, 2023 to 2033 Figure 4: Global Market Value (US$ Million) by Packaging, 2023 to 2033 Figure 5: Global Market Value (US$ Million) by Sales Channel, 2023 to 2033 Figure 6: Global Market Value (US$ Million) by Region, 2023 to 2033 Figure 7: Global Market Value (US$ Million) Analysis by Region, 2017 to 2033 Figure 8: Global Market Volume (Litres) Analysis by Region, 2017 to 2033 Figure 9: Global Market Value Share (%) and BPS Analysis by Region, 2023 to 2033 Figure 10: Global Market Y-o-Y Growth (%) Projections by Region, 2023 to 2033 Figure 11: Global Market Value (US$ Million) Analysis by Source, 2017 to 2033 Figure 12: Global Market Volume (Litres) Analysis by Source, 2017 to 2033 Figure 13: Global Market Value Share (%) and BPS Analysis by Source, 2023 to 2033 Figure 14: Global Market Y-o-Y Growth (%) Projections by Source, 2023 to 2033 Figure 15: Global Market Value (US$ Million) Analysis by Nature, 2017 to 2033 Figure 16: Global Market Volume (Litres) Analysis by Nature, 2017 to 2033 Figure 17: Global Market Value Share (%) and BPS Analysis by Nature, 2023 to 2033 Figure 18: Global Market Y-o-Y Growth (%) Projections by Nature, 2023 to 2033 Figure 19: Global Market Value (US$ Million) Analysis by Format, 2017 to 2033 Figure 20: Global Market Volume (Litres) Analysis by Format, 2017 to 2033 Figure 21: Global Market Value Share (%) and BPS Analysis by Format, 2023 to 2033 Figure 22: Global Market Y-o-Y Growth (%) Projections by Format, 2023 to 2033 Figure 23: Global Market Value (US$ Million) Analysis by Packaging, 2017 to 2033 Figure 24: Global Market Volume (Litres) Analysis by Packaging, 2017 to 2033 Figure 25: Global Market Value Share (%) and BPS Analysis by Packaging, 2023 to 2033 Figure 26: Global Market Y-o-Y Growth (%) Projections by Packaging, 2023 to 2033 Figure 27: Global Market Value (US$ Million) Analysis by Sales Channel, 2017 to 2033 Figure 28: Global Market Volume (Litres) Analysis by Sales Channel, 2017 to 2033 Figure 29: Global Market Value Share (%) and BPS Analysis by Sales Channel, 2023 to 2033 Figure 30: Global Market Y-o-Y Growth (%) Projections by Sales Channel, 2023 to 2033 Figure 31: Global Market Attractiveness by Source, 2023 to 2033 Figure 32: Global Market Attractiveness by Nature, 2023 to 2033 Figure 33: Global Market Attractiveness by Format, 2023 to 2033 Figure 34: Global Market Attractiveness by Packaging, 2023 to 2033 Figure 35: Global Market Attractiveness by Sales Channel, 2023 to 2033 Figure 36: Global Market Attractiveness by Region, 2023 to 2033 Figure 37: North America Market Value (US$ Million) by Source, 2023 to 2033 Figure 38: North America Market Value (US$ Million) by Nature, 2023 to 2033 Figure 39: North America Market Value (US$ Million) by Format, 2023 to 2033 Figure 40: North America Market Value (US$ Million) by Packaging, 2023 to 2033 Figure 41: North America Market Value (US$ Million) by Sales Channel, 2023 to 2033 Figure 42: North America Market Value (US$ Million) by Country, 2023 to 2033 Figure 43: North America Market Value (US$ Million) Analysis by Country, 2017 to 2033 Figure 44: North America Market Volume (Litres) Analysis by Country, 2017 to 2033 Figure 45: North America Market Value Share (%) and BPS Analysis by Country, 2023 to 2033 Figure 46: North America Market Y-o-Y Growth (%) Projections by Country, 2023 to 2033 Figure 47: North America Market Value (US$ Million) Analysis by Source, 2017 to 2033 Figure 48: North America Market Volume (Litres) Analysis by Source, 2017 to 2033 Figure 49: North America Market Value Share (%) and BPS Analysis by Source, 2023 to 2033 Figure 50: North America Market Y-o-Y Growth (%) Projections by Source, 2023 to 2033 Figure 51: North America Market Value (US$ Million) Analysis by Nature, 2017 to 2033 Figure 52: North America Market Volume (Litres) Analysis by Nature, 2017 to 2033 Figure 53: North America Market Value Share (%) and BPS Analysis by Nature, 2023 to 2033 Figure 54: North America Market Y-o-Y Growth (%) Projections by Nature, 2023 to 2033 Figure 55: North America Market Value (US$ Million) Analysis by Format, 2017 to 2033 Figure 56: North America Market Volume (Litres) Analysis by Format, 2017 to 2033 Figure 57: North America Market Value Share (%) and BPS Analysis by Format, 2023 to 2033 Figure 58: North America Market Y-o-Y Growth (%) Projections by Format, 2023 to 2033 Figure 59: North America Market Value (US$ Million) Analysis by Packaging, 2017 to 2033 Figure 60: North America Market Volume (Litres) Analysis by Packaging, 2017 to 2033 Figure 61: North America Market Value Share (%) and BPS Analysis by Packaging, 2023 to 2033 Figure 62: North America Market Y-o-Y Growth (%) Projections by Packaging, 2023 to 2033 Figure 63: North America Market Value (US$ Million) Analysis by Sales Channel, 2017 to 2033 Figure 64: North America Market Volume (Litres) Analysis by Sales Channel, 2017 to 2033 Figure 65: North America Market Value Share (%) and BPS Analysis by Sales Channel, 2023 to 2033 Figure 66: North America Market Y-o-Y Growth (%) Projections by Sales Channel, 2023 to 2033 Figure 67: North America Market Attractiveness by Source, 2023 to 2033 Figure 68: North America Market Attractiveness by Nature, 2023 to 2033 Figure 69: North America Market Attractiveness by Format, 2023 to 2033 Figure 70: North America Market Attractiveness by Packaging, 2023 to 2033 Figure 71: North America Market Attractiveness by Sales Channel, 2023 to 2033 Figure 72: North America Market Attractiveness by Country, 2023 to 2033 Figure 73: Latin America Market Value (US$ Million) by Source, 2023 to 2033 Figure 74: Latin America Market Value (US$ Million) by Nature, 2023 to 2033 Figure 75: Latin America Market Value (US$ Million) by Format, 2023 to 2033 Figure 76: Latin America Market Value (US$ Million) by Packaging, 2023 to 2033 Figure 77: Latin America Market Value (US$ Million) by Sales Channel, 2023 to 2033 Figure 78: Latin America Market Value (US$ Million) by Country, 2023 to 2033 Figure 79: Latin America Market Value (US$ Million) Analysis by Country, 2017 to 2033 Figure 80: Latin America Market Volume (Litres) Analysis by Country, 2017 to 2033 Figure 81: Latin America Market Value Share (%) and BPS Analysis by Country, 2023 to 2033 Figure 82: Latin America Market Y-o-Y Growth (%) Projections by Country, 2023 to 2033 Figure 83: Latin America Market Value (US$ Million) Analysis by Source, 2017 to 2033 Figure 84: Latin America Market Volume (Litres) Analysis by Source, 2017 to 2033 Figure 85: Latin America Market Value Share (%) and BPS Analysis by Source, 2023 to 2033 Figure 86: Latin America Market Y-o-Y Growth (%) Projections by Source, 2023 to 2033 Figure 87: Latin America Market Value (US$ Million) Analysis by Nature, 2017 to 2033 Figure 88: Latin America Market Volume (Litres) Analysis by Nature, 2017 to 2033 Figure 89: Latin America Market Value Share (%) and BPS Analysis by Nature, 2023 to 2033 Figure 90: Latin America Market Y-o-Y Growth (%) Projections by Nature, 2023 to 2033 Figure 91: Latin America Market Value (US$ Million) Analysis by Format, 2017 to 2033 Figure 92: Latin America Market Volume (Litres) Analysis by Format, 2017 to 2033 Figure 93: Latin America Market Value Share (%) and BPS Analysis by Format, 2023 to 2033 Figure 94: Latin America Market Y-o-Y Growth (%) Projections by Format, 2023 to 2033 Figure 95: Latin America Market Value (US$ Million) Analysis by Packaging, 2017 to 2033 Figure 96: Latin America Market Volume (Litres) Analysis by Packaging, 2017 to 2033 Figure 97: Latin America Market Value Share (%) and BPS Analysis by Packaging, 2023 to 2033 Figure 98: Latin America Market Y-o-Y Growth (%) Projections by Packaging, 2023 to 2033 Figure 99: Latin America Market Value (US$ Million) Analysis by Sales Channel, 2017 to 2033 Figure 100: Latin America Market Volume (Litres) Analysis by Sales Channel, 2017 to 2033 Figure 101: Latin America Market Value Share (%) and BPS Analysis by Sales Channel, 2023 to 2033 Figure 102: Latin America Market Y-o-Y Growth (%) Projections by Sales Channel, 2023 to 2033 Figure 103: Latin America Market Attractiveness by Source, 2023 to 2033 Figure 104: Latin America Market Attractiveness by Nature, 2023 to 2033 Figure 105: Latin America Market Attractiveness by Format, 2023 to 2033 Figure 106: Latin America Market Attractiveness by Packaging, 2023 to 2033 Figure 107: Latin America Market Attractiveness by Sales Channel, 2023 to 2033 Figure 108: Latin America Market Attractiveness by Country, 2023 to 2033 Figure 109: Western Europe Market Value (US$ Million) by Source, 2023 to 2033 Figure 110: Western Europe Market Value (US$ Million) by Nature, 2023 to 2033 Figure 111: Western Europe Market Value (US$ Million) by Format, 2023 to 2033 Figure 112: Western Europe Market Value (US$ Million) by Packaging, 2023 to 2033 Figure 113: Western Europe Market Value (US$ Million) by Sales Channel, 2023 to 2033 Figure 114: Western Europe Market Value (US$ Million) by Country, 2023 to 2033 Figure 115: Western Europe Market Value (US$ Million) Analysis by Country, 2017 to 2033 Figure 116: Western Europe Market Volume (Litres) Analysis by Country, 2017 to 2033 Figure 117: Western Europe Market Value Share (%) and BPS Analysis by Country, 2023 to 2033 Figure 118: Western Europe Market Y-o-Y Growth (%) Projections by Country, 2023 to 2033 Figure 119: Western Europe Market Value (US$ Million) Analysis by Source, 2017 to 2033 Figure 120: Western Europe Market Volume (Litres) Analysis by Source, 2017 to 2033 Figure 121: Western Europe Market Value Share (%) and BPS Analysis by Source, 2023 to 2033 Figure 122: Western Europe Market Y-o-Y Growth (%) Projections by Source, 2023 to 2033 Figure 123: Western Europe Market Value (US$ Million) Analysis by Nature, 2017 to 2033 Figure 124: Western Europe Market Volume (Litres) Analysis by Nature, 2017 to 2033 Figure 125: Western Europe Market Value Share (%) and BPS Analysis by Nature, 2023 to 2033 Figure 126: Western Europe Market Y-o-Y Growth (%) Projections by Nature, 2023 to 2033 Figure 127: Western Europe Market Value (US$ Million) Analysis by Format, 2017 to 2033 Figure 128: Western Europe Market Volume (Litres) Analysis by Format, 2017 to 2033 Figure 129: Western Europe Market Value Share (%) and BPS Analysis by Format, 2023 to 2033 Figure 130: Western Europe Market Y-o-Y Growth (%) Projections by Format, 2023 to 2033 Figure 131: Western Europe Market Value (US$ Million) Analysis by Packaging, 2017 to 2033 Figure 132: Western Europe Market Volume (Litres) Analysis by Packaging, 2017 to 2033 Figure 133: Western Europe Market Value Share (%) and BPS Analysis by Packaging, 2023 to 2033 Figure 134: Western Europe Market Y-o-Y Growth (%) Projections by Packaging, 2023 to 2033 Figure 135: Western Europe Market Value (US$ Million) Analysis by Sales Channel, 2017 to 2033 Figure 136: Western Europe Market Volume (Litres) Analysis by Sales Channel, 2017 to 2033 Figure 137: Western Europe Market Value Share (%) and BPS Analysis by Sales Channel, 2023 to 2033 Figure 138: Western Europe Market Y-o-Y Growth (%) Projections by Sales Channel, 2023 to 2033 Figure 139: Western Europe Market Attractiveness by Source, 2023 to 2033 Figure 140: Western Europe Market Attractiveness by Nature, 2023 to 2033 Figure 141: Western Europe Market Attractiveness by Format, 2023 to 2033 Figure 142: Western Europe Market Attractiveness by Packaging, 2023 to 2033 Figure 143: Western Europe Market Attractiveness by Sales Channel, 2023 to 2033 Figure 144: Western Europe Market Attractiveness by Country, 2023 to 2033 Figure 145: Eastern Europe Market Value (US$ Million) by Source, 2023 to 2033 Figure 146: Eastern Europe Market Value (US$ Million) by Nature, 2023 to 2033 Figure 147: Eastern Europe Market Value (US$ Million) by Format, 2023 to 2033 Figure 148: Eastern Europe Market Value (US$ Million) by Packaging, 2023 to 2033 Figure 149: Eastern Europe Market Value (US$ Million) by Sales Channel, 2023 to 2033 Figure 150: Eastern Europe Market Value (US$ Million) by Country, 2023 to 2033 Figure 151: Eastern Europe Market Value (US$ Million) Analysis by Country, 2017 to 2033 Figure 152: Eastern Europe Market Volume (Litres) Analysis by Country, 2017 to 2033 Figure 153: Eastern Europe Market Value Share (%) and BPS Analysis by Country, 2023 to 2033 Figure 154: Eastern Europe Market Y-o-Y Growth (%) Projections by Country, 2023 to 2033 Figure 155: Eastern Europe Market Value (US$ Million) Analysis by Source, 2017 to 2033 Figure 156: Eastern Europe Market Volume (Litres) Analysis by Source, 2017 to 2033 Figure 157: Eastern Europe Market Value Share (%) and BPS Analysis by Source, 2023 to 2033 Figure 158: Eastern Europe Market Y-o-Y Growth (%) Projections by Source, 2023 to 2033 Figure 159: Eastern Europe Market Value (US$ Million) Analysis by Nature, 2017 to 2033 Figure 160: Eastern Europe Market Volume (Litres) Analysis by Nature, 2017 to 2033 Figure 161: Eastern Europe Market Value Share (%) and BPS Analysis by Nature, 2023 to 2033 Figure 162: Eastern Europe Market Y-o-Y Growth (%) Projections by Nature, 2023 to 2033 Figure 163: Eastern Europe Market Value (US$ Million) Analysis by Format, 2017 to 2033 Figure 164: Eastern Europe Market Volume (Litres) Analysis by Format, 2017 to 2033 Figure 165: Eastern Europe Market Value Share (%) and BPS Analysis by Format, 2023 to 2033 Figure 166: Eastern Europe Market Y-o-Y Growth (%) Projections by Format, 2023 to 2033 Figure 167: Eastern Europe Market Value (US$ Million) Analysis by Packaging, 2017 to 2033 Figure 168: Eastern Europe Market Volume (Litres) Analysis by Packaging, 2017 to 2033 Figure 169: Eastern Europe Market Value Share (%) and BPS Analysis by Packaging, 2023 to 2033 Figure 170: Eastern Europe Market Y-o-Y Growth (%) Projections by Packaging, 2023 to 2033 Figure 171: Eastern Europe Market Value (US$ Million) Analysis by Sales Channel, 2017 to 2033 Figure 172: Eastern Europe Market Volume (Litres) Analysis by Sales Channel, 2017 to 2033 Figure 173: Eastern Europe Market Value Share (%) and BPS Analysis by Sales Channel, 2023 to 2033 Figure 174: Eastern Europe Market Y-o-Y Growth (%) Projections by Sales Channel, 2023 to 2033 Figure 175: Eastern Europe Market Attractiveness by Source, 2023 to 2033 Figure 176: Eastern Europe Market Attractiveness by Nature, 2023 to 2033 Figure 177: Eastern Europe Market Attractiveness by Format, 2023 to 2033 Figure 178: Eastern Europe Market Attractiveness by Packaging, 2023 to 2033 Figure 179: Eastern Europe Market Attractiveness by Sales Channel, 2023 to 2033 Figure 180: Eastern Europe Market Attractiveness by Country, 2023 to 2033 Figure 181: APEJ Market Value (US$ Million) by Source, 2023 to 2033 Figure 182: APEJ Market Value (US$ Million) by Nature, 2023 to 2033 Figure 183: APEJ Market Value (US$ Million) by Format, 2023 to 2033 Figure 184: APEJ Market Value (US$ Million) by Packaging, 2023 to 2033 Figure 185: APEJ Market Value (US$ Million) by Sales Channel, 2023 to 2033 Figure 186: APEJ Market Value (US$ Million) by Country, 2023 to 2033 Figure 187: APEJ Market Value (US$ Million) Analysis by Country, 2017 to 2033 Figure 188: APEJ Market Volume (Litres) Analysis by Country, 2017 to 2033 Figure 189: APEJ Market Value Share (%) and BPS Analysis by Country, 2023 to 2033 Figure 190: APEJ Market Y-o-Y Growth (%) Projections by Country, 2023 to 2033 Figure 191: APEJ Market Value (US$ Million) Analysis by Source, 2017 to 2033 Figure 192: APEJ Market Volume (Litres) Analysis by Source, 2017 to 2033 Figure 193: APEJ Market Value Share (%) and BPS Analysis by Source, 2023 to 2033 Figure 194: APEJ Market Y-o-Y Growth (%) Projections by Source, 2023 to 2033 Figure 195: APEJ Market Value (US$ Million) Analysis by Nature, 2017 to 2033 Figure 196: APEJ Market Volume (Litres) Analysis by Nature, 2017 to 2033 Figure 197: APEJ Market Value Share (%) and BPS Analysis by Nature, 2023 to 2033 Figure 198: APEJ Market Y-o-Y Growth (%) Projections by Nature, 2023 to 2033 Figure 199: APEJ Market Value (US$ Million) Analysis by Format, 2017 to 2033 Figure 200: APEJ Market Volume (Litres) Analysis by Format, 2017 to 2033 Figure 201: APEJ Market Value Share (%) and BPS Analysis by Format, 2023 to 2033 Figure 202: APEJ Market Y-o-Y Growth (%) Projections by Format, 2023 to 2033 Figure 203: APEJ Market Value (US$ Million) Analysis by Packaging, 2017 to 2033 Figure 204: APEJ Market Volume (Litres) Analysis by Packaging, 2017 to 2033 Figure 205: APEJ Market Value Share (%) and BPS Analysis by Packaging, 2023 to 2033 Figure 206: APEJ Market Y-o-Y Growth (%) Projections by Packaging, 2023 to 2033 Figure 207: APEJ Market Value (US$ Million) Analysis by Sales Channel, 2017 to 2033 Figure 208: APEJ Market Volume (Litres) Analysis by Sales Channel, 2017 to 2033 Figure 209: APEJ Market Value Share (%) and BPS Analysis by Sales Channel, 2023 to 2033 Figure 210: APEJ Market Y-o-Y Growth (%) Projections by Sales Channel, 2023 to 2033 Figure 211: APEJ Market Attractiveness by Source, 2023 to 2033 Figure 212: APEJ Market Attractiveness by Nature, 2023 to 2033 Figure 213: APEJ Market Attractiveness by Format, 2023 to 2033 Figure 214: APEJ Market Attractiveness by Packaging, 2023 to 2033 Figure 215: APEJ Market Attractiveness by Sales Channel, 2023 to 2033 Figure 216: APEJ Market Attractiveness by Country, 2023 to 2033 Figure 217: Japan Market Value (US$ Million) by Source, 2023 to 2033 Figure 218: Japan Market Value (US$ Million) by Nature, 2023 to 2033 Figure 219: Japan Market Value (US$ Million) by Format, 2023 to 2033 Figure 220: Japan Market Value (US$ Million) by Packaging, 2023 to 2033 Figure 221: Japan Market Value (US$ Million) by Sales Channel, 2023 to 2033 Figure 222: Japan Market Value (US$ Million) by Country, 2023 to 2033 Figure 223: Japan Market Value (US$ Million) Analysis by Country, 2017 to 2033 Figure 224: Japan Market Volume (Litres) Analysis by Country, 2017 to 2033 Figure 225: Japan Market Value Share (%) and BPS Analysis by Country, 2023 to 2033 Figure 226: Japan Market Y-o-Y Growth (%) Projections by Country, 2023 to 2033 Figure 227: Japan Market Value (US$ Million) Analysis by Source, 2017 to 2033 Figure 228: Japan Market Volume (Litres) Analysis by Source, 2017 to 2033 Figure 229: Japan Market Value Share (%) and BPS Analysis by Source, 2023 to 2033 Figure 230: Japan Market Y-o-Y Growth (%) Projections by Source, 2023 to 2033 Figure 231: Japan Market Value (US$ Million) Analysis by Nature, 2017 to 2033 Figure 232: Japan Market Volume (Litres) Analysis by Nature, 2017 to 2033 Figure 233: Japan Market Value Share (%) and BPS Analysis by Nature, 2023 to 2033 Figure 234: Japan Market Y-o-Y Growth (%) Projections by Nature, 2023 to 2033 Figure 235: Japan Market Value (US$ Million) Analysis by Format, 2017 to 2033 Figure 236: Japan Market Volume (Litres) Analysis by Format, 2017 to 2033 Figure 237: Japan Market Value Share (%) and BPS Analysis by Format, 2023 to 2033 Figure 238: Japan Market Y-o-Y Growth (%) Projections by Format, 2023 to 2033 Figure 239: Japan Market Value (US$ Million) Analysis by Packaging, 2017 to 2033 Figure 240: Japan Market Volume (Litres) Analysis by Packaging, 2017 to 2033 Figure 241: Japan Market Value Share (%) and BPS Analysis by Packaging, 2023 to 2033 Figure 242: Japan Market Y-o-Y Growth (%) Projections by Packaging, 2023 to 2033 Figure 243: Japan Market Value (US$ Million) Analysis by Sales Channel, 2017 to 2033 Figure 244: Japan Market Volume (Litres) Analysis by Sales Channel, 2017 to 2033 Figure 245: Japan Market Value Share (%) and BPS Analysis by Sales Channel, 2023 to 2033 Figure 246: Japan Market Y-o-Y Growth (%) Projections by Sales Channel, 2023 to 2033 Figure 247: Japan Market Attractiveness by Source, 2023 to 2033 Figure 248: Japan Market Attractiveness by Nature, 2023 to 2033 Figure 249: Japan Market Attractiveness by Format, 2023 to 2033 Figure 250: Japan Market Attractiveness by Packaging, 2023 to 2033 Figure 251: Japan Market Attractiveness by Sales Channel, 2023 to 2033 Figure 252: Japan Market Attractiveness by Country, 2023 to 2033 Figure 253: MEA Market Value (US$ Million) by Source, 2023 to 2033 Figure 254: MEA Market Value (US$ Million) by Nature, 2023 to 2033 Figure 255: MEA Market Value (US$ Million) by Format, 2023 to 2033 Figure 256: MEA Market Value (US$ Million) by Packaging, 2023 to 2033 Figure 257: MEA Market Value (US$ Million) by Sales Channel, 2023 to 2033 Figure 258: MEA Market Value (US$ Million) by Country, 2023 to 2033 Figure 259: MEA Market Value (US$ Million) Analysis by Country, 2017 to 2033 Figure 260: MEA Market Volume (Litres) Analysis by Country, 2017 to 2033 Figure 261: MEA Market Value Share (%) and BPS Analysis by Country, 2023 to 2033 Figure 262: MEA Market Y-o-Y Growth (%) Projections by Country, 2023 to 2033 Figure 263: MEA Market Value (US$ Million) Analysis by Source, 2017 to 2033 Figure 264: MEA Market Volume (Litres) Analysis by Source, 2017 to 2033 Figure 265: MEA Market Value Share (%) and BPS Analysis by Source, 2023 to 2033 Figure 266: MEA Market Y-o-Y Growth (%) Projections by Source, 2023 to 2033 Figure 267: MEA Market Value (US$ Million) Analysis by Nature, 2017 to 2033 Figure 268: MEA Market Volume (Litres) Analysis by Nature, 2017 to 2033 Figure 269: MEA Market Value Share (%) and BPS Analysis by Nature, 2023 to 2033 Figure 270: MEA Market Y-o-Y Growth (%) Projections by Nature, 2023 to 2033 Figure 271: MEA Market Value (US$ Million) Analysis by Format, 2017 to 2033 Figure 272: MEA Market Volume (Litres) Analysis by Format, 2017 to 2033 Figure 273: MEA Market Value Share (%) and BPS Analysis by Format, 2023 to 2033 Figure 274: MEA Market Y-o-Y Growth (%) Projections by Format, 2023 to 2033 Figure 275: MEA Market Value (US$ Million) Analysis by Packaging, 2017 to 2033 Figure 276: MEA Market Volume (Litres) Analysis by Packaging, 2017 to 2033 Figure 277: MEA Market Value Share (%) and BPS Analysis by Packaging, 2023 to 2033 Figure 278: MEA Market Y-o-Y Growth (%) Projections by Packaging, 2023 to 2033 Figure 279: MEA Market Value (US$ Million) Analysis by Sales Channel, 2017 to 2033 Figure 280: MEA Market Volume (Litres) Analysis by Sales Channel, 2017 to 2033 Figure 281: MEA Market Value Share (%) and BPS Analysis by Sales Channel, 2023 to 2033 Figure 282: MEA Market Y-o-Y Growth (%) Projections by Sales Channel, 2023 to 2033 Figure 283: MEA Market Attractiveness by Source, 2023 to 2033 Figure 284: MEA Market Attractiveness by Nature, 2023 to 2033 Figure 285: MEA Market Attractiveness by Format, 2023 to 2033 Figure 286: MEA Market Attractiveness by Packaging, 2023 to 2033 Figure 287: MEA Market Attractiveness by Sales Channel, 2023 to 2033 Figure 288: MEA Market Attractiveness by Country, 2023 to 2033
Need specific information?
Request CustomizationExplore Food and Beverage Insights
View Reports