Plant Based Thickener Market
Explore with FMI’s Study How Growing Fad of Veganism is Creating New Growth Avenues for Plant Based Thickener Manufacturers!
Plant Based Thickener Market segmented by Types, Applications, Distribution Channels & Regions - Forecast for 2022–32
Plant Based Thickener Market Outlook 2022-2032
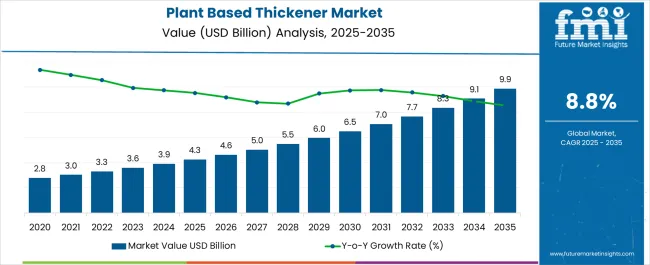
[350 Pages Report] The global plant based thickener market is expected to reach market valuation of US$ 3.3 Bn by the year 2021, accelerating with a CAGR of 8.8% by 2022-2032. The global Plant Based Thickener market size is expected to reach US$ 7.6 Bn in 2032.
With demand for convenience foods and a heightened awareness of healthy eating, health-conscious lifestyle choices, and the myriad advantages associated with using food thickeners, the industry for food thickeners is expected to grow. The significant growth of the global food and beverage market and the availability of a large customer base are predicted to increase customer awareness over the projected period. Similarly, rising disposable income, as well as changes in consumer behavior due to rapid urbanization, are predicted to have a positive impact on the industry.
Starch, hydrocolloids, and proteins are food thickeners employed in baking as a thickening, stabilizing, and gelling agents. Moreover, increasing prices for kid-friendly nutrition products, protein-rich products, and ready-to-eat snacks will drive product expansion in the forthcoming years.
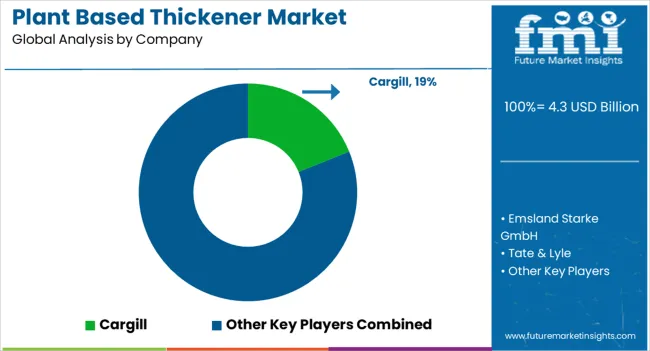
Rising demand for non-alcoholic beverages such as fruit juices and energy drinks is anticipated to accelerate market growth throughout the forecast period. The market is fiercely competitive, with major industry players such as Cargill Inc. and CP Kelco generating large volumes. These major players stay competitive by offering formulation blends and customization services to a wider range of customers.
Attributes |
Key Insights |
Plant Based Thickener Market Size (2022E) |
US$ 3.3 Bn |
Market Projected Size (2032F) |
US$ 7.6 Bn |
Value CAGR (2022-2032) |
8.8% |
Top 3 Countries Market Share |
33.2% |
Let us know your requirement to get
100% FREE customization
How Does Plant Based Thickener Market Historic and Future Outlook Compare?
Plant-based thickener is a food additive that increases viscosity without changing the taste or other qualities of the food. Plant-based thickeners are commonly used to thicken culinary products, including soups, puddings, and other sauces, without altering their flavor. Nonfood-grade thickeners are used in paints, inks, cosmetics, and edible thickeners.
Polysaccharides and proteins are the most often utilized food thickeners. Starches, vegetable gums, and pectin make up the Polysaccharides. Recently, there has been an increase in the demand for vegan foods, necessitating the use of plant-based substances as thickeners.
Plant Based Thickener sales grew at a CAGR of 7.2% between 2017 and 2021. The period marked the entry of various market players and product innovations.
Different forms of plant-based thickeners are called functional additives since they enhance the texture and look of foods while also increasing the nutritional content of the food by substituting high-fat components in a range of dishes. Different forms of functional starches and gums are used in plant-based thickeners, which are used in soups, sauces, salad dressings, and gravies.
How Will Change in Eating Patterns Affect Plant Based Thickener Market?
Rising trend of using functional food ingredients that positively impact human health, increased demand for vegan ingredients due to people's growing preference for vegan food, increased demand for an improved and smooth mouth feel in food products and rising preference for natural food ingredients.
Plant-based thickeners are also utilized for a range of culinary purposes. For example, agar is used as vegetarian gelatin since it can be used to replace gelatin in various food items and has stronger setting characteristics than gelatin.
Find your sweet spots for generating winning opportunities in this market.
Talk to AnalystCountry-wise Insights
How is the U.S. Plant Based Thickener Market Shaping?
Rising Sales of Plant-Based Food Products to Spur the Demand in the Market
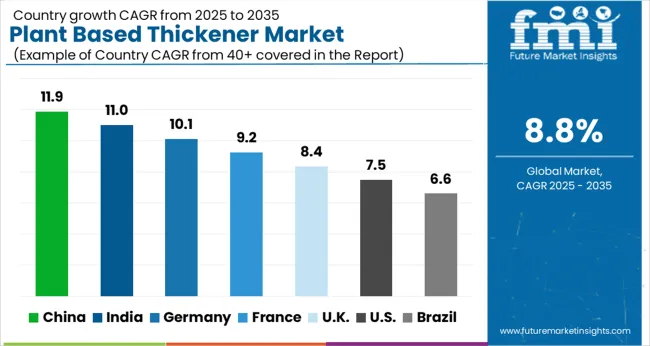
The U.S. is one of the largest markets for plant based thickener sales. North America is expected to hold lion’s share of 35%. In the next years, plant-based thickeners are predicted to increase at an exponential rate in the North America area.
Growth in the U.S. is underpinned by rising consumption of plant-based products. Further, growing demand for vegan food products is expected to boost the production of plant-based thickener. On the back of this, key players are eyeing the U.S. market to capitalize on rising veganism trend.
Why is Europe Considered to be the Leading Plant Based Thickener Producer?
Europe Plant Based Thickener Market to Gain from Growing Consumption of Plant based Thickener
Due to the growing vegan population in Europe, the market for plant-based thickeners is poised to expand at a steady pace over the forecast period. One of the primary supply-side drivers driving market expansion is meeting the increased demand for goods that do not include animal extracts.
Plant based products are the alternative choice for meat consumers for their dose of protein. People in Europe are adopting vegan diet, boosting the market. Plant based products have major advantages over its counterpart, synthetic or animal based-products, which is driving the demand in the market.
Category-wise Insights
Will Bakery Remain the Leading Application in Plant based Thickener Market?
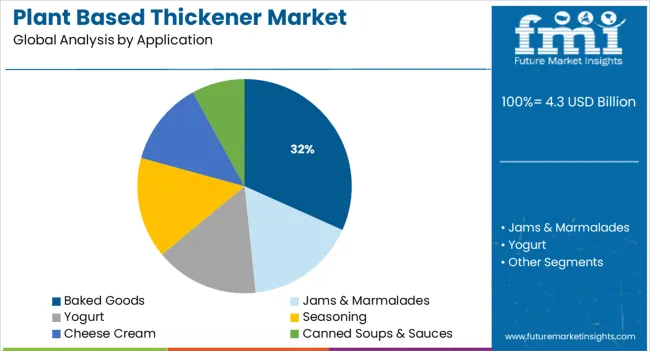
A significant increase in urban consumption has resulted in increased demand for processed foods. As a result, allied substances such as plant-based food thickening agents have become more popular. Because there are no close equivalents for food thickening agents, per ton increases in bread and confectionery production, sausages, dressings, and soups are directly increasing demand for food thickening agents. Processed food makers, on the other hand, are concentrating on making their goods more useful.
A unified Market Research Subscription Platform, built for today's disparate research needs.
Competitive Landscape
Introducing new product variations, acquiring smaller market competitors, and raising awareness about the advantages of plant-based thickeners through different promotional activities and programs are some of the main drivers driving market expansion in the near future.
Plant-based thickener manufacturing might benefit from the right sort of plantation, as well as the necessary technology and know-how to extract gum and starch from plants in various parts of the world.
Plant Based Thickeners: The Perfect Alternative to Animal Based Thickeners by Emsland Group, Cargill, and Ingredion Incorporated
Plant-based thickener is a food additive that increases viscosity without affecting flavor or other qualities. Plant-based thickeners typically thicken culinary products such as soups, puddings, and other sauces without altering their taste. Aside from edible thickeners, nonfood grade thickeners are utilized in paints, inks, and cosmetics.
Plant-based thickeners comprise various functional starches and gums utilized in soups, sauces, salad dressings, gravies, and other applications.
The Emsland Group is a multinational corporation that creates novel solutions for food processing using raw vegetable ingredients.
Emsland Group products are used in a wide range of food-related applications. The company also provide a diverse selection of dried potato goods in the retail food industry under the Mecklenburger Küche brand. The Emsland Group provides clients with bespoke product solutions in adhesives, flocking agents, construction additives, textile applications, and filter materials. The company uses high-quality products are utilized in high-quality home and farm animal feed.
In May 2020, JUST, a firm that uses cutting-edge science and technology to develop healthier, more sustainable meals, announced a collaboration with Emsland Group, a global leader in generating raw materials from vegetables, to expand its protein processing capacity. This collaboration will offer the volume required to address the rising worldwide demand for the award-winning plant-based product known as JUST Egg in the United States.
Another Key player, Cargill, Inc., is a privately held American multinational food conglomerate headquartered in Minnetonka, Minnesota, and incorporated in Wilmington, Delaware. Cargill's major businesses include trading, purchasing, and distributing grain and other agricultural commodities such as palm oil; trading in energy, steel, and transportation; livestock raising and feed production; and the production of food ingredients such as starch and glucose syrup, vegetable oils, and fats for use in processed foods and industrial applications.
In June 2022, Cargill stated on June 23 that it had signed a binding deal to purchase Austrian-based Delacon, a global leader in plant-based phytogenic additives, as demand for plant-based feed additives grows.
Similarly, In March 2019, Cargill acquired Smet, a Belgian supplier of chocolate and sweets decorations. This acquisition will likely expand the company's investments in food-thickening agents.
Furthermore, In February 2019, Cargill, a retail food and foodservice enterprise, may now grab their portion of the increasing plant-based protein industry under their brands. The worldwide food and agribusiness corporation said its new private-label plant-based patties and ground goods would be available in supermarkets and restaurants.
Ingredion Incorporated also mark its footprints by offering plant-based thickeners. Ingredion Incorporated is a global American ingredient provider located in Westchester, Illinois, that primarily manufactures starches, non-GMO sweeteners, stevia, and pea protein. Corn, tapioca, potatoes, plant-based stevia, cereals, fruits, gums, and other vegetables are processed into ingredients for the food, beverage, brewing, and pharmaceutical industries, as well as many other industrial sectors.
In March 2019, Ingredion Inc. recently acquired Western Polymer, a potato starch company headquartered in the U. S. Western polymer is the major provider of cationic potato starch.
Scope of the Report
Attribute |
Details |
Estimated Market Size (2022E) |
US$ 3.3 Bn |
Market Projected Size (2032F) |
US$ 7.6 Bn |
Value CAGR (2022-2032) |
8.8% |
Forecast Period |
2022-2032 |
Historical Data Available for |
2017-2021 |
Market Analysis |
US$ Mn for Value and Mt for Volume |
Key Regions Covered |
North America, Latin America, Europe, East Asia, South Asia, and the Middle East & Africa |
Key Countries Covered |
US, Brazil, Mexico, Germany, U.K., China, India, Japan, Australia, and GCC Countries |
Key Segments Covered |
Type, Application, and Region |
Key Companies Profiled |
|
Report Coverage |
Market Forecast, Company Share Analysis, Competition Intelligence, DROT Analysis, Market Dynamics and Challenges, and Strategic Growth Initiatives |
Plant Based Thickener Market by Category
By Type:
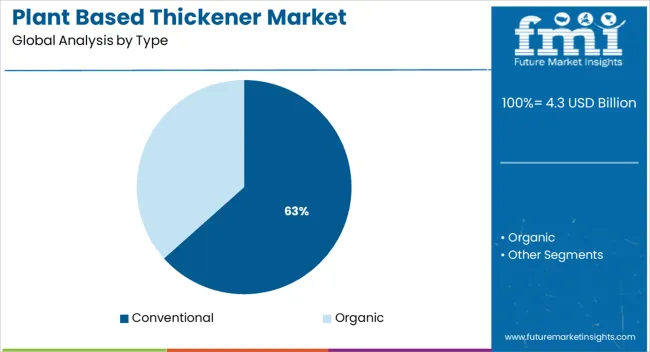
- Organic
- Conventional
By Application:
- Jams & Marmalades
- Baked Goods
- Yogurt
- Seasoning
- Cheese Cream
- Canned Soups & Sauces
By Region:
- North America
- Latin America
- Europe
- Middle east and Africa
- East Asia
- South Asia
- Oceania
Frequently Asked Questions
The Plant Based Thickener market will reach nearly US$ 3.3 Bn by 2022.
The North America Plant Based Thickener market is expected to register 8.8% CAGR between 2022 and 2032.
The demand for Plant Based Thickener is expected to grow at 7.2% CAGR between 2022 and 2032.
This business is predicted to be driven by rising health consciousness and changes in population lifestyles around the world. To gain competitive edge, the market players are likely to focus on expanding their production facilities.
The China Plant Based Thickener market will grow at 8.9% CAGR between 2022 and 2032.
Table of Content
1. Executive Summary
1.1. Global Market Outlook
1.2. Demand-side Trends
1.3. Supply-side Trends
1.4. Technology Roadmap Analysis
1.5. Analysis and Recommendations
2. Market Overview
2.1. Market Coverage / Taxonomy
2.2. Market Definition / Scope / Limitations
3. Market Background
3.1. Market Dynamics
3.1.1. Drivers
3.1.2. Restraints
3.1.3. Opportunity
3.1.4. Trends
3.2. Scenario Forecast
3.2.1. Demand in Optimistic Scenario
3.2.2. Demand in Likely Scenario
3.2.3. Demand in Conservative Scenario
3.3. Product launches & Recent Developments
3.4. Product Life Cycle Analysis
3.5. Value Chain Analysis
3.5.1. Supply Side Participants and their Roles
3.5.1.1. Producers
3.5.1.2. Mid-Level Participants (Traders/ Agents/ Brokers)
3.5.1.3. Wholesalers and Distributors
3.5.2. % of Operating Margin Analysis
3.5.3. List of Raw Material Suppliers
3.5.4. List of Existing and Potential Buyer’s
3.6. Global Plant Based Thickener Market - Pricing Analysis
3.6.1. Price Point Assessment by Region
3.6.2. Price Point Assessment by Product Type
3.6.3. Price Forecast till 2032
3.6.4. Factors affecting pricing
3.7. Forecast Factors - Relevance & Impact
3.8. PESTLE and Porter’s Analysis
3.9. Regulatory Landscape
3.9.1. Packaging & Labelling Regulations
3.9.2. Certifications and Certifying Agency Overview
3.9.3. Import/Export Policies
3.10. Regional Parent Market Outlook
3.11. Production and Consumption Statistics
3.12. Import and Export Statistics
3.13. Consumers Survey Analysis
3.14. Macro-Economic Factors
3.15. Product Claims & Nutritional Information Scan by Buyers
4. Global Plant Based Thickener Market Analysis 2017-2021 and Forecast, 2022-2032
4.1. Historical Market Size Value (US$ Mn) & Volume (MT) Analysis, 2017-2021
4.2. Current and Future Market Size Value (US$ Mn) & Volume (MT) Projections, 2022-2032
4.2.1. Y-o-Y Growth Trend Analysis
4.2.2. Absolute $ Opportunity Analysis
5. Global Plant Based Thickener Market Analysis 2017-2021 and Forecast 2022-2032, By Application
5.1. Introduction / Key Findings
5.2. Historical Market Size Value (US$ Mn) & Volume (MT) Analysis By Application, 2017-2021
5.3. Current and Future Market Size Value (US$ Mn) & Volume (MT) Analysis and Forecast By Application, 2022-2032
5.3.1. Jams & Marmalades
5.3.2. Baked Goods
5.3.3. Yogurt
5.3.4. Seasoning
5.3.5. Cheese Cream
5.3.6. Canned Soups & Sauces
5.4. Y-o-Y Growth Trend Analysis By Application, 2017-2021
5.5. Absolute $ Opportunity Analysis By Application, 2022-2032
6. Global Plant Based Thickener Market Analysis 2017-2021 and Forecast 2022-2032, By Nature
6.1. Introduction / Key Findings
6.2. Historical Market Size Value (US$ Mn) & Volume (MT) Analysis By Nature, 2017-2021
6.3. Current and Future Market Size Value (US$ Mn) & Volume (MT) Analysis and Forecast By Nature, 2022-2032
6.3.1. Organic
6.3.2. Conventional
6.4. Y-o-Y Growth Trend Analysis By Nature, 2017-2021
6.5. Absolute $ Opportunity Analysis By Nature, 2022-2032
7. Global Plant Based Thickener Market Analysis 2017-2021 and Forecast 2022-2032, By Region
7.1. Introduction
7.2. Historical Market Size Value (US$ Mn) & Volume (MT) Analysis By Region, 2017-2021
7.3. Current Market Size Value (US$ Mn) & Volume (MT) Analysis and Forecast By Region, 2022-2032
7.3.1. North America
7.3.2. Latin America
7.3.3. Europe
7.3.4. East Asia
7.3.5. South Asia
7.3.6. Oceania
7.3.7. MEA
7.4. Market Attractiveness Analysis By Region
8. North America Plant Based Thickener Market Analysis 2017-2021 and Forecast 2022-2032, By Country
8.1. Historical Market Size Value (US$ Mn) & Volume (MT) Trend Analysis By Market Taxonomy, 2017-2021
8.2. Market Size Value (US$ Mn) & Volume (MT) Forecast By Market Taxonomy, 2022-2032
8.2.1. By Country
8.2.1.1. U.S.
8.2.1.2. Canada
8.2.2. By Application
8.2.3. By Nature
8.3. Market Attractiveness Analysis
8.3.1. By Country
8.3.2. By Application
8.3.3. By Nature
8.4. Key Takeaways
9. Latin America Plant Based Thickener Market Analysis 2017-2021 and Forecast 2022-2032, By Country
9.1. Historical Market Size Value (US$ Mn) & Volume (MT) Trend Analysis By Market Taxonomy, 2017-2021
9.2. Market Size Value (US$ Mn) & Volume (MT) Forecast By Market Taxonomy, 2022-2032
9.2.1. By Country
9.2.1.1. Brazil
9.2.1.2. Mexico
9.2.1.3. Argentina
9.2.1.4. Chile
9.2.1.5. Peru
9.2.1.6. Rest of Latin America
9.2.2. By Application
9.2.3. By Nature
9.3. Market Attractiveness Analysis
9.3.1. By Country
9.3.2. By Application
9.3.3. By Nature
9.4. Key Takeaways
10. Europe Plant Based Thickener Market Analysis 2017-2021 and Forecast 2022-2032, By Country
10.1. Historical Market Size Value (US$ Mn) & Volume (MT) Trend Analysis By Market Taxonomy, 2017-2021
10.2. Market Size Value (US$ Mn) & Volume (MT) Forecast By Market Taxonomy, 2022-2032
10.2.1. By Country
10.2.1.1. Germany
10.2.1.2. Italy
10.2.1.3. France
10.2.1.4. U.K.
10.2.1.5. Spain
10.2.1.6. Russia
10.2.1.7. BENELUX
10.2.1.8. Poland
10.2.1.9. Nordic Countries
10.2.1.10. Rest of Europe
10.2.2. By Application
10.2.3. By Nature
10.3. Market Attractiveness Analysis
10.3.1. By Country
10.3.2. By Application
10.3.3. By Nature
10.4. Key Takeaways
11. East Asia Plant Based Thickener Market Analysis 2017-2021 and Forecast 2022-2032, By Country
11.1. Historical Market Size Value (US$ Mn) & Volume (MT) Trend Analysis By Market Taxonomy, 2017-2021
11.2. Market Size Value (US$ Mn) & Volume (MT) Forecast By Market Taxonomy, 2022-2032
11.2.1. By Country
11.2.1.1. China
11.2.1.2. Japan
11.2.1.3. South Korea
11.2.2. By Application
11.2.3. By Nature
11.3. Market Attractiveness Analysis
11.3.1. By Country
11.3.2. By Application
11.3.3. By Nature
11.4. Key Takeaways
12. South Asia Plant Based Thickener Market Analysis 2017-2021 and Forecast 2022-2032, By Country
12.1. Historical Market Size Value (US$ Mn) & Volume (MT) Trend Analysis By Market Taxonomy, 2017-2021
12.2. Market Size Value (US$ Mn) & Volume (MT) Forecast By Market Taxonomy, 2022-2032
12.2.1. By Country
12.2.1.1. India
12.2.1.2. Thailand
12.2.1.3. Malaysia
12.2.1.4. Indonesia
12.2.1.5. Singapore
12.2.1.6. Rest of South Asia
12.2.2. By Application
12.2.3. By Nature
12.3. Market Attractiveness Analysis
12.3.1. By Country
12.3.2. By Application
12.3.3. By Nature
12.4. Key Takeaways
13. Oceania Plant Based Thickener Market Analysis 2017-2021 and Forecast 2022-2032, By Country
13.1. Historical Market Size Value (US$ Mn) & Volume (MT) Trend Analysis By Market Taxonomy, 2017-2021
13.2. Market Size Value (US$ Mn) & Volume (MT) Forecast By Market Taxonomy, 2022-2032
13.2.1. By Country
13.2.1.1. Australia
13.2.1.2. New Zealand
13.2.2. By Application
13.2.3. By Nature
13.3. Market Attractiveness Analysis
13.3.1. By Country
13.3.2. By Application
13.3.3. By Nature
13.4. Key Takeaways
14. MEA Plant Based Thickener Market Analysis 2017-2021 and Forecast 2022-2032, By Country
14.1. Historical Market Size Value (US$ Mn) & Volume (MT) Trend Analysis By Market Taxonomy, 2017-2021
14.2. Market Size Value (US$ Mn) & Volume (MT) Forecast By Market Taxonomy, 2022-2032
14.2.1. By Country
14.2.1.1. GCC Countries
14.2.1.2. South Africa
14.2.1.3. Central Africa
14.2.1.4. North Africa
14.2.2. By Application
14.2.3. By Nature
14.3. Market Attractiveness Analysis
14.3.1. By Country
14.3.2. By Application
14.3.3. By Nature
14.4. Key Takeaways
15. Key Countries Plant Based Thickener Market Analysis
15.1. U.S.
15.1.1. Pricing Analysis
15.1.2. Market Share Analysis, 2021
15.1.2.1. By Application
15.1.2.2. By Nature
15.2. Canada
15.2.1. Pricing Analysis
15.2.2. Market Share Analysis, 2021
15.2.2.1. By Application
15.2.2.2. By Nature
15.3. Brazil
15.3.1. Pricing Analysis
15.3.2. Market Share Analysis, 2021
15.3.2.1. By Application
15.3.2.2. By Nature
15.4. Mexico
15.4.1. Pricing Analysis
15.4.2. Market Share Analysis, 2021
15.4.2.1. By Application
15.4.2.2. By Nature
15.5. Argentina
15.5.1. Pricing Analysis
15.5.2. Market Share Analysis, 2021
15.5.2.1. By Application
15.5.2.2. By Nature
15.6. Chile
15.6.1. Pricing Analysis
15.6.2. Market Share Analysis, 2021
15.6.2.1. By Application
15.6.2.2. By Nature
15.7. Peru
15.7.1. Pricing Analysis
15.7.2. Market Share Analysis, 2021
15.7.2.1. By Application
15.7.2.2. By Nature
15.8. Germany
15.8.1. Pricing Analysis
15.8.2. Market Share Analysis, 2021
15.8.2.1. By Application
15.8.2.2. By Nature
15.9. Italy
15.9.1. Pricing Analysis
15.9.2. Market Share Analysis, 2021
15.9.2.1. By Application
15.9.2.2. By Nature
15.10. France
15.10.1. Pricing Analysis
15.10.2. Market Share Analysis, 2021
15.10.2.1. By Application
15.10.2.2. By Nature
15.11. Spain
15.11.1. Pricing Analysis
15.11.2. Market Share Analysis, 2021
15.11.2.1. By Application
15.11.2.2. By Nature
15.12. U.K.
15.12.1. Pricing Analysis
15.12.2. Market Share Analysis, 2021
15.12.2.1. By Application
15.12.2.2. By Nature
15.13. Russia
15.13.1. Pricing Analysis
15.13.2. Market Share Analysis, 2021
15.13.2.1. By Application
15.13.2.2. By Nature
15.14. Poland
15.14.1. Pricing Analysis
15.14.2. Market Share Analysis, 2021
15.14.2.1. By Application
15.14.2.2. By Nature
15.15. BENELUX
15.15.1. Pricing Analysis
15.15.2. Market Share Analysis, 2021
15.15.2.1. By Application
15.15.2.2. By Nature
15.16. Nordic Countries
15.16.1. Pricing Analysis
15.16.2. Market Share Analysis, 2021
15.16.2.1. By Application
15.16.2.2. By Nature
15.17. China
15.17.1. Pricing Analysis
15.17.2. Market Share Analysis, 2021
15.17.2.1. By Application
15.17.2.2. By Nature
15.18. Japan
15.18.1. Pricing Analysis
15.18.2. Market Share Analysis, 2021
15.18.2.1. By Application
15.18.2.2. By Nature
15.19. South Korea
15.19.1. Pricing Analysis
15.19.2. Market Share Analysis, 2021
15.19.2.1. By Application
15.19.2.2. By Nature
15.20. India
15.20.1. Pricing Analysis
15.20.2. Market Share Analysis, 2021
15.20.2.1. By Application
15.20.2.2. By Nature
15.21. Thailand
15.21.1. Pricing Analysis
15.21.2. Market Share Analysis, 2021
15.21.2.1. By Application
15.21.2.2. By Nature
15.22. Indonesia
15.22.1. Pricing Analysis
15.22.2. Market Share Analysis, 2021
15.22.2.1. By Application
15.22.2.2. By Nature
15.23. Malaysia
15.23.1. Pricing Analysis
15.23.2. Market Share Analysis, 2021
15.23.2.1. By Application
15.23.2.2. By Nature
15.24. Singapore
15.24.1. Pricing Analysis
15.24.2. Market Share Analysis, 2021
15.24.2.1. By Application
15.24.2.2. By Nature
15.25. Australia
15.25.1. Pricing Analysis
15.25.2. Market Share Analysis, 2021
15.25.2.1. By Application
15.25.2.2. By Nature
15.26. New Zealand
15.26.1. Pricing Analysis
15.26.2. Market Share Analysis, 2021
15.26.2.1. By Application
15.26.2.2. By Nature
15.27. GCC Countries
15.27.1. Pricing Analysis
15.27.2. Market Share Analysis, 2021
15.27.2.1. By Application
15.27.2.2. By Nature
15.28. South Africa
15.28.1. Pricing Analysis
15.28.2. Market Share Analysis, 2021
15.28.2.1. By Application
15.28.2.2. By Nature
15.29. North Africa
15.29.1. Pricing Analysis
15.29.2. Market Share Analysis, 2021
15.29.2.1. By Application
15.29.2.2. By Nature
15.30. Central Africa
15.30.1. Pricing Analysis
15.30.2. Market Share Analysis, 2021
15.30.2.1. By Application
15.30.2.2. By Nature
16. Market Structure Analysis
16.1. Competition Dashboard
16.2. Competition Benchmarking
16.3. Market Share Analysis of Top Players
16.3.1. By Regional
16.3.2. By Application
16.3.3. By Nature
17. Competition Analysis
17.1. Competition Deep Dive
17.1.1. Emsland Starke GmbH
17.1.1.1. Overview
17.1.1.2. Product Portfolio
17.1.1.3. Profitability by Market Segments (Nature/Product type/Region)
17.1.1.4. Sales Footprint
17.1.1.5. Strategy Overview
17.1.1.5.1. Marketing Strategy
17.1.1.5.2. Product Strategy
17.1.1.5.3. Channel Strategy
17.1.2. Tate & Lyle
17.1.2.1. Overview
17.1.2.2. Product Portfolio
17.1.2.3. Profitability by Market Segments (Nature/Product type/Region)
17.1.2.4. Sales Footprint
17.1.2.5. Strategy Overview
17.1.2.5.1. Marketing Strategy
17.1.2.5.2. Product Strategy
17.1.2.5.3. Channel Strategy
17.1.3. Cargill
17.1.3.1. Overview
17.1.3.2. Product Portfolio
17.1.3.3. Profitability by Market Segments (Nature/Product type/Region)
17.1.3.4. Sales Footprint
17.1.3.5. Strategy Overview
17.1.3.5.1. Marketing Strategy
17.1.3.5.2. Product Strategy
17.1.3.5.3. Channel Strategy
17.1.4. Ingredion
17.1.4.1. Overview
17.1.4.2. Product Portfolio
17.1.4.3. Profitability by Market Segments (Nature/Product type/Region)
17.1.4.4. Sales Footprint
17.1.4.5. Strategy Overview
17.1.4.5.1. Marketing Strategy
17.1.4.5.2. Product Strategy
17.1.4.5.3. Channel Strategy
17.1.5. Novidon
17.1.5.1. Overview
17.1.5.2. Product Portfolio
17.1.5.3. Profitability by Market Segments (Nature/Product type/Region)
17.1.5.4. Sales Footprint
17.1.5.5. Strategy Overview
17.1.5.5.1. Marketing Strategy
17.1.5.5.2. Product Strategy
17.1.5.5.3. Channel Strategy
17.1.6. Sudstarke GmbH
17.1.6.1. Overview
17.1.6.2. Product Portfolio
17.1.6.3. Profitability by Market Segments (Nature/Product type/Region)
17.1.6.4. Sales Footprint
17.1.6.5. Strategy Overview
17.1.6.5.1. Marketing Strategy
17.1.6.5.2. Product Strategy
17.1.6.5.3. Channel Strategy
17.1.7. Avebe
17.1.7.1. Overview
17.1.7.2. Product Portfolio
17.1.7.3. Profitability by Market Segments (Nature/Product type/Region)
17.1.7.4. Sales Footprint
17.1.7.5. Strategy Overview
17.1.7.5.1. Marketing Strategy
17.1.7.5.2. Product Strategy
17.1.7.5.3. Channel Strategy
17.1.8. Agrana
17.1.8.1. Overview
17.1.8.2. Product Portfolio
17.1.8.3. Profitability by Market Segments (Nature/Product type/Region)
17.1.8.4. Sales Footprint
17.1.8.5. Strategy Overview
17.1.8.5.1. Marketing Strategy
17.1.8.5.2. Product Strategy
17.1.8.5.3. Channel Strategy
17.1.9. Tereos
17.1.9.1. Overview
17.1.9.2. Product Portfolio
17.1.9.3. Profitability by Market Segments (Nature/Product type/Region)
17.1.9.4. Sales Footprint
17.1.9.5. Strategy Overview
17.1.9.5.1. Marketing Strategy
17.1.9.5.2. Product Strategy
17.1.9.5.3. Channel Strategy
18. Assumptions & Acronyms Used
19. Research Methodology
Let us know your requirement to get
100% FREE customization
List of Tables
Table 1: Global Plant Based Thickener Market Value (US$ Mn) Forecast by Region, 2017-2032
Table 2: Global Plant Based Thickener Market Volume (MT) Forecast by Region, 2017-2032
Table 3: Global Plant Based Thickener Market Value (US$ Mn) Forecast by Application, 2017-2032
Table 4: Global Plant Based Thickener Market Volume (MT) Forecast by Application, 2017-2032
Table 5: Global Plant Based Thickener Market Value (US$ Mn) Forecast by Nature, 2017-2032
Table 6: Global Plant Based Thickener Market Volume (MT) Forecast by Nature, 2017-2032
Table 7: North America Plant Based Thickener Market Value (US$ Mn) Forecast by Country, 2017-2032
Table 8: North America Plant Based Thickener Market Volume (MT) Forecast by Country, 2017-2032
Table 9: North America Plant Based Thickener Market Value (US$ Mn) Forecast by Application, 2017-2032
Table 10: North America Plant Based Thickener Market Volume (MT) Forecast by Application, 2017-2032
Table 11: North America Plant Based Thickener Market Value (US$ Mn) Forecast by Nature, 2017-2032
Table 12: North America Plant Based Thickener Market Volume (MT) Forecast by Nature, 2017-2032
Table 13: Latin America Plant Based Thickener Market Value (US$ Mn) Forecast by Country, 2017-2032
Table 14: Latin America Plant Based Thickener Market Volume (MT) Forecast by Country, 2017-2032
Table 15: Latin America Plant Based Thickener Market Value (US$ Mn) Forecast by Application, 2017-2032
Table 16: Latin America Plant Based Thickener Market Volume (MT) Forecast by Application, 2017-2032
Table 17: Latin America Plant Based Thickener Market Value (US$ Mn) Forecast by Nature, 2017-2032
Table 18: Latin America Plant Based Thickener Market Volume (MT) Forecast by Nature, 2017-2032
Table 19: Europe Plant Based Thickener Market Value (US$ Mn) Forecast by Country, 2017-2032
Table 20: Europe Plant Based Thickener Market Volume (MT) Forecast by Country, 2017-2032
Table 21: Europe Plant Based Thickener Market Value (US$ Mn) Forecast by Application, 2017-2032
Table 22: Europe Plant Based Thickener Market Volume (MT) Forecast by Application, 2017-2032
Table 23: Europe Plant Based Thickener Market Value (US$ Mn) Forecast by Nature, 2017-2032
Table 24: Europe Plant Based Thickener Market Volume (MT) Forecast by Nature, 2017-2032
Table 25: East Asia Plant Based Thickener Market Value (US$ Mn) Forecast by Country, 2017-2032
Table 26: East Asia Plant Based Thickener Market Volume (MT) Forecast by Country, 2017-2032
Table 27: East Asia Plant Based Thickener Market Value (US$ Mn) Forecast by Application, 2017-2032
Table 28: East Asia Plant Based Thickener Market Volume (MT) Forecast by Application, 2017-2032
Table 29: East Asia Plant Based Thickener Market Value (US$ Mn) Forecast by Nature, 2017-2032
Table 30: East Asia Plant Based Thickener Market Volume (MT) Forecast by Nature, 2017-2032
Table 31: South Asia Plant Based Thickener Market Value (US$ Mn) Forecast by Country, 2017-2032
Table 32: South Asia Plant Based Thickener Market Volume (MT) Forecast by Country, 2017-2032
Table 33: South Asia Plant Based Thickener Market Value (US$ Mn) Forecast by Application, 2017-2032
Table 34: South Asia Plant Based Thickener Market Volume (MT) Forecast by Application, 2017-2032
Table 35: South Asia Plant Based Thickener Market Value (US$ Mn) Forecast by Nature, 2017-2032
Table 36: South Asia Plant Based Thickener Market Volume (MT) Forecast by Nature, 2017-2032
Table 37: Oceania Plant Based Thickener Market Value (US$ Mn) Forecast by Country, 2017-2032
Table 38: Oceania Plant Based Thickener Market Volume (MT) Forecast by Country, 2017-2032
Table 39: Oceania Plant Based Thickener Market Value (US$ Mn) Forecast by Application, 2017-2032
Table 40: Oceania Plant Based Thickener Market Volume (MT) Forecast by Application, 2017-2032
Table 41: Oceania Plant Based Thickener Market Value (US$ Mn) Forecast by Nature, 2017-2032
Table 42: Oceania Plant Based Thickener Market Volume (MT) Forecast by Nature, 2017-2032
Table 43: MEA Plant Based Thickener Market Value (US$ Mn) Forecast by Country, 2017-2032
Table 44: MEA Plant Based Thickener Market Volume (MT) Forecast by Country, 2017-2032
Table 45: MEA Plant Based Thickener Market Value (US$ Mn) Forecast by Application, 2017-2032
Table 46: MEA Plant Based Thickener Market Volume (MT) Forecast by Application, 2017-2032
Table 47: MEA Plant Based Thickener Market Value (US$ Mn) Forecast by Nature, 2017-2032
Table 48: MEA Plant Based Thickener Market Volume (MT) Forecast by Nature, 2017-2032
Find your sweet spots for generating winning opportunities in this market.
Talk to AnalystList of Charts
Figure 1: Global Plant Based Thickener Market Value (US$ Mn) by Application, 2022-2032
Figure 2: Global Plant Based Thickener Market Value (US$ Mn) by Nature, 2022-2032
Figure 3: Global Plant Based Thickener Market Value (US$ Mn) by Region, 2022-2032
Figure 4: Global Plant Based Thickener Market Value (US$ Mn) Analysis by Region, 2017-2032
Figure 5: Global Plant Based Thickener Market Volume (MT) Analysis by Region, 2017-2032
Figure 6: Global Plant Based Thickener Market Value Share (%) and BPS Analysis by Region, 2022-2032
Figure 7: Global Plant Based Thickener Market Y-o-Y Growth (%) Projections by Region, 2022-2032
Figure 8: Global Plant Based Thickener Market Value (US$ Mn) Analysis by Application, 2017-2032
Figure 9: Global Plant Based Thickener Market Volume (MT) Analysis by Application, 2017-2032
Figure 10: Global Plant Based Thickener Market Value Share (%) and BPS Analysis by Application, 2022-2032
Figure 11: Global Plant Based Thickener Market Y-o-Y Growth (%) Projections by Application, 2022-2032
Figure 12: Global Plant Based Thickener Market Value (US$ Mn) Analysis by Nature, 2017-2032
Figure 13: Global Plant Based Thickener Market Volume (MT) Analysis by Nature, 2017-2032
Figure 14: Global Plant Based Thickener Market Value Share (%) and BPS Analysis by Nature, 2022-2032
Figure 15: Global Plant Based Thickener Market Y-o-Y Growth (%) Projections by Nature, 2022-2032
Figure 16: Global Plant Based Thickener Market Attractiveness by Application, 2022-2032
Figure 17: Global Plant Based Thickener Market Attractiveness by Nature, 2022-2032
Figure 18: Global Plant Based Thickener Market Attractiveness by Region, 2022-2032
Figure 19: North America Plant Based Thickener Market Value (US$ Mn) by Application, 2022-2032
Figure 20: North America Plant Based Thickener Market Value (US$ Mn) by Nature, 2022-2032
Figure 21: North America Plant Based Thickener Market Value (US$ Mn) by Country, 2022-2032
Figure 22: North America Plant Based Thickener Market Value (US$ Mn) Analysis by Country, 2017-2032
Figure 23: North America Plant Based Thickener Market Volume (MT) Analysis by Country, 2017-2032
Figure 24: North America Plant Based Thickener Market Value Share (%) and BPS Analysis by Country, 2022-2032
Figure 25: North America Plant Based Thickener Market Y-o-Y Growth (%) Projections by Country, 2022-2032
Figure 26: North America Plant Based Thickener Market Value (US$ Mn) Analysis by Application, 2017-2032
Figure 27: North America Plant Based Thickener Market Volume (MT) Analysis by Application, 2017-2032
Figure 28: North America Plant Based Thickener Market Value Share (%) and BPS Analysis by Application, 2022-2032
Figure 29: North America Plant Based Thickener Market Y-o-Y Growth (%) Projections by Application, 2022-2032
Figure 30: North America Plant Based Thickener Market Value (US$ Mn) Analysis by Nature, 2017-2032
Figure 31: North America Plant Based Thickener Market Volume (MT) Analysis by Nature, 2017-2032
Figure 32: North America Plant Based Thickener Market Value Share (%) and BPS Analysis by Nature, 2022-2032
Figure 33: North America Plant Based Thickener Market Y-o-Y Growth (%) Projections by Nature, 2022-2032
Figure 34: North America Plant Based Thickener Market Attractiveness by Application, 2022-2032
Figure 35: North America Plant Based Thickener Market Attractiveness by Nature, 2022-2032
Figure 36: North America Plant Based Thickener Market Attractiveness by Country, 2022-2032
Figure 37: Latin America Plant Based Thickener Market Value (US$ Mn) by Application, 2022-2032
Figure 38: Latin America Plant Based Thickener Market Value (US$ Mn) by Nature, 2022-2032
Figure 39: Latin America Plant Based Thickener Market Value (US$ Mn) by Country, 2022-2032
Figure 40: Latin America Plant Based Thickener Market Value (US$ Mn) Analysis by Country, 2017-2032
Figure 41: Latin America Plant Based Thickener Market Volume (MT) Analysis by Country, 2017-2032
Figure 42: Latin America Plant Based Thickener Market Value Share (%) and BPS Analysis by Country, 2022-2032
Figure 43: Latin America Plant Based Thickener Market Y-o-Y Growth (%) Projections by Country, 2022-2032
Figure 44: Latin America Plant Based Thickener Market Value (US$ Mn) Analysis by Application, 2017-2032
Figure 45: Latin America Plant Based Thickener Market Volume (MT) Analysis by Application, 2017-2032
Figure 46: Latin America Plant Based Thickener Market Value Share (%) and BPS Analysis by Application, 2022-2032
Figure 47: Latin America Plant Based Thickener Market Y-o-Y Growth (%) Projections by Application, 2022-2032
Figure 48: Latin America Plant Based Thickener Market Value (US$ Mn) Analysis by Nature, 2017-2032
Figure 49: Latin America Plant Based Thickener Market Volume (MT) Analysis by Nature, 2017-2032
Figure 50: Latin America Plant Based Thickener Market Value Share (%) and BPS Analysis by Nature, 2022-2032
Figure 51: Latin America Plant Based Thickener Market Y-o-Y Growth (%) Projections by Nature, 2022-2032
Figure 52: Latin America Plant Based Thickener Market Attractiveness by Application, 2022-2032
Figure 53: Latin America Plant Based Thickener Market Attractiveness by Nature, 2022-2032
Figure 54: Latin America Plant Based Thickener Market Attractiveness by Country, 2022-2032
Figure 55: Europe Plant Based Thickener Market Value (US$ Mn) by Application, 2022-2032
Figure 56: Europe Plant Based Thickener Market Value (US$ Mn) by Nature, 2022-2032
Figure 57: Europe Plant Based Thickener Market Value (US$ Mn) by Country, 2022-2032
Figure 58: Europe Plant Based Thickener Market Value (US$ Mn) Analysis by Country, 2017-2032
Figure 59: Europe Plant Based Thickener Market Volume (MT) Analysis by Country, 2017-2032
Figure 60: Europe Plant Based Thickener Market Value Share (%) and BPS Analysis by Country, 2022-2032
Figure 61: Europe Plant Based Thickener Market Y-o-Y Growth (%) Projections by Country, 2022-2032
Figure 62: Europe Plant Based Thickener Market Value (US$ Mn) Analysis by Application, 2017-2032
Figure 63: Europe Plant Based Thickener Market Volume (MT) Analysis by Application, 2017-2032
Figure 64: Europe Plant Based Thickener Market Value Share (%) and BPS Analysis by Application, 2022-2032
Figure 65: Europe Plant Based Thickener Market Y-o-Y Growth (%) Projections by Application, 2022-2032
Figure 66: Europe Plant Based Thickener Market Value (US$ Mn) Analysis by Nature, 2017-2032
Figure 67: Europe Plant Based Thickener Market Volume (MT) Analysis by Nature, 2017-2032
Figure 68: Europe Plant Based Thickener Market Value Share (%) and BPS Analysis by Nature, 2022-2032
Figure 69: Europe Plant Based Thickener Market Y-o-Y Growth (%) Projections by Nature, 2022-2032
Figure 70: Europe Plant Based Thickener Market Attractiveness by Application, 2022-2032
Figure 71: Europe Plant Based Thickener Market Attractiveness by Nature, 2022-2032
Figure 72: Europe Plant Based Thickener Market Attractiveness by Country, 2022-2032
Figure 73: East Asia Plant Based Thickener Market Value (US$ Mn) by Application, 2022-2032
Figure 74: East Asia Plant Based Thickener Market Value (US$ Mn) by Nature, 2022-2032
Figure 75: East Asia Plant Based Thickener Market Value (US$ Mn) by Country, 2022-2032
Figure 76: East Asia Plant Based Thickener Market Value (US$ Mn) Analysis by Country, 2017-2032
Figure 77: East Asia Plant Based Thickener Market Volume (MT) Analysis by Country, 2017-2032
Figure 78: East Asia Plant Based Thickener Market Value Share (%) and BPS Analysis by Country, 2022-2032
Figure 79: East Asia Plant Based Thickener Market Y-o-Y Growth (%) Projections by Country, 2022-2032
Figure 80: East Asia Plant Based Thickener Market Value (US$ Mn) Analysis by Application, 2017-2032
Figure 81: East Asia Plant Based Thickener Market Volume (MT) Analysis by Application, 2017-2032
Figure 82: East Asia Plant Based Thickener Market Value Share (%) and BPS Analysis by Application, 2022-2032
Figure 83: East Asia Plant Based Thickener Market Y-o-Y Growth (%) Projections by Application, 2022-2032
Figure 84: East Asia Plant Based Thickener Market Value (US$ Mn) Analysis by Nature, 2017-2032
Figure 85: East Asia Plant Based Thickener Market Volume (MT) Analysis by Nature, 2017-2032
Figure 86: East Asia Plant Based Thickener Market Value Share (%) and BPS Analysis by Nature, 2022-2032
Figure 87: East Asia Plant Based Thickener Market Y-o-Y Growth (%) Projections by Nature, 2022-2032
Figure 88: East Asia Plant Based Thickener Market Attractiveness by Application, 2022-2032
Figure 89: East Asia Plant Based Thickener Market Attractiveness by Nature, 2022-2032
Figure 90: East Asia Plant Based Thickener Market Attractiveness by Country, 2022-2032
Figure 91: South Asia Plant Based Thickener Market Value (US$ Mn) by Application, 2022-2032
Figure 92: South Asia Plant Based Thickener Market Value (US$ Mn) by Nature, 2022-2032
Figure 93: South Asia Plant Based Thickener Market Value (US$ Mn) by Country, 2022-2032
Figure 94: South Asia Plant Based Thickener Market Value (US$ Mn) Analysis by Country, 2017-2032
Figure 95: South Asia Plant Based Thickener Market Volume (MT) Analysis by Country, 2017-2032
Figure 96: South Asia Plant Based Thickener Market Value Share (%) and BPS Analysis by Country, 2022-2032
Figure 97: South Asia Plant Based Thickener Market Y-o-Y Growth (%) Projections by Country, 2022-2032
Figure 98: South Asia Plant Based Thickener Market Value (US$ Mn) Analysis by Application, 2017-2032
Figure 99: South Asia Plant Based Thickener Market Volume (MT) Analysis by Application, 2017-2032
Figure 100: South Asia Plant Based Thickener Market Value Share (%) and BPS Analysis by Application, 2022-2032
Figure 101: South Asia Plant Based Thickener Market Y-o-Y Growth (%) Projections by Application, 2022-2032
Figure 102: South Asia Plant Based Thickener Market Value (US$ Mn) Analysis by Nature, 2017-2032
Figure 103: South Asia Plant Based Thickener Market Volume (MT) Analysis by Nature, 2017-2032
Figure 104: South Asia Plant Based Thickener Market Value Share (%) and BPS Analysis by Nature, 2022-2032
Figure 105: South Asia Plant Based Thickener Market Y-o-Y Growth (%) Projections by Nature, 2022-2032
Figure 106: South Asia Plant Based Thickener Market Attractiveness by Application, 2022-2032
Figure 107: South Asia Plant Based Thickener Market Attractiveness by Nature, 2022-2032
Figure 108: South Asia Plant Based Thickener Market Attractiveness by Country, 2022-2032
Figure 109: Oceania Plant Based Thickener Market Value (US$ Mn) by Application, 2022-2032
Figure 110: Oceania Plant Based Thickener Market Value (US$ Mn) by Nature, 2022-2032
Figure 111: Oceania Plant Based Thickener Market Value (US$ Mn) by Country, 2022-2032
Figure 112: Oceania Plant Based Thickener Market Value (US$ Mn) Analysis by Country, 2017-2032
Figure 113: Oceania Plant Based Thickener Market Volume (MT) Analysis by Country, 2017-2032
Figure 114: Oceania Plant Based Thickener Market Value Share (%) and BPS Analysis by Country, 2022-2032
Figure 115: Oceania Plant Based Thickener Market Y-o-Y Growth (%) Projections by Country, 2022-2032
Figure 116: Oceania Plant Based Thickener Market Value (US$ Mn) Analysis by Application, 2017-2032
Figure 117: Oceania Plant Based Thickener Market Volume (MT) Analysis by Application, 2017-2032
Figure 118: Oceania Plant Based Thickener Market Value Share (%) and BPS Analysis by Application, 2022-2032
Figure 119: Oceania Plant Based Thickener Market Y-o-Y Growth (%) Projections by Application, 2022-2032
Figure 120: Oceania Plant Based Thickener Market Value (US$ Mn) Analysis by Nature, 2017-2032
Figure 121: Oceania Plant Based Thickener Market Volume (MT) Analysis by Nature, 2017-2032
Figure 122: Oceania Plant Based Thickener Market Value Share (%) and BPS Analysis by Nature, 2022-2032
Figure 123: Oceania Plant Based Thickener Market Y-o-Y Growth (%) Projections by Nature, 2022-2032
Figure 124: Oceania Plant Based Thickener Market Attractiveness by Application, 2022-2032
Figure 125: Oceania Plant Based Thickener Market Attractiveness by Nature, 2022-2032
Figure 126: Oceania Plant Based Thickener Market Attractiveness by Country, 2022-2032
Figure 127: MEA Plant Based Thickener Market Value (US$ Mn) by Application, 2022-2032
Figure 128: MEA Plant Based Thickener Market Value (US$ Mn) by Nature, 2022-2032
Figure 129: MEA Plant Based Thickener Market Value (US$ Mn) by Country, 2022-2032
Figure 130: MEA Plant Based Thickener Market Value (US$ Mn) Analysis by Country, 2017-2032
Figure 131: MEA Plant Based Thickener Market Volume (MT) Analysis by Country, 2017-2032
Figure 132: MEA Plant Based Thickener Market Value Share (%) and BPS Analysis by Country, 2022-2032
Figure 133: MEA Plant Based Thickener Market Y-o-Y Growth (%) Projections by Country, 2022-2032
Figure 134: MEA Plant Based Thickener Market Value (US$ Mn) Analysis by Application, 2017-2032
Figure 135: MEA Plant Based Thickener Market Volume (MT) Analysis by Application, 2017-2032
Figure 136: MEA Plant Based Thickener Market Value Share (%) and BPS Analysis by Application, 2022-2032
Figure 137: MEA Plant Based Thickener Market Y-o-Y Growth (%) Projections by Application, 2022-2032
Figure 138: MEA Plant Based Thickener Market Value (US$ Mn) Analysis by Nature, 2017-2032
Figure 139: MEA Plant Based Thickener Market Volume (MT) Analysis by Nature, 2017-2032
Figure 140: MEA Plant Based Thickener Market Value Share (%) and BPS Analysis by Nature, 2022-2032
Figure 141: MEA Plant Based Thickener Market Y-o-Y Growth (%) Projections by Nature, 2022-2032
Figure 142: MEA Plant Based Thickener Market Attractiveness by Application, 2022-2032
Figure 143: MEA Plant Based Thickener Market Attractiveness by Nature, 2022-2032
Figure 144: MEA Plant Based Thickener Market Attractiveness by Country, 2022-2032
Need specific information?
Request CustomizationExplore Food and Beverage Insights
View Reports