Plant-based Yogurt Market Size and Share Forecast Outlook 2025 to 2035

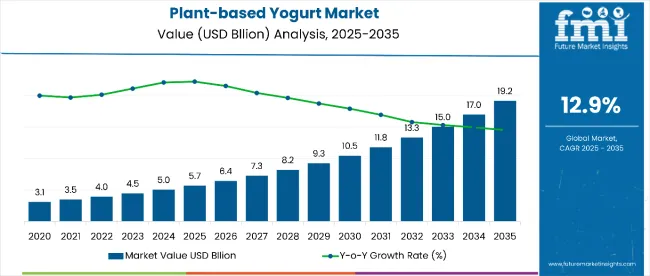
The plant-based yogurt market is valued at USD 5.7 billion in 2025 and is slated to reach USD 19.3 billion by 2035, which shows a 12.9% CAGR. The plant-based yogurt market is experiencing significant growth due to increasing consumer awareness of health and wellness.
Quick Stats of Plant-based Yogurt Market

  • Market Value (2025): USD 5.7 billion
  • Forecast Value (2035): USD 19.3 billion
  • Forecast CAGR: 12.9%
  • Nature Leader in 2025: Functional Ingredients (48% market share)
  • Top Sales Channel Segment: Retail (62% share)
  • Key Growth Region: Asia Pacific (South Korea fastest-growing market with a 13.2% CAGR)
Metric Value
Market Size in 2025 USD 5.7 billion
Projected Market Size in 2035 USD 19.3 billion
CAGR (2025 to 2035) 12.9%

Many people are turning away from traditional dairy products because of lactose intolerance, dairy allergies, and concerns about cholesterol and saturated fat. Plant-based yogurts, often made from almond, coconut, oat, or soy, provide a lactose-free and cholesterol-free alternative that is often fortified with probiotics and essential nutrients. The rising demand for gut-friendly and low-sugar options, particularly among younger, health-conscious demographics, is driving this shift.

Another key factor behind the market’s growth is the rising concern over environmental sustainability and animal welfare. Consumers are increasingly aware of the ecological footprint of dairy farming, including its greenhouse gas emissions, water usage, and impact on biodiversity. As a result, many are choosing plant-based options as a way to reduce their environmental impact. This trend is reinforced by the popularity of vegan, vegetarian, and flexitarian diets, which are being adopted by a growing number of people for ethical, environmental, or personal health reasons.

Innovation and accessibility are also playing major roles in the expansion of the plant-based yogurt market. Advances in food technology have led to significant improvements in taste, texture, and nutritional content, making these products more appealing and comparable to dairy yogurt.

At the same time, increased availability in mainstream supermarkets, health food stores, and online platforms has made it easier for consumers to access these options. Companies are offering a wider range of flavors and formats, including drinkable yogurts and high-protein variants, catering to diverse consumer preferences and further fueling market growth.
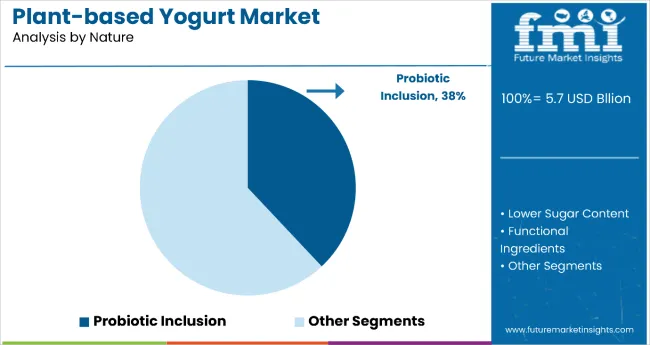
In terms of nature, the functional ingredients segment leads with 48% share.Based on sales channel, the retail segment captures 62% share. South Korea is the fastest-growing market with 13.2% CAGR. Innovation and accessibility are playing major roles in the expansion of the plant-based yogurt market. Advances in food technology have led to significant improvements in taste, texture, and nutritional content, making these products more appealing and comparable to dairy yogurt.

At the same time, increased availability in mainstream supermarkets, health food stores, and online platforms has made it easier for consumers to access these options. Companies are offering a wider range of flavors and formats, including drinkable yogurts and high-protein variants, catering to diverse consumer preferences and further fueling market growth.

Analyzing Plant-based Yogurt Market by Top Investment Segments

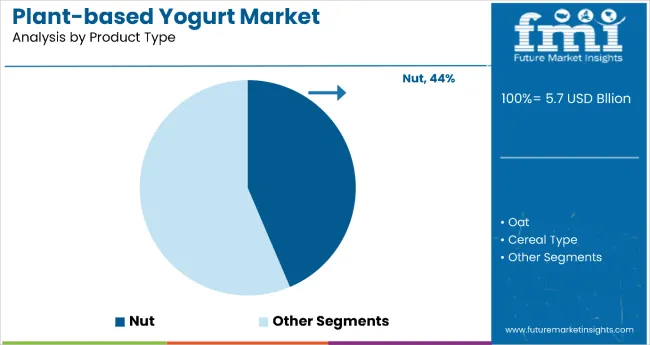
The market is divided by nature into segments such as probiotic inclusion, lower sugar content, and functional ingredients. By product type, the market includes cereal type, oat, legume, nut, seed, and pseudo cereal. In terms of flavor, the market is segmented into regular, vanilla, strawberry, blueberry, cherry, peach, raspberry, coconut, coffee, and others.

Based on the price range, the segmentation includes economic, mid-range, and premium. According to the sales channel, the market is categorized into food service, retail, modern trade, convenience stores, specialty stores, discounters, independent small groceries, e-commerce, and others. From a regional perspective, the market spans across North America, Latin America, East Asia, South Asia & Pacific, Eastern Europe, Western Europe, and Middle East & Africa.

By Nature, Functional Ingredients Dominate with 48% Share

The functional ingredients segment accounts for 48% share. Functional ingredient-based plant-based yogurts are in high demand because they offer added health benefits beyond basic nutrition, appealing to the growing number of wellness-focused consumers. Ingredients like probiotics, prebiotics, omega-3 fatty acids, plant proteins, and added vitamins or minerals enhance digestive health, immunity, and overall well-being.

  • As people increasingly seek foods that support gut health, boost energy, and aid in stress or weight management, these enriched yogurts align perfectly with their lifestyle goals.
  • The clean-label trend, favoring natural, recognizable ingredients, makes these functional products especially attractive, helping brands differentiate themselves in a competitive, health-driven market.

By Product Type, Legume Accounts for 36% Share

Soy-based yogurts (legume category) dominate the market, capturing 36% of global revenue. This leadership stems from soy’s high protein content, creamy texture, and cost-effective production. Consumers appreciate its nutritional parity with dairy, especially for gut health and muscle support.

  • Soy ingredients are widely available, and soy-based products are priced competitively compared to other plant alternatives, making them the preferred choice across diverse markets.
  • Many soy-based yogurts are fortified with calcium, B12, and vitamin D to closely match the nutritional profile of dairy yogurt, making them a more complete and appealing substitute for health-conscious or lactose-intolerant consumers.

By Flavor, Strawberry Dominates with 32% Share

Strawberry is the leading flavor in the plant-based yogurt market, accounting for the highest share of 32% among all flavor types. Its popularity is driven by its familiar, sweet-tart taste that appeals to both children and adults. Consumers often associate strawberry with freshness and health, especially because it naturally contains antioxidants and vitamin C.

  • The flavor also performs well in both spoonable and drinkable yogurt formats, making it a versatile choice for manufacturers.
  • Its vibrant color, recognizable taste, and compatibility with plant-based bases like almond, soy, and oat contribute to its strong market performance and consistent consumer preference.

By Price Range, Mid-range Leads with 52% Share

Mid-range plant-based yogurts are widely sold because they strike a balance between affordability and quality, making them accessible to a broad consumer base. Unlike premium products, which may be priced out of reach for many, mid-range options offer good taste, nutrition, and texture at a reasonable price.

These products often use familiar plant bases like soy, almond, or oat, and are available in popular flavors such as strawberry or vanilla, making them appealing to everyday buyers. Additionally, mid-range brands are widely distributed through supermarkets and online platforms, increasing visibility and convenience, which further drives their high sales volume. This segment holds 52% share.

In terms of Sales Channel, Retail Dominates with 62% Share

On the basis of sales channel, the retail segment accounts for 62% share. The retail segment leads the plant-based yogurt market due to its extensive reach and consumer preference for in-store shopping. Supermarkets and hypermarkets are the primary sales channels, accounting for approximately 63.5% of off-trade sales.

These large retail spaces offer a wide selection of plant-based yogurt brands and flavors, allowing consumers to compare products and make informed choices. The convenience of one-stop shopping, along with the ability to assess product freshness and quality firsthand, drives consumer loyalty and repeat purchases. Additionally, supermarkets often provide promotions and discounts, further incentivizing purchases. The physical presence of these stores ensures that plant-based yogurt is easily accessible to a broad customer base, maintaining its dominance in the market.

Challenges and Opportunities

Challenge

High Production Costs and Supply Chain Complexities

High production costs and the supply and demand imbalance are some of the limitations that the Plant-based yogurt market is dealing with. The prices of raw ingredients like almonds, coconuts, and oats are also increasing in cost with changing agricultural harvests and disruptions in supply chains.

Also, to approximate the taste and texture of dairy-based yogurt, plant-based ingredients must be processed using specialized equipment and advanced formulations. For improved profitability and affordability for the consumer, companies must invest in sustainable sourcing to increase revenue in manufacturing processes, and invest heavily in innovative and cost-effective new ingredient blending.

Regulatory Compliance and Labeling Standards

As befits the plant-based yogurt industry, it is highly regulated when it comes to listing of ingredients, nutritional claims and food safety. Dairy definition varies between countries, which is an important consideration for labeling and marketing strategies.

In addition, plant-based products must also adhere to stringent food safety and quality standards, thereby incurring higher compliance costs. These regulatory challenges call for companies to collaborate with regulators, invest in transparent laboratory practices, and work around local food safety laws.

Opportunity

Rising Consumer Demand for Dairy Alternatives

The shift to increasingly plant-based diets is creating a market for dairy-free yogurt products. Especially lactose-free, vegan products that contain a lot of probiotics. In addition to health consciousness, growing concerns over dairy allergies and ethical food choices is opening opportunities for manufacturers to focus on expanding their product offerings. Brands that introduce innovations with functional ingredients like protein fortification, probiotics, and added vitamins will appeal to a top of mind health-minded consumer base.

Expansion of Retail and Online Distribution Channels

Distribution channels have also diversified, with distribution of plant-based yogurt taking place through various e-commerce and retail channels across local and international marketplaces. Online grocery platforms, specialty health food stores and mainstream supermarkets are allotting more shelf space for plant-based dairy alternatives.

Moreover, direct-to-consumer sales models allow brands to expand their reach. The companies making rental solutions in different mediums, working through the digital marketing, influencer, and personalized customer segments will prevail in this new market.
Country-wise Analysis

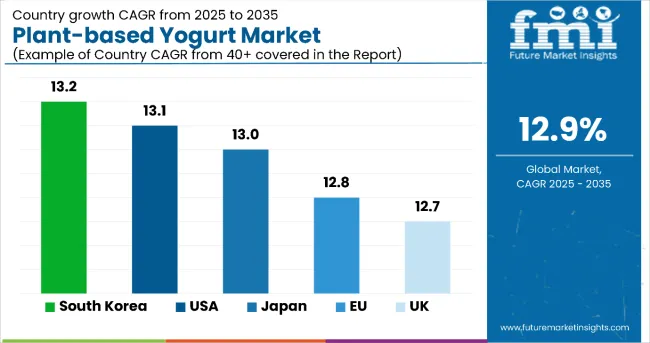
The plant-based yogurt market is expected to grow robustly across all these regions from 2025 to 2035, with South Korea leading slightly at a CAGR of 13.2%. The USA follows closely with a 13.1% growth rate, reflecting strong consumer demand and innovation.

Japan and the European Union show similarly strong growth at 13.0% and 12.8%, respectively, driven by increasing health awareness and plant-based diet adoption. The UK has a slightly lower but still impressive CAGR of 12.7%. Overall, these figures highlight rapid and relatively uniform expansion globally, with Asia-Pacific markets like South Korea and Japan marginally outpacing Western markets.

United States

Growth of this market in the United States is fueled by the rapidly increasing consumer preference for dairy alternatives and plant-based diets. This demand is supported by lactose intolerance, health awareness, and the increasing popularity of veganism. The increase in the number of products and brands in the free product ranges of supermarkets and health stores and its impact on the market growth

Key players are launching new and innovative flavors as well as fortified options to meet the changing tastes of consumers. Marketing campaigns that promote sustainability and ethical consumption affect purchasing decisions;

Country CAGR (2025 to 2035)
USA 13.1%

United Kingdom

Growth in the UK dairy alternatives sector is largely being driven by greater public awareness about the negative environmental impact of dairy farming as well as a healthier, more nutritional approach to eating among UK consumers. Demand for organic, non-GMO, and clean-label products is growing too.

In response to the trend, retailers and foodservice providers are embracing a wider variety of dairy-free yogurts. The market is also expanding due to governmental initiatives encouraging plant-based diets as well as sustainability objectives.

Country CAGR (2025 to 2035)
UK 12.7%

European Union

The plant-based yogurt market in the European Union is seeing a boom, led by Germany, France, and the Netherlands. Demand for dairy analogues based on plants is increasing, and regulations on the production and labeling of dairy products are strict, driving the growth of the market.

Supermarket chains introduce dedicated plant-based sections, which makes things more accessible too. And companies are responding with better formulations, including high-protein and probiotic-enriched varieties.

Region CAGR (2025 to 2035)
European Union (EU) 12.8%

Japan

Lactose intolerance is rising among Japanese people, and they are now increasingly interested in functional foods, fuelling the plant-based yogurt market in Japan. And traditional dietary habits are driving consumers to soy-based and rice-based yogurt substitute.

Accessibility has also improved with the availability of convenience stores and supermarkets offering plant-based products. Moreover, advancements in fermentation technology and sourcing local ingredients are creating opportunities for market growth. Various government initiatives for healthy aging and functional foods further support the market.

Country CAGR (2025 to 2035)
Japan 13.0%

South Korea

The report provides a comprehensive analysis of the South Korea plant-based yogurt market and its major drivers including rising inclination among consumer for plant-based as well as functional food. The country’s café culture has made dairy-free yogurt-based smoothies and desserts easy to find. Plant-based fermentation techniques and flavors especially almond and oat-based yogurts are also opening possibilities.

The increasing population of vegan and flexitarian people is also benefitting the market growth. In addition, demand is being driven by social media influence and celebrity endorsements.

Country CAGR (2025 to 2035)
South Korea 13.2%

Leading Plant-based Yogurt Companies

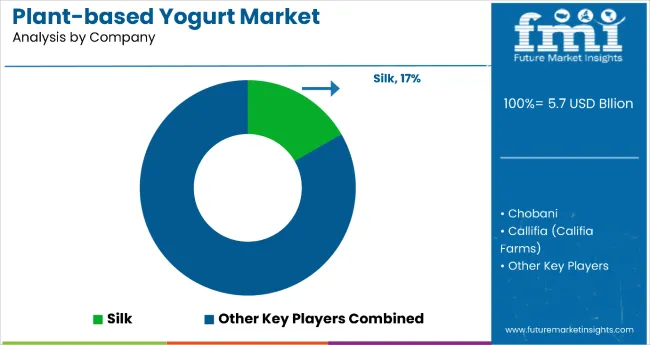
The plant-based yogurt market is moderately fragmented, with several key players driving innovation and growth. Companies like Chobani and Silk leverage strong brand recognition and wide distribution, while niche brands such as Kite Hill, Forager, and Good Karma focus on artisanal quality and specialized ingredients. Callifia and LAVVA emphasize clean-label and functional benefits, catering to health-conscious consumers.

Nancy’s and So Delicious offer a broad range of dairy-free options, enhancing market diversity. Good Plants targets environmentally sustainable production. This diverse competitive landscape reflects varying consumer preferences, preventing consolidation and fostering a dynamic market where both established giants and smaller innovators coexist and compete.

Key Players

  • The Coconut Collaborative - Specializing in coconut-based yogurts with probiotic benefits. The company has recently expanded its presence in North America, launching single-serve packs designed for on-the-go convenience.
  • Nancy’s Probiotic Foods - Developing organic, multi-strain probiotic plant-based yogurts. Nancy’s is also working on incorporating immune-boosting ingredients, such as turmeric and ginger, into its formulations.
  • Kite Hill - Known for its almond-based, Greek-style dairy-free yogurt alternatives. The company has introduced a new line of unsweetened yogurts aimed at the keto and diabetic consumer segments.
  • Ripple Foods - Innovating with pea-protein-based yogurt rich in omega-3s. Ripple is currently collaborating with nutritionists to develop high-protein plant-based yogurt designed for athletes and fitness enthusiasts.
  • So Delicious Dairy Free - A leader in coconut-milk yogurts with diverse flavor offerings. The company has also launched a limited-edition seasonal range featuring unique flavors such as pumpkin spice and match green tea.

Report Coverage for Global Plant-based Yogurt Market

Report Attributes Details
Current Total Market Size (2025) USD 5.7 billion
Projected Market Size (2035) USD 19.3 billion
CAGR (2025 to 2035) 12.9%
Base Year for Estimation 2024
Historical Period 2020 to 2024
Projections Period 2025 to 2035
Quantitative Units Revenue in USD billion, kilotons in volume
By Nature Probiotic Inclusion (38% share in 2025), Lower Sugar Content (27%), Functional Ingredients (21%)
By Product Type Oat (32%), Nut (24%), Legume (18%), Cereal Type (11%), Seed (9%), Pseudo Cereal (6%)
By Flavor Regular (28%), Vanilla (18%), Strawberry (14%), Blueberry (9%), Coconut (7%), Others (24%)
By Price Range Mid-Range (46%), Premium (35%), Economic (19%)
By Sales Channel Retail (62%), E-commerce (14%), Food Service (9%), Others (15%)
By Region North America, Latin America, East Asia, South Asia & Pacific, Eastern Europe, Western Europe, Middle East & Africa
Countries Covered USA, UK, Germany, Japan, South Korea
Key Players influencing the Plant-based Yogurt Market Danone S.A., Chobani LLC, Califia Farms, General Mills Inc., Forager Project
Additional Attributes Segment-wise Market Share, Country-wise CAGR, Product Development Trends
Customization and Pricing Available upon Request

Key Segmentation

By Nature:

  • Probiotic Inclusion
  • Lower Sugar Content
  • Functional Ingredients

By Product Type:

  • Cereal Type
  • Oat
  • Legume
  • Nut
  • Seed
  • Pseudo Cereal

By Flavor:

  • Regular
  • Vanilla
  • Strawberry
  • Blueberry
  • Cherry
  • Peach
  • Raspberry
  • Coconut
  • Coffee
  • Others

By Price Range:

  • Economic
  • Mid-Range
  • Premium

By Sales Channel:

  • Food Service
  • Retail
  • Modern Trade
  • Convenience Stores
  • Specialty Stores
  • Discounters
  • Independent Small Groceries
  • E-commerce
  • Others

By Region:

  • North America
  • Latin America
  • East Asia
  • South Asia & Pacific
  • Eastern Europe
  • Western Europe
  • Middle East & Africa

Table of Content

  1. Executive Summary
  2. Industry Introduction, including Taxonomy and Market Definition
  3. Market Trends and Success Factors, including Macro-economic Factors, Market Dynamics, and Recent Industry Developments
  4. Global Market Demand Analysis 2020 to 2024 and Forecast 2025 to 2035, including Historical Analysis and Future Projections
  5. Pricing Analysis
  6. Global Market Analysis 2020 to 2024 and Forecast 2025 to 2035
    • By Nature
    • By Product Type
    • By Flavor
    • By Price Range
    • By Sales Channel
  7. Global Market Analysis 2020 to 2024 and Forecast 2025 to 2035, By Nature
    • Probiotic Inclusion
    • Lower Sugar Content
    • Functional Ingredients
  8. Global Market Analysis 2020 to 2024 and Forecast 2025 to 2035, By Product Type
    • Cereal Type
    • Oat
    • Legume
    • Nut
    • Seed
    • Pseudo Cereal
  9. Global Market Analysis 2020 to 2024 and Forecast 2025 to 2035, By Flavor
    • Regular
    • Vanilla
    • Strawberry
    • Blueberry
    • Cherry
    • Peach
    • Raspberry
    • Coconut
    • Coffee
    • Others
  10. Global Market Analysis 2020 to 2024 and Forecast 2025 to 2035, By Price Range
    • Economic
    • Mid-Range
    • Premium
  11. Global Market Analysis 2020 to 2024 and Forecast 2025 to 2035, By Sales Channel
    • Food Service
    • Retail
    • Modern Trade
    • Convenience Stores
    • Specialty Stores
    • Discounters
    • Independent Small Groceries
    • E-commerce
    • Others
  12. Global Market Analysis 2020 to 2024 and Forecast 2025 to 2035, By Region
    • North America
    • Latin America
    • East Asia
    • South Asia & Pacific
    • Eastern Europe
    • Western Europe
    • Middle East & Africa
  13. North America Sales Analysis 2020 to 2024 and Forecast 2025 to 2035, by Key Segments and Countries
  14. Latin America Sales Analysis 2020 to 2024 and Forecast 2025 to 2035, by Key Segments and Countries
  15. East Asia Sales Analysis 2020 to 2024 and Forecast 2025 to 2035, by Key Segments and Countries
  16. South Asia & Pacific Sales Analysis 2020 to 2024 and Forecast 2025 to 2035, by Key Segments and Countries
  17. Eastern Europe Sales Analysis 2020 to 2024 and Forecast 2025 to 2035, by Key Segments and Countries
  18. Western Europe Sales Analysis 2020 to 2024 and Forecast 2025 to 2035, by Key Segments and Countries
  19. Middle East & Africa Sales Analysis 2020 to 2024 and Forecast 2025 to 2035, by Key Segments and Countries
  20. Sales Forecast 2025 to 2035 by By Nature, By Product Type, By Flavor, By Price Range, and By Sales Channel for 30 Countries
  21. Competition Outlook, including Market Structure Analysis, Company Share Analysis by Key Players, and Competition Dashboard
  22. Company Profile
    • Callifia
    • Chobani
    • Forager
    • Good Plants
    • Good Karma
    • Kite Hill
    • LAVVA
    • Nancy’s
    • Silk
    • So Delicious

List of Tables

  • Table 1: Global Market Value (USD Million) Forecast by Region, 2020 to 2035
  • Table 2: Global Market Volume (Tons) Forecast by Region, 2020 to 2035
  • Table 3: Global Market Value (USD Million) Forecast by Nature, 2020 to 2035
  • Table 4: Global Market Volume (Tons) Forecast by Nature, 2020 to 2035
  • Table 5: Global Market Value (USD Million) Forecast by Product Type, 2020 to 2035
  • Table 6: Global Market Volume (Tons) Forecast by Product Type, 2020 to 2035
  • Table 7: Global Market Value (USD Million) Forecast by Flavour, 2020 to 2035
  • Table 8: Global Market Volume (Tons) Forecast by Flavour, 2020 to 2035
  • Table 9: Global Market Value (USD Million) Forecast by Price Range, 2020 to 2035
  • Table 10: Global Market Volume (Tons) Forecast by Price Range, 2020 to 2035
  • Table 11: Global Market Value (USD Million) Forecast by Sales Channel, 2020 to 2035
  • Table 12: Global Market Volume (Tons) Forecast by Sales Channel, 2020 to 2035
  • Table 13: North America Market Value (USD Million) Forecast by Country, 2020 to 2035
  • Table 14: North America Market Volume (Tons) Forecast by Country, 2020 to 2035
  • Table 15: North America Market Value (USD Million) Forecast by Nature, 2020 to 2035
  • Table 16: North America Market Volume (Tons) Forecast by Nature, 2020 to 2035
  • Table 17: North America Market Value (USD Million) Forecast by Product Type, 2020 to 2035
  • Table 18: North America Market Volume (Tons) Forecast by Product Type, 2020 to 2035
  • Table 19: North America Market Value (USD Million) Forecast by Flavour, 2020 to 2035
  • Table 20: North America Market Volume (Tons) Forecast by Flavour, 2020 to 2035
  • Table 21: North America Market Value (USD Million) Forecast by Price Range, 2020 to 2035
  • Table 22: North America Market Volume (Tons) Forecast by Price Range, 2020 to 2035
  • Table 23: North America Market Value (USD Million) Forecast by Sales Channel, 2020 to 2035
  • Table 24: North America Market Volume (Tons) Forecast by Sales Channel, 2020 to 2035
  • Table 25: Latin America Market Value (USD Million) Forecast by Country, 2020 to 2035
  • Table 26: Latin America Market Volume (Tons) Forecast by Country, 2020 to 2035
  • Table 27: Latin America Market Value (USD Million) Forecast by Nature, 2020 to 2035
  • Table 28: Latin America Market Volume (Tons) Forecast by Nature, 2020 to 2035
  • Table 29: Latin America Market Value (USD Million) Forecast by Product Type, 2020 to 2035
  • Table 30: Latin America Market Volume (Tons) Forecast by Product Type, 2020 to 2035
  • Table 31: Latin America Market Value (USD Million) Forecast by Flavour, 2020 to 2035
  • Table 32: Latin America Market Volume (Tons) Forecast by Flavour, 2020 to 2035
  • Table 33: Latin America Market Value (USD Million) Forecast by Price Range, 2020 to 2035
  • Table 34: Latin America Market Volume (Tons) Forecast by Price Range, 2020 to 2035
  • Table 35: Latin America Market Value (USD Million) Forecast by Sales Channel, 2020 to 2035
  • Table 36: Latin America Market Volume (Tons) Forecast by Sales Channel, 2020 to 2035
  • Table 37: Western Europe Market Value (USD Million) Forecast by Country, 2020 to 2035
  • Table 38: Western Europe Market Volume (Tons) Forecast by Country, 2020 to 2035
  • Table 39: Western Europe Market Value (USD Million) Forecast by Nature, 2020 to 2035
  • Table 40: Western Europe Market Volume (Tons) Forecast by Nature, 2020 to 2035
  • Table 41: Western Europe Market Value (USD Million) Forecast by Product Type, 2020 to 2035
  • Table 42: Western Europe Market Volume (Tons) Forecast by Product Type, 2020 to 2035
  • Table 43: Western Europe Market Value (USD Million) Forecast by Flavour, 2020 to 2035
  • Table 44: Western Europe Market Volume (Tons) Forecast by Flavour, 2020 to 2035
  • Table 45: Western Europe Market Value (USD Million) Forecast by Price Range, 2020 to 2035
  • Table 46: Western Europe Market Volume (Tons) Forecast by Price Range, 2020 to 2035
  • Table 47: Western Europe Market Value (USD Million) Forecast by Sales Channel, 2020 to 2035
  • Table 48: Western Europe Market Volume (Tons) Forecast by Sales Channel, 2020 to 2035
  • Table 49: Eastern Europe Market Value (USD Million) Forecast by Country, 2020 to 2035
  • Table 50: Eastern Europe Market Volume (Tons) Forecast by Country, 2020 to 2035
  • Table 51: Eastern Europe Market Value (USD Million) Forecast by Nature, 2020 to 2035
  • Table 52: Eastern Europe Market Volume (Tons) Forecast by Nature, 2020 to 2035
  • Table 53: Eastern Europe Market Value (USD Million) Forecast by Product Type, 2020 to 2035
  • Table 54: Eastern Europe Market Volume (Tons) Forecast by Product Type, 2020 to 2035
  • Table 55: Eastern Europe Market Value (USD Million) Forecast by Flavour, 2020 to 2035
  • Table 56: Eastern Europe Market Volume (Tons) Forecast by Flavour, 2020 to 2035
  • Table 57: Eastern Europe Market Value (USD Million) Forecast by Price Range, 2020 to 2035
  • Table 58: Eastern Europe Market Volume (Tons) Forecast by Price Range, 2020 to 2035
  • Table 59: Eastern Europe Market Value (USD Million) Forecast by Sales Channel, 2020 to 2035
  • Table 60: Eastern Europe Market Volume (Tons) Forecast by Sales Channel, 2020 to 2035
  • Table 61: South Asia and Pacific Market Value (USD Million) Forecast by Country, 2020 to 2035
  • Table 62: South Asia and Pacific Market Volume (Tons) Forecast by Country, 2020 to 2035
  • Table 63: South Asia and Pacific Market Value (USD Million) Forecast by Nature, 2020 to 2035
  • Table 64: South Asia and Pacific Market Volume (Tons) Forecast by Nature, 2020 to 2035
  • Table 65: South Asia and Pacific Market Value (USD Million) Forecast by Product Type, 2020 to 2035
  • Table 66: South Asia and Pacific Market Volume (Tons) Forecast by Product Type, 2020 to 2035
  • Table 67: South Asia and Pacific Market Value (USD Million) Forecast by Flavour, 2020 to 2035
  • Table 68: South Asia and Pacific Market Volume (Tons) Forecast by Flavour, 2020 to 2035
  • Table 69: South Asia and Pacific Market Value (USD Million) Forecast by Price Range, 2020 to 2035
  • Table 70: South Asia and Pacific Market Volume (Tons) Forecast by Price Range, 2020 to 2035
  • Table 71: South Asia and Pacific Market Value (USD Million) Forecast by Sales Channel, 2020 to 2035
  • Table 72: South Asia and Pacific Market Volume (Tons) Forecast by Sales Channel, 2020 to 2035
  • Table 73: East Asia Market Value (USD Million) Forecast by Country, 2020 to 2035
  • Table 74: East Asia Market Volume (Tons) Forecast by Country, 2020 to 2035
  • Table 75: East Asia Market Value (USD Million) Forecast by Nature, 2020 to 2035
  • Table 76: East Asia Market Volume (Tons) Forecast by Nature, 2020 to 2035
  • Table 77: East Asia Market Value (USD Million) Forecast by Product Type, 2020 to 2035
  • Table 78: East Asia Market Volume (Tons) Forecast by Product Type, 2020 to 2035
  • Table 79: East Asia Market Value (USD Million) Forecast by Flavour, 2020 to 2035
  • Table 80: East Asia Market Volume (Tons) Forecast by Flavour, 2020 to 2035
  • Table 81: East Asia Market Value (USD Million) Forecast by Price Range, 2020 to 2035
  • Table 82: East Asia Market Volume (Tons) Forecast by Price Range, 2020 to 2035

List of Figures

  • Figure 1: Global Market Value (USD Million) by Nature, 2025 to 2035
  • Figure 2: Global Market Value (USD Million) by Product Type, 2025 to 2035
  • Figure 3: Global Market Value (USD Million) by Flavour, 2025 to 2035
  • Figure 4: Global Market Value (USD Million) by Price Range, 2025 to 2035
  • Figure 5: Global Market Value (USD Million) by Sales Channel, 2025 to 2035
  • Figure 6: Global Market Value (USD Million) by Region, 2025 to 2035
  • Figure 7: Global Market Value (USD Million) Analysis by Region, 2020 to 2035
  • Figure 8: Global Market Volume (Tons) Analysis by Region, 2020 to 2035
  • Figure 9: Global Market Value Share (%) and BPS Analysis by Region, 2025 to 2035
  • Figure 10: Global Market Y-o-Y Growth (%) Projections by Region, 2025 to 2035
  • Figure 11: Global Market Value (USD Million) Analysis by Nature, 2020 to 2035
  • Figure 12: Global Market Volume (Tons) Analysis by Nature, 2020 to 2035
  • Figure 13: Global Market Value Share (%) and BPS Analysis by Nature, 2025 to 2035
  • Figure 14: Global Market Y-o-Y Growth (%) Projections by Nature, 2025 to 2035
  • Figure 15: Global Market Value (USD Million) Analysis by Product Type, 2020 to 2035
  • Figure 16: Global Market Volume (Tons) Analysis by Product Type, 2020 to 2035
  • Figure 17: Global Market Value Share (%) and BPS Analysis by Product Type, 2025 to 2035
  • Figure 18: Global Market Y-o-Y Growth (%) Projections by Product Type, 2025 to 2035
  • Figure 19: Global Market Value (USD Million) Analysis by Flavour, 2020 to 2035
  • Figure 20: Global Market Volume (Tons) Analysis by Flavour, 2020 to 2035
  • Figure 21: Global Market Value Share (%) and BPS Analysis by Flavour, 2025 to 2035
  • Figure 22: Global Market Y-o-Y Growth (%) Projections by Flavour, 2025 to 2035
  • Figure 23: Global Market Value (USD Million) Analysis by Price Range, 2020 to 2035
  • Figure 24: Global Market Volume (Tons) Analysis by Price Range, 2020 to 2035
  • Figure 25: Global Market Value Share (%) and BPS Analysis by Price Range, 2025 to 2035
  • Figure 26: Global Market Y-o-Y Growth (%) Projections by Price Range, 2025 to 2035
  • Figure 27: Global Market Value (USD Million) Analysis by Sales Channel, 2020 to 2035
  • Figure 28: Global Market Volume (Tons) Analysis by Sales Channel, 2020 to 2035
  • Figure 29: Global Market Value Share (%) and BPS Analysis by Sales Channel, 2025 to 2035
  • Figure 30: Global Market Y-o-Y Growth (%) Projections by Sales Channel, 2025 to 2035
  • Figure 31: Global Market Attractiveness by Nature, 2025 to 2035
  • Figure 32: Global Market Attractiveness by Product Type, 2025 to 2035
  • Figure 33: Global Market Attractiveness by Flavour, 2025 to 2035
  • Figure 34: Global Market Attractiveness by Price Range, 2025 to 2035
  • Figure 35: Global Market Attractiveness by Sales Channel, 2025 to 2035
  • Figure 36: Global Market Attractiveness by Region, 2025 to 2035
  • Figure 37: North America Market Value (USD Million) by Nature, 2025 to 2035
  • Figure 38: North America Market Value (USD Million) by Product Type, 2025 to 2035
  • Figure 39: North America Market Value (USD Million) by Flavour, 2025 to 2035
  • Figure 40: North America Market Value (USD Million) by Price Range, 2025 to 2035
  • Figure 41: North America Market Value (USD Million) by Sales Channel, 2025 to 2035
  • Figure 42: North America Market Value (USD Million) by Country, 2025 to 2035
  • Figure 43: North America Market Value (USD Million) Analysis by Country, 2020 to 2035
  • Figure 44: North America Market Volume (Tons) Analysis by Country, 2020 to 2035
  • Figure 45: North America Market Value Share (%) and BPS Analysis by Country, 2025 to 2035
  • Figure 46: North America Market Y-o-Y Growth (%) Projections by Country, 2025 to 2035
  • Figure 47: North America Market Value (USD Million) Analysis by Nature, 2020 to 2035
  • Figure 48: North America Market Volume (Tons) Analysis by Nature, 2020 to 2035
  • Figure 49: North America Market Value Share (%) and BPS Analysis by Nature, 2025 to 2035
  • Figure 50: North America Market Y-o-Y Growth (%) Projections by Nature, 2025 to 2035
  • Figure 51: North America Market Value (USD Million) Analysis by Product Type, 2020 to 2035
  • Figure 52: North America Market Volume (Tons) Analysis by Product Type, 2020 to 2035
  • Figure 53: North America Market Value Share (%) and BPS Analysis by Product Type, 2025 to 2035
  • Figure 54: North America Market Y-o-Y Growth (%) Projections by Product Type, 2025 to 2035
  • Figure 55: North America Market Value (USD Million) Analysis by Flavour, 2020 to 2035
  • Figure 56: North America Market Volume (Tons) Analysis by Flavour, 2020 to 2035
  • Figure 57: North America Market Value Share (%) and BPS Analysis by Flavour, 2025 to 2035
  • Figure 58: North America Market Y-o-Y Growth (%) Projections by Flavour, 2025 to 2035
  • Figure 59: North America Market Value (USD Million) Analysis by Price Range, 2020 to 2035
  • Figure 60: North America Market Volume (Tons) Analysis by Price Range, 2020 to 2035
  • Figure 61: North America Market Value Share (%) and BPS Analysis by Price Range, 2025 to 2035
  • Figure 62: North America Market Y-o-Y Growth (%) Projections by Price Range, 2025 to 2035
  • Figure 63: North America Market Value (USD Million) Analysis by Sales Channel, 2020 to 2035
  • Figure 64: North America Market Volume (Tons) Analysis by Sales Channel, 2020 to 2035
  • Figure 65: North America Market Value Share (%) and BPS Analysis by Sales Channel, 2025 to 2035
  • Figure 66: North America Market Y-o-Y Growth (%) Projections by Sales Channel, 2025 to 2035
  • Figure 67: North America Market Attractiveness by Nature, 2025 to 2035
  • Figure 68: North America Market Attractiveness by Product Type, 2025 to 2035
  • Figure 69: North America Market Attractiveness by Flavour, 2025 to 2035
  • Figure 70: North America Market Attractiveness by Price Range, 2025 to 2035
  • Figure 71: North America Market Attractiveness by Sales Channel, 2025 to 2035
  • Figure 72: North America Market Attractiveness by Country, 2025 to 2035
  • Figure 73: Latin America Market Value (USD Million) by Nature, 2025 to 2035
  • Figure 74: Latin America Market Value (USD Million) by Product Type, 2025 to 2035
  • Figure 75: Latin America Market Value (USD Million) by Flavour, 2025 to 2035
  • Figure 76: Latin America Market Value (USD Million) by Price Range, 2025 to 2035
  • Figure 77: Latin America Market Value (USD Million) by Sales Channel, 2025 to 2035
  • Figure 78: Latin America Market Value (USD Million) by Country, 2025 to 2035
  • Figure 79: Latin America Market Value (USD Million) Analysis by Country, 2020 to 2035
  • Figure 80: Latin America Market Volume (Tons) Analysis by Country, 2020 to 2035
  • Figure 81: Latin America Market Value Share (%) and BPS Analysis by Country, 2025 to 2035
  • Figure 82: Latin America Market Y-o-Y Growth (%) Projections by Country, 2025 to 2035
  • Figure 83: Latin America Market Value (USD Million) Analysis by Nature, 2020 to 2035
  • Figure 84: Latin America Market Volume (Tons) Analysis by Nature, 2020 to 2035
  • Figure 85: Latin America Market Value Share (%) and BPS Analysis by Nature, 2025 to 2035
  • Figure 86: Latin America Market Y-o-Y Growth (%) Projections by Nature, 2025 to 2035
  • Figure 87: Latin America Market Value (USD Million) Analysis by Product Type, 2020 to 2035
  • Figure 88: Latin America Market Volume (Tons) Analysis by Product Type, 2020 to 2035
  • Figure 89: Latin America Market Value Share (%) and BPS Analysis by Product Type, 2025 to 2035
  • Figure 90: Latin America Market Y-o-Y Growth (%) Projections by Product Type, 2025 to 2035
  • Figure 91: Latin America Market Value (USD Million) Analysis by Flavour, 2020 to 2035
  • Figure 92: Latin America Market Volume (Tons) Analysis by Flavour, 2020 to 2035
  • Figure 93: Latin America Market Value Share (%) and BPS Analysis by Flavour, 2025 to 2035
  • Figure 94: Latin America Market Y-o-Y Growth (%) Projections by Flavour, 2025 to 2035
  • Figure 95: Latin America Market Value (USD Million) Analysis by Price Range, 2020 to 2035
  • Figure 96: Latin America Market Volume (Tons) Analysis by Price Range, 2020 to 2035
  • Figure 97: Latin America Market Value Share (%) and BPS Analysis by Price Range, 2025 to 2035
  • Figure 98: Latin America Market Y-o-Y Growth (%) Projections by Price Range, 2025 to 2035
  • Figure 99: Latin America Market Value (USD Million) Analysis by Sales Channel, 2020 to 2035
  • Figure 100: Latin America Market Volume (Tons) Analysis by Sales Channel, 2020 to 2035
  • Figure 101: Latin America Market Value Share (%) and BPS Analysis by Sales Channel, 2025 to 2035
  • Figure 102: Latin America Market Y-o-Y Growth (%) Projections by Sales Channel, 2025 to 2035
  • Figure 103: Latin America Market Attractiveness by Nature, 2025 to 2035
  • Figure 104: Latin America Market Attractiveness by Product Type, 2025 to 2035
  • Figure 105: Latin America Market Attractiveness by Flavour, 2025 to 2035
  • Figure 106: Latin America Market Attractiveness by Price Range, 2025 to 2035
  • Figure 107: Latin America Market Attractiveness by Sales Channel, 2025 to 2035
  • Figure 108: Latin America Market Attractiveness by Country, 2025 to 2035
  • Figure 109: Western Europe Market Value (USD Million) by Nature, 2025 to 2035
  • Figure 110: Western Europe Market Value (USD Million) by Product Type, 2025 to 2035
  • Figure 111: Western Europe Market Value (USD Million) by Flavour, 2025 to 2035
  • Figure 112: Western Europe Market Value (USD Million) by Price Range, 2025 to 2035
  • Figure 113: Western Europe Market Value (USD Million) by Sales Channel, 2025 to 2035
  • Figure 114: Western Europe Market Value (USD Million) by Country, 2025 to 2035
  • Figure 115: Western Europe Market Value (USD Million) Analysis by Country, 2020 to 2035
  • Figure 116: Western Europe Market Volume (Tons) Analysis by Country, 2020 to 2035
  • Figure 117: Western Europe Market Value Share (%) and BPS Analysis by Country, 2025 to 2035
  • Figure 118: Western Europe Market Y-o-Y Growth (%) Projections by Country, 2025 to 2035
  • Figure 119: Western Europe Market Value (USD Million) Analysis by Nature, 2020 to 2035
  • Figure 120: Western Europe Market Volume (Tons) Analysis by Nature, 2020 to 2035
  • Figure 121: Western Europe Market Value Share (%) and BPS Analysis by Nature, 2025 to 2035
  • Figure 122: Western Europe Market Y-o-Y Growth (%) Projections by Nature, 2025 to 2035
  • Figure 123: Western Europe Market Value (USD Million) Analysis by Product Type, 2020 to 2035
  • Figure 124: Western Europe Market Volume (Tons) Analysis by Product Type, 2020 to 2035
  • Figure 125: Western Europe Market Value Share (%) and BPS Analysis by Product Type, 2025 to 2035
  • Figure 126: Western Europe Market Y-o-Y Growth (%) Projections by Product Type, 2025 to 2035
  • Figure 127: Western Europe Market Value (USD Million) Analysis by Flavour, 2020 to 2035
  • Figure 128: Western Europe Market Volume (Tons) Analysis by Flavour, 2020 to 2035
  • Figure 129: Western Europe Market Value Share (%) and BPS Analysis by Flavour, 2025 to 2035
  • Figure 130: Western Europe Market Y-o-Y Growth (%) Projections by Flavour, 2025 to 2035
  • Figure 131: Western Europe Market Value (USD Million) Analysis by Price Range, 2020 to 2035
  • Figure 132: Western Europe Market Volume (Tons) Analysis by Price Range, 2020 to 2035
  • Figure 133: Western Europe Market Value Share (%) and BPS Analysis by Price Range, 2025 to 2035
  • Figure 134: Western Europe Market Y-o-Y Growth (%) Projections by Price Range, 2025 to 2035
  • Figure 135: Western Europe Market Value (USD Million) Analysis by Sales Channel, 2020 to 2035
  • Figure 136: Western Europe Market Volume (Tons) Analysis by Sales Channel, 2020 to 2035
  • Figure 137: Western Europe Market Value Share (%) and BPS Analysis by Sales Channel, 2025 to 2035
  • Figure 138: Western Europe Market Y-o-Y Growth (%) Projections by Sales Channel, 2025 to 2035
  • Figure 139: Western Europe Market Attractiveness by Nature, 2025 to 2035
  • Figure 140: Western Europe Market Attractiveness by Product Type, 2025 to 2035
  • Figure 141: Western Europe Market Attractiveness by Flavour, 2025 to 2035
  • Figure 142: Western Europe Market Attractiveness by Price Range, 2025 to 2035
  • Figure 143: Western Europe Market Attractiveness by Sales Channel, 2025 to 2035
  • Figure 144: Western Europe Market Attractiveness by Country, 2025 to 2035
  • Figure 145: Eastern Europe Market Value (USD Million) by Nature, 2025 to 2035
  • Figure 146: Eastern Europe Market Value (USD Million) by Product Type, 2025 to 2035
  • Figure 147: Eastern Europe Market Value (USD Million) by Flavour, 2025 to 2035
  • Figure 148: Eastern Europe Market Value (USD Million) by Price Range, 2025 to 2035
  • Figure 149: Eastern Europe Market Value (USD Million) by Sales Channel, 2025 to 2035
  • Figure 150: Eastern Europe Market Value (USD Million) by Country, 2025 to 2035
  • Figure 151: Eastern Europe Market Value (USD Million) Analysis by Country, 2020 to 2035
  • Figure 152: Eastern Europe Market Volume (Tons) Analysis by Country, 2020 to 2035
  • Figure 153: Eastern Europe Market Value Share (%) and BPS Analysis by Country, 2025 to 2035
  • Figure 154: Eastern Europe Market Y-o-Y Growth (%) Projections by Country, 2025 to 2035
  • Figure 155: Eastern Europe Market Value (USD Million) Analysis by Nature, 2020 to 2035
  • Figure 156: Eastern Europe Market Volume (Tons) Analysis by Nature, 2020 to 2035
  • Figure 157: Eastern Europe Market Value Share (%) and BPS Analysis by Nature, 2025 to 2035
  • Figure 158: Eastern Europe Market Y-o-Y Growth (%) Projections by Nature, 2025 to 2035
  • Figure 159: Eastern Europe Market Value (USD Million) Analysis by Product Type, 2020 to 2035
  • Figure 160: Eastern Europe Market Volume (Tons) Analysis by Product Type, 2020 to 2035
  • Figure 161: Eastern Europe Market Value Share (%) and BPS Analysis by Product Type, 2025 to 2035
  • Figure 162: Eastern Europe Market Y-o-Y Growth (%) Projections by Product Type, 2025 to 2035
  • Figure 163: Eastern Europe Market Value (USD Million) Analysis by Flavour, 2020 to 2035
  • Figure 164: Eastern Europe Market Volume (Tons) Analysis by Flavour, 2020 to 2035
  • Figure 165: Eastern Europe Market Value Share (%) and BPS Analysis by Flavour, 2025 to 2035
  • Figure 166: Eastern Europe Market Y-o-Y Growth (%) Projections by Flavour, 2025 to 2035
  • Figure 167: Eastern Europe Market Value (USD Million) Analysis by Price Range, 2020 to 2035
  • Figure 168: Eastern Europe Market Volume (Tons) Analysis by Price Range, 2020 to 2035
  • Figure 169: Eastern Europe Market Value Share (%) and BPS Analysis by Price Range, 2025 to 2035
  • Figure 170: Eastern Europe Market Y-o-Y Growth (%) Projections by Price Range, 2025 to 2035
  • Figure 171: Eastern Europe Market Value (USD Million) Analysis by Sales Channel, 2020 to 2035
  • Figure 172: Eastern Europe Market Volume (Tons) Analysis by Sales Channel, 2020 to 2035
  • Figure 173: Eastern Europe Market Value Share (%) and BPS Analysis by Sales Channel, 2025 to 2035
  • Figure 174: Eastern Europe Market Y-o-Y Growth (%) Projections by Sales Channel, 2025 to 2035
  • Figure 175: Eastern Europe Market Attractiveness by Nature, 2025 to 2035
  • Figure 176: Eastern Europe Market Attractiveness by Product Type, 2025 to 2035
  • Figure 177: Eastern Europe Market Attractiveness by Flavour, 2025 to 2035
  • Figure 178: Eastern Europe Market Attractiveness by Price Range, 2025 to 2035
  • Figure 179: Eastern Europe Market Attractiveness by Sales Channel, 2025 to 2035
  • Figure 180: Eastern Europe Market Attractiveness by Country, 2025 to 2035
  • Figure 181: South Asia and Pacific Market Value (USD Million) by Nature, 2025 to 2035
  • Figure 182: South Asia and Pacific Market Value (USD Million) by Product Type, 2025 to 2035
  • Figure 183: South Asia and Pacific Market Value (USD Million) by Flavour, 2025 to 2035
  • Figure 184: South Asia and Pacific Market Value (USD Million) by Price Range, 2025 to 2035
  • Figure 185: South Asia and Pacific Market Value (USD Million) by Sales Channel, 2025 to 2035
  • Figure 186: South Asia and Pacific Market Value (USD Million) by Country, 2025 to 2035
  • Figure 187: South Asia and Pacific Market Value (USD Million) Analysis by Country, 2020 to 2035
  • Figure 188: South Asia and Pacific Market Volume (Tons) Analysis by Country, 2020 to 2035
  • Figure 189: South Asia and Pacific Market Value Share (%) and BPS Analysis by Country, 2025 to 2035
  • Figure 190: South Asia and Pacific Market Y-o-Y Growth (%) Projections by Country, 2025 to 2035
  • Figure 191: South Asia and Pacific Market Value (USD Million) Analysis by Nature, 2020 to 2035
  • Figure 192: South Asia and Pacific Market Volume (Tons) Analysis by Nature, 2020 to 2035
  • Figure 193: South Asia and Pacific Market Value Share (%) and BPS Analysis by Nature, 2025 to 2035
  • Figure 194: South Asia and Pacific Market Y-o-Y Growth (%) Projections by Nature, 2025 to 2035
  • Figure 195: South Asia and Pacific Market Value (USD Million) Analysis by Product Type, 2020 to 2035
  • Figure 196: South Asia and Pacific Market Volume (Tons) Analysis by Product Type, 2020 to 2035
  • Figure 197: South Asia and Pacific Market Value Share (%) and BPS Analysis by Product Type, 2025 to 2035
  • Figure 198: South Asia and Pacific Market Y-o-Y Growth (%) Projections by Product Type, 2025 to 2035
  • Figure 199: South Asia and Pacific Market Value (USD Million) Analysis by Flavour, 2020 to 2035
  • Figure 200: South Asia and Pacific Market Volume (Tons) Analysis by Flavour, 2020 to 2035
  • Figure 201: South Asia and Pacific Market Value Share (%) and BPS Analysis by Flavour, 2025 to 2035
  • Figure 202: South Asia and Pacific Market Y-o-Y Growth (%) Projections by Flavour, 2025 to 2035
  • Figure 203: South Asia and Pacific Market Value (USD Million) Analysis by Price Range, 2020 to 2035
  • Figure 204: South Asia and Pacific Market Volume (Tons) Analysis by Price Range, 2020 to 2035
  • Figure 205: South Asia and Pacific Market Value Share (%) and BPS Analysis by Price Range, 2025 to 2035
  • Figure 206: South Asia and Pacific Market Y-o-Y Growth (%) Projections by Price Range, 2025 to 2035
  • Figure 207: South Asia and Pacific Market Value (USD Million) Analysis by Sales Channel, 2020 to 2035
  • Figure 208: South Asia and Pacific Market Volume (Tons) Analysis by Sales Channel, 2020 to 2035
  • Figure 209: South Asia and Pacific Market Value Share (%) and BPS Analysis by Sales Channel, 2025 to 2035
  • Figure 210: South Asia and Pacific Market Y-o-Y Growth (%) Projections by Sales Channel, 2025 to 2035
  • Figure 211: South Asia and Pacific Market Attractiveness by Nature, 2025 to 2035
  • Figure 212: South Asia and Pacific Market Attractiveness by Product Type, 2025 to 2035
  • Figure 213: South Asia and Pacific Market Attractiveness by Flavour, 2025 to 2035
  • Figure 214: South Asia and Pacific Market Attractiveness by Price Range, 2025 to 2035
  • Figure 215: South Asia and Pacific Market Attractiveness by Sales Channel, 2025 to 2035
  • Figure 216: South Asia and Pacific Market Attractiveness by Country, 2025 to 2035
  • Figure 217: East Asia Market Value (USD Million) by Nature, 2025 to 2035
  • Figure 218: East Asia Market Value (USD Million) by Product Type, 2025 to 2035
  • Figure 219: East Asia Market Value (USD Million) by Flavour, 2025 to 2035
  • Figure 220: East Asia Market Value (USD Million) by Price Range, 2025 to 2035
  • Figure 221: East Asia Market Value (USD Million) by Sales Channel, 2025 to 2035
  • Figure 222: East Asia Market Value (USD Million) by Country, 2025 to 2035
  • Figure 223: East Asia Market Value (USD Million) Analysis by Country, 2020 to 2035
  • Figure 224: East Asia Market Volume (Tons) Analysis by Country, 2020 to 2035
  • Figure 225: East Asia Market Value Share (%) and BPS Analysis by Country, 2025 to 2035
  • Figure 226: East Asia Market Y-o-Y Growth (%) Projections by Country, 2025 to 2035
  • Figure 227: East Asia Market Value (USD Million) Analysis by Nature, 2020 to 2035
  • Figure 228: East Asia Market Volume (Tons) Analysis by Nature, 2020 to 2035
  • Figure 229: East Asia Market Value Share (%) and BPS Analysis by Nature, 2025 to 2035
  • Figure 230: East Asia Market Y-o-Y Growth (%) Projections by Nature, 2025 to 2035
  • Figure 231: East Asia Market Value (USD Million) Analysis by Product Type, 2020 to 2035
  • Figure 232: East Asia Market Volume (Tons) Analysis by Product Type, 2020 to 2035
  • Figure 233: East Asia Market Value Share (%) and BPS Analysis by Product Type, 2025 to 2035
  • Figure 234: East Asia Market Y-o-Y Growth (%) Projections by Product Type, 2025 to 2035
  • Figure 235: East Asia Market Value (USD Million) Analysis by Flavour, 2020 to 2035
  • Figure 236: East Asia Market Volume (Tons) Analysis by Flavour, 2020 to 2035
  • Figure 237: East Asia Market Value Share (%) and BPS Analysis by Flavour, 2025 to 2035
  • Figure 238: East Asia Market Y-o-Y Growth (%) Projections by Flavour, 2025 to 2035
  • Figure 239: East Asia Market Value (USD Million) Analysis by Price Range, 2020 to 2035
  • Figure 240: East Asia Market Volume (Tons) Analysis by Price Range, 2020 to 2035
  • Figure 241: East Asia Market Value Share (%) and BPS Analysis by Price Range, 2025 to 2035
  • Figure 242: East Asia Market Y-o-Y Growth (%) Projections by Price Range, 2025 to 2035
  • Figure 243: East Asia Market Value (USD Million) Analysis by Sales Channel, 2020 to 2035
  • Figure 244: East Asia Market Volume (Tons) Analysis by Sales Channel, 2020 to 2035
  • Figure 245: East Asia Market Value Share (%) and BPS Analysis by Sales Channel, 2025 to 2035
  • Figure 246: East Asia Market Y-o-Y Growth (%) Projections by Sales Channel, 2025 to 2035
  • Figure 247: East Asia Market Attractiveness by Nature, 2025 to 2035
  • Figure 248: East Asia Market Attractiveness by Product Type, 2025 to 2035
  • Figure 249: East Asia Market Attractiveness by Flavour, 2025 to 2035
  • Figure 250: East Asia Market Attractiveness by Price Range, 2025 to 2035
  • Figure 251: East Asia Market Attractiveness by Sales Channel, 2025 to 2035
  • Figure 252: East Asia Market Attractiveness by Country, 2025 to 2035
  • Figure 253: Middle East and Africa Market Value (USD Million) by Nature, 2025 to 2035
  • Figure 254: Middle East and Africa Market Value (USD Million) by Product Type, 2025 to 2035
  • Figure 255: Middle East and Africa Market Value (USD Million) by Flavour, 2025 to 2035
  • Figure 256: Middle East and Africa Market Value (USD Million) by Price Range, 2025 to 2035
  • Figure 257: Middle East and Africa Market Value (USD Million) by Sales Channel, 2025 to 2035
  • Figure 258: Middle East and Africa Market Value (USD Million) by Country, 2025 to 2035
  • Figure 259: Middle East and Africa Market Value (USD Million) Analysis by Country, 2020 to 2035
  • Figure 260: Middle East and Africa Market Volume (Tons) Analysis by Country, 2020 to 2035
  • Figure 261: Middle East and Africa Market Value Share (%) and BPS Analysis by Country, 2025 to 2035
  • Figure 262: Middle East and Africa Market Y-o-Y Growth (%) Projections by Country, 2025 to 2035
  • Figure 263: Middle East and Africa Market Value (USD Million) Analysis by Nature, 2020 to 2035
  • Figure 264: Middle East and Africa Market Volume (Tons) Analysis by Nature, 2020 to 2035
  • Figure 265: Middle East and Africa Market Value Share (%) and BPS Analysis by Nature, 2025 to 2035
  • Figure 266: Middle East and Africa Market Y-o-Y Growth (%) Projections by Nature, 2025 to 2035
  • Figure 267: Middle East and Africa Market Value (USD Million) Analysis by Product Type, 2020 to 2035
  • Figure 268: Middle East and Africa Market Volume (Tons) Analysis by Product Type, 2020 to 2035
  • Figure 269: Middle East and Africa Market Value Share (%) and BPS Analysis by Product Type, 2025 to 2035
  • Figure 270: Middle East and Africa Market Y-o-Y Growth (%) Projections by Product Type, 2025 to 2035
  • Figure 271: Middle East and Africa Market Value (USD Million) Analysis by Flavour, 2020 to 2035
  • Figure 272: Middle East and Africa Market Volume (Tons) Analysis by Flavour, 2020 to 2035
  • Figure 273: Middle East and Africa Market Value Share (%) and BPS Analysis by Flavour, 2025 to 2035
  • Figure 274: Middle East and Africa Market Y-o-Y Growth (%) Projections by Flavour, 2025 to 2035
  • Figure 275: Middle East and Africa Market Value (USD Million) Analysis by Price Range, 2020 to 2035
  • Figure 276: Middle East and Africa Market Volume (Tons) Analysis by Price Range, 2020 to 2035
  • Figure 277: Middle East and Africa Market Value Share (%) and BPS Analysis by Price Range, 2025 to 2035
  • Figure 278: Middle East and Africa Market Y-o-Y Growth (%) Projections by Price Range, 2025 to 2035
  • Figure 279: Middle East and Africa Market Value (USD Million) Analysis by Sales Channel, 2020 to 2035
  • Figure 280: Middle East and Africa Market Volume (Tons) Analysis by Sales Channel, 2020 to 2035
  • Figure 281: Middle East and Africa Market Value Share (%) and BPS Analysis by Sales Channel, 2025 to 2035
  • Figure 282: Middle East and Africa Market Y-o-Y Growth (%) Projections by Sales Channel, 2025 to 2035
  • Figure 283: Middle East and Africa Market Attractiveness by Nature, 2025 to 2035
  • Figure 284: Middle East and Africa Market Attractiveness by Product Type, 2025 to 2035
  • Figure 285: Middle East and Africa Market Attractiveness by Flavour, 2025 to 2035
  • Figure 286: Middle East and Africa Market Attractiveness by Price Range, 2025 to 2035
  • Figure 287: Middle East and Africa Market Attractiveness by Sales Channel, 2025 to 2035
  • Figure 288: Middle East and Africa Market Attractiveness by Country, 2025 to 2035

Frequently Asked Questions

What was the overall size of the plant-based yogurt market in 2025?

The overall market size for plant-based yogurt market was USD 5.7 billion in 2025.

How big the plant-based yogurt market is expected in 2035?

The plant-based yogurt market expected to reach USD 19.3 billion in 2035.

What will drive the demand for plant-based yogurt market during the forecast period?

What will drive the demand for plant-based yogurt market during the forecast period?

List the top 5 countries contributing plant-based yogurt market?

The top 5 countries which drives the development of plant-based yogurt market are USA, UK, Europe Union, Japan and South Korea.

Which segment in type is expected to plant-based yogurt market?

Conventional plant-based yogurt driving market growth to command significant share over the assessment period.

Explore Similar Insights

Future Market Insights

Plant-based Yogurt Market