Frozen Yogurt Market Outlook from 2024 to 2034

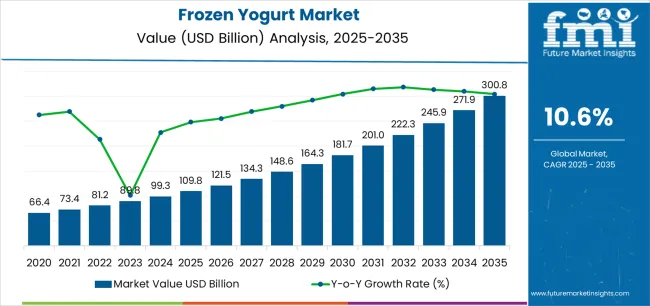
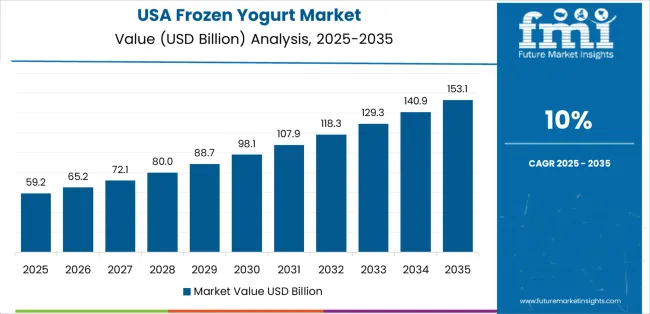
After a detailed analysis of the food and plant-based preservative market, FMI recently published a new report on the frozen yogurt market. As per the analysis, sales of frozen yogurt hold a current valuation of USD 99.29 billion in 2024.

Reflecting on consumers’ expectations, frozen yogurt producers work on simpler labels with understandable ingredients, reinforcing continuous demand. Going by this pattern, demand could rise and equate to a market valuation of USD 272.74 billion, with a CAGR of 10.6% by 2034.

Attributes Details
Frozen yogurt Market Value for 2024 USD 99.29 billion
Frozen yogurt Market Value for 2034 USD 272.74 billion
Frozen yogurt Market Forecast CAGR for 2024 to 2034 10.6%

Historical Performance and Future Growth of the Frozen Yogurt Market

In 2019, the global frozen yogurt market was estimated to reach a valuation of USD 60.36 billion, according to a report from Future Market Insights (FMI). The frozen yogurt market witnessed significant growth, registering a CAGR of 9.9% during the historical period 2019 to 2023.

Historical CAGR 9.9%
Forecast CAGR 10.6%

The availability of various flavors and variations and rising consumer desire for healthy dessert options propelled the worldwide frozen yogurt market to a valuation of USD 60.36 billion in 2019. With a historical CAGR of 9.9% between 2019 and 2023, this market experienced significant growth. The frozen yogurt market is expected to grow, with an anticipated CAGR of 10.6%.

The growth is anticipated to be directed by expanded distribution channels, creative product options, and a surge in disposable income. The developments above highlight the remarkable prospects in the frozen yogurt industry, as companies are well-positioned in using the change in consumer inclinations and market conditions to maintain expansion in the upcoming years.

Key Factors Driving the Frozen Yogurt Market

  • Accelerated growth in customer consciousness regarding the health and wellness advantages push the market for frozen yogurt as a more nutritious dessert substitute for conventional ice cream.
  • Customers tend to add value, adding different toppings and tastes to their frozen yogurt, improving their whole eating experience.
  • A wider range of tastes and preferences are catered due to the availability of varied flavors and creative formulations, which is drawn in a larger customer base.

Key Factors Hampering the Frozen Yogurt Market

  • Misconceptions regarding the nutritional value of frozen yogurt and its health advantages can potentially discourage some customers from selecting it over other dessert options despite its healthier reputation.
  • Variations in the demand for frozen desserts by consumers, mainly in the winter, can affect the manufacturers frozen yogurt sales and profitability.
  • Perceptions and purchase decisions of the consumer may be influenced by worries about the origin and caliber of the ingredients mainly used in the manufacturing of frozen yogurt.
  • Due to volatility in ingredient costs and price competition among frozen dessert manufacturers may face difficulties in the positioning and profitability of the frozen yogurt market.

Category-wise Insights

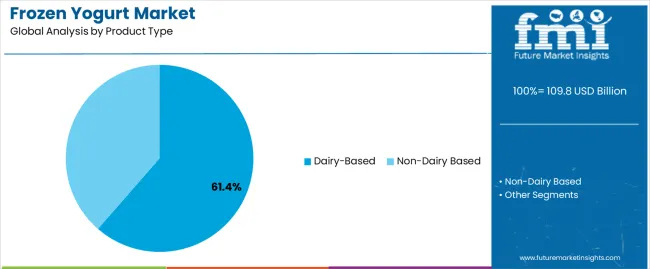
The below section shows the leading segment. Based on the product type, the dairy-based segment is accounted to hold a market share of 88.2% in 2024. Based on sales channel, the hypermarket/supermarket segment is accounted to hold a market share of 44.2% in 2024.

A surge in demand for these time-honored classics in the frozen desserts market as so many customers are accustomed to the flavor and texture of dairy-based desserts like ice cream and frozen yogurt.

Customers tend to readily discover a variety of frozen dessert alternatives at hypermarkets and supermarkets, which make it easier for them to buy their favorite treats on regular grocery shopping trips.

Category Market Share in 2024
Dairy-based 88.2%
Hypermarket/Supermarket 44.2%

Dairy-based Segment to Hold a Significant Share in the Market

Based on the dairy-based segment, holding a significant market share of 88.2% in 2024, the dairy-based sector is leading the frozen desserts market. The market shows that frozen desserts with dairy products, including milk and cream, are highly preferred by customers because they have a rich, creamy texture.

Several variables, including taste preference, perceived indulgence, and familiarity with classic dairy flavors, are probably responsible for the appeal of frozen desserts containing dairy.

Hypermarkets/Supermarkets Segment to Hold a Dominant Share in the Market

Based on sales channel, the hypermarket/supermarket segment holds 44.2% of the market share in 2024. The market emphasizes how important big-box retailers are in getting frozen treats to customers.

A large selection of frozen dessert options is available in supermarkets and hypermarkets, which gives customers convenience and accessibility. A boom in sales of frozen desserts within their locations is the promotional events and eye-catching displays that these retail outlets frequently have.

Country-wise Insights

The table mentions the top five countries ranked by revenue, with India holding the top position.

India is the market leader in frozen yogurt due to the heightened desire for healthier dessert options from its urban population.

The recognized health benefits and adaptability of frozen yogurt are gaining traction among consumers in India, who are placing a greater emphasis on wellness and health. This automatically has resulted in significant market expansion and adoption across metropolitan centers.

Forecast CAGRs from 2024 to 2034

Countries CAGRs through 2034
United States 3.5%
Germany 4.1%
China 5.5%
Japan 5.8%
India 6%

Surge in Health-conscious Consumers in the United States

In the United States, the frozen yogurt market is primarily utilized as a healthier dessert option, catering to health-conscious consumers seeking alternatives to traditional ice cream.

Major chains and independent shops offer a wide range of flavors and toppings, attracting a diverse customer base.
Demand for Frozen Yogurt Impresses the Market Growth in Germany

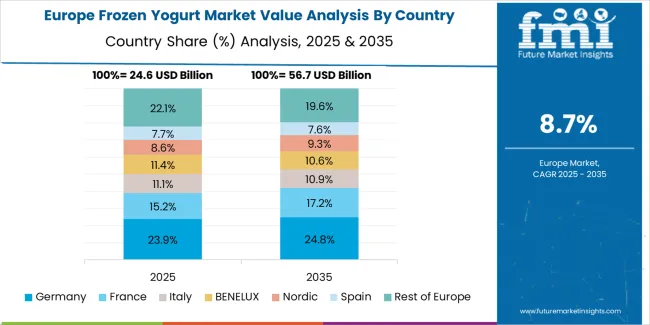
In Germany, frozen yogurt is enjoyed as a refreshing treat, particularly during the warmer months.

Consumers appreciate its creamy texture and tangy taste, making it a popular choice for indulgence.

Escalating Benefits in Health Raises the Market in China

In China, the frozen yogurt market is leveraged as a trendy dessert option, especially among urban millennials. Its customizable nature and association with health benefits appeal to young consumers seeking novel experiences.
Japan Holds a Prominent Position in the Frozen Yogurt Industry

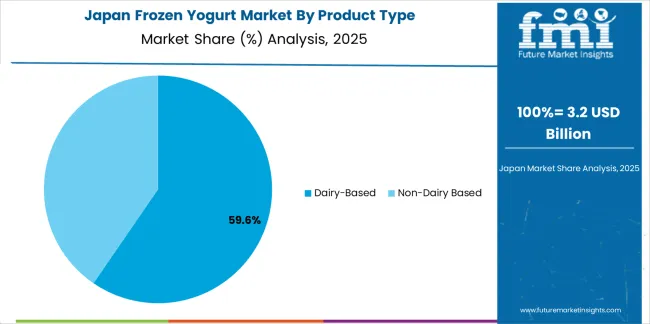
In Japan, frozen yogurt is a light and refreshing snack, often paired with fresh fruit or mochi. Its availability in various flavors and formats caters to the discerning tastes of consumers of Japan.

India Holds a Pivotal Position in the Market

In India, the frozen yogurt market is embraced as a modern dessert option, particularly in urban areas. Its perceived health benefits and versatility make it a favored choice among health-conscious individuals seeking guilt-free indulgence.
Competitive Landscape

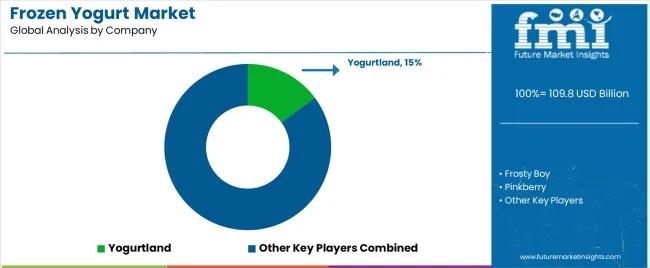
The frozen yogurt market is a competitive landscape that subsequently features a variety of brands offering diverse flavors and toppings. Major chains like Pinkberry and Frosty Boy dominate alongside local and regional players.

Customization options, innovative flavors, and strategic partnerships with supermarkets and specialty stores contribute to market growth. Consumer preferences for healthier dessert options also drive demand in this market.

Some of the key developments are:

  • In 2022, Noosa, a whole milk yogurt brand under Sovos Brands, expanded its product offerings by launching the inaugural line of Noosa Frozen Yoghurt Gelato. The gelato was available in grocery freezers and has four flavors- chocolate fudge, strawberries and cream, sea salt caramel, and honey vanilla bean.
  • In 2021, Yasso introduced Yasso Poppables in coffee, sea salt caramel, vanilla bean, and mint flavors. The poppables are dipped in dark chocolate and topped with quinoa crunch and are now accessible at various retail locations, including supermarkets.

Key Coverage in the Frozen Yogurt Industry Report

  • Adjacent Study on Frozen Yogurt Market
  • Indian Flavoured and Frozen Yogurt Market
  • Frozen Yogurt Market Size, Current Insights, and Demographic Trends
  • Global Frozen Yogurt Sales Market
  • Key Strategies in the Global Frozen Yogurt Market

Report Scope

Attributes Details
Estimated Market Size in 2024 USD 99.29 billion
Projected Market Valuation in 2034 USD 272.74 billion
Value-based CAGR 2024 to 2034 10.6%
Forecast Period 2024 to 2034
Historical Data Available for 2019 to 2023
Market Analysis Value in USD billion
Key Regions Covered North America; Latin America; Western Europe; Eastern Europe; South Asia and Pacific; East Asia; The Middle East and Africa
Key Market Segments Covered Product Type, Fat Content, Flavours, Sales Channel, Region
Key Countries Profiled The United States, Canada, Brazil, Mexico, Germany, The United Kingdom, France, Spain, Italy, Russia, Poland, Czech Republic, Romania, India, Bangladesh, Australia, New Zealand, China, Japan, South Korea, GCC countries, South Africa, Israel
Key Companies Profiled Frosty Boy; Pinkberry; Honey Hill Farms; Scott Brothers Dairy; Red Mango; Yogurtland; Llaollao; I Can't Believe It's Yogurt!; Menchie's Frozen Yogurt; Orange Leaf Frozen Yogurt

Key Segments

By Product Type:

  • Dairy-Based
  • Non-Dairy Based

By Fat Content:

  • Full Fat
  • Low Fat
  • No Fat

By Flavors:

  • Chocolate
  • Strawberry
  • Banana
  • Pineapple
  • Mango
  • Lemonade
  • Peach
  • Other Flavors

By Sales Channel:

  • Offline Sales Channel
    • Hypermarkets/Supermarkets
    • Departmental Stores
    • Convenience Store
    • Other Sales Channel
  • Online Sales Channel
    • Company Website
    • E-commerce Platform
    • Other Sales Channel

By Region:

  • North America
  • Latin America
  • Western Europe
  • Eastern Europe
  • South Asia and Pacific
  • East Asia
  • Middle East and Africa

Table of Content

  • 1. Executive Summary
  • 2. Market Overview
  • 3. Market Background
  • 4. Global Market Analysis 2019 to 2023 and Forecast, 2024 to 2034
  • 5. Global Market Analysis 2019 to 2023 and Forecast 2024 to 2034, By Product Type
    • 5.1. Dairy Based
    • 5.2. Non-Dairy Based
  • 6. Global Market Analysis 2019 to 2023 and Forecast 2024 to 2034, By Fat Content
    • 6.1. Full Fat
    • 6.2. Low Fat
    • 6.3. No Fat
  • 7. Global Market Analysis 2019 to 2023 and Forecast 2024 to 2034, By Flavors
    • 7.1. Chocolate
    • 7.2. Strawberry
    • 7.3. Banana
    • 7.4. Pineapple
    • 7.5. Mango
    • 7.6. Lemonade
    • 7.7. Peach
    • 7.8. Other Flavors
  • 8. Global Market Analysis 2019 to 2023 and Forecast 2024 to 2034, By Sales Channel
    • 8.1. Offline Sales Channel
      • 8.1.1. Hypermarkets/Supermarkets
      • 8.1.2. Departmental Stores
      • 8.1.3. Convenience Store
      • 8.1.4. Other Sales Channel
    • 8.2. Online Sales Channel
      • 8.2.1. Company Website
      • 8.2.2. E-commerce Platform
      • 8.2.3. Other Sales Channel
  • 9. Global Market Analysis 2019 to 2023 and Forecast 2024 to 2034, By Region
    • 9.1. North America
    • 9.2. Latin America
    • 9.3. Western Europe
    • 9.4. Eastern Europe
    • 9.5. South Asia and Pacific
    • 9.6. East Asia
    • 9.7. Middle East and Africa
  • 10. North America Market Analysis 2019 to 2023 and Forecast 2024 to 2034, By Country
  • 11. Latin America Market Analysis 2019 to 2023 and Forecast 2024 to 2034, By Country
  • 12. Western Europe Market Analysis 2019 to 2023 and Forecast 2024 to 2034, By Country
  • 13. Eastern Europe Market Analysis 2019 to 2023 and Forecast 2024 to 2034, By Country
  • 14. South Asia and Pacific Market Analysis 2019 to 2023 and Forecast 2024 to 2034, By Country
  • 15. East Asia Market Analysis 2019 to 2023 and Forecast 2024 to 2034, By Country
  • 16. Middle East and Africa Market Analysis 2019 to 2023 and Forecast 2024 to 2034, By Country
  • 17. Key Countries Market Analysis
  • 18. Market Structure Analysis
  • 19. Competition Analysis
    • 19.1. Frosty Boy
    • 19.2. Pinkberry
    • 19.3. Honey Hill Farms
    • 19.4. Scott Brothers Dairy
    • 19.5. Red Mango
    • 19.6. Yogurtland
    • 19.7. Llaollao
    • 19.8. I Can't Believe It's Yogurt!
    • 19.9. Menchie's Frozen Yogurt
    • 19.10. Orange Leaf Frozen Yogurt
  • 20. Assumptions & Acronyms Used
  • 21. Research Methodology

List of Tables

Table 1: Global Market Value (US$ Million) Forecast by Region, 2019 to 2034

Table 2: Global Market Volume (Unit Pack) Forecast by Region, 2019 to 2034

Table 3: Global Market Value (US$ Million) Forecast by Product Type, 2019 to 2034

Table 4: Global Market Volume (Unit Pack) Forecast by Product Type, 2019 to 2034

Table 5: Global Market Value (US$ Million) Forecast by Fat Content, 2019 to 2034

Table 6: Global Market Volume (Unit Pack) Forecast by Fat Content, 2019 to 2034

Table 7: Global Market Value (US$ Million) Forecast by Flavors, 2019 to 2034

Table 8: Global Market Volume (Unit Pack) Forecast by Flavors, 2019 to 2034

Table 9: Global Market Value (US$ Million) Forecast by Sales Channel, 2019 to 2034

Table 10: Global Market Volume (Unit Pack) Forecast by Sales Channel, 2019 to 2034

Table 11: North America Market Value (US$ Million) Forecast by Country, 2019 to 2034

Table 12: North America Market Volume (Unit Pack) Forecast by Country, 2019 to 2034

Table 13: North America Market Value (US$ Million) Forecast by Product Type, 2019 to 2034

Table 14: North America Market Volume (Unit Pack) Forecast by Product Type, 2019 to 2034

Table 15: North America Market Value (US$ Million) Forecast by Fat Content, 2019 to 2034

Table 16: North America Market Volume (Unit Pack) Forecast by Fat Content, 2019 to 2034

Table 17: North America Market Value (US$ Million) Forecast by Flavors, 2019 to 2034

Table 18: North America Market Volume (Unit Pack) Forecast by Flavors, 2019 to 2034

Table 19: North America Market Value (US$ Million) Forecast by Sales Channel, 2019 to 2034

Table 20: North America Market Volume (Unit Pack) Forecast by Sales Channel, 2019 to 2034

Table 21: Latin America Market Value (US$ Million) Forecast by Country, 2019 to 2034

Table 22: Latin America Market Volume (Unit Pack) Forecast by Country, 2019 to 2034

Table 23: Latin America Market Value (US$ Million) Forecast by Product Type, 2019 to 2034

Table 24: Latin America Market Volume (Unit Pack) Forecast by Product Type, 2019 to 2034

Table 25: Latin America Market Value (US$ Million) Forecast by Fat Content, 2019 to 2034

Table 26: Latin America Market Volume (Unit Pack) Forecast by Fat Content, 2019 to 2034

Table 27: Latin America Market Value (US$ Million) Forecast by Flavors, 2019 to 2034

Table 28: Latin America Market Volume (Unit Pack) Forecast by Flavors, 2019 to 2034

Table 29: Latin America Market Value (US$ Million) Forecast by Sales Channel, 2019 to 2034

Table 30: Latin America Market Volume (Unit Pack) Forecast by Sales Channel, 2019 to 2034

Table 31: Western Europe Market Value (US$ Million) Forecast by Country, 2019 to 2034

Table 32: Western Europe Market Volume (Unit Pack) Forecast by Country, 2019 to 2034

Table 33: Western Europe Market Value (US$ Million) Forecast by Product Type, 2019 to 2034

Table 34: Western Europe Market Volume (Unit Pack) Forecast by Product Type, 2019 to 2034

Table 35: Western Europe Market Value (US$ Million) Forecast by Fat Content, 2019 to 2034

Table 36: Western Europe Market Volume (Unit Pack) Forecast by Fat Content, 2019 to 2034

Table 37: Western Europe Market Value (US$ Million) Forecast by Flavors, 2019 to 2034

Table 38: Western Europe Market Volume (Unit Pack) Forecast by Flavors, 2019 to 2034

Table 39: Western Europe Market Value (US$ Million) Forecast by Sales Channel, 2019 to 2034

Table 40: Western Europe Market Volume (Unit Pack) Forecast by Sales Channel, 2019 to 2034

Table 41: Eastern Europe Market Value (US$ Million) Forecast by Country, 2019 to 2034

Table 42: Eastern Europe Market Volume (Unit Pack) Forecast by Country, 2019 to 2034

Table 43: Eastern Europe Market Value (US$ Million) Forecast by Product Type, 2019 to 2034

Table 44: Eastern Europe Market Volume (Unit Pack) Forecast by Product Type, 2019 to 2034

Table 45: Eastern Europe Market Value (US$ Million) Forecast by Fat Content, 2019 to 2034

Table 46: Eastern Europe Market Volume (Unit Pack) Forecast by Fat Content, 2019 to 2034

Table 47: Eastern Europe Market Value (US$ Million) Forecast by Flavors, 2019 to 2034

Table 48: Eastern Europe Market Volume (Unit Pack) Forecast by Flavors, 2019 to 2034

Table 49: Eastern Europe Market Value (US$ Million) Forecast by Sales Channel, 2019 to 2034

Table 50: Eastern Europe Market Volume (Unit Pack) Forecast by Sales Channel, 2019 to 2034

Table 51: South Asia and Pacific Market Value (US$ Million) Forecast by Country, 2019 to 2034

Table 52: South Asia and Pacific Market Volume (Unit Pack) Forecast by Country, 2019 to 2034

Table 53: South Asia and Pacific Market Value (US$ Million) Forecast by Product Type, 2019 to 2034

Table 54: South Asia and Pacific Market Volume (Unit Pack) Forecast by Product Type, 2019 to 2034

Table 55: South Asia and Pacific Market Value (US$ Million) Forecast by Fat Content, 2019 to 2034

Table 56: South Asia and Pacific Market Volume (Unit Pack) Forecast by Fat Content, 2019 to 2034

Table 57: South Asia and Pacific Market Value (US$ Million) Forecast by Flavors, 2019 to 2034

Table 58: South Asia and Pacific Market Volume (Unit Pack) Forecast by Flavors, 2019 to 2034

Table 59: South Asia and Pacific Market Value (US$ Million) Forecast by Sales Channel, 2019 to 2034

Table 60: South Asia and Pacific Market Volume (Unit Pack) Forecast by Sales Channel, 2019 to 2034

Table 61: East Asia Market Value (US$ Million) Forecast by Country, 2019 to 2034

Table 62: East Asia Market Volume (Unit Pack) Forecast by Country, 2019 to 2034

Table 63: East Asia Market Value (US$ Million) Forecast by Product Type, 2019 to 2034

Table 64: East Asia Market Volume (Unit Pack) Forecast by Product Type, 2019 to 2034

Table 65: East Asia Market Value (US$ Million) Forecast by Fat Content, 2019 to 2034

Table 66: East Asia Market Volume (Unit Pack) Forecast by Fat Content, 2019 to 2034

Table 67: East Asia Market Value (US$ Million) Forecast by Flavors, 2019 to 2034

Table 68: East Asia Market Volume (Unit Pack) Forecast by Flavors, 2019 to 2034

Table 69: East Asia Market Value (US$ Million) Forecast by Sales Channel, 2019 to 2034

Table 70: East Asia Market Volume (Unit Pack) Forecast by Sales Channel, 2019 to 2034

Table 71: Middle East and Africa Market Value (US$ Million) Forecast by Country, 2019 to 2034

Table 72: Middle East and Africa Market Volume (Unit Pack) Forecast by Country, 2019 to 2034

Table 73: Middle East and Africa Market Value (US$ Million) Forecast by Product Type, 2019 to 2034

Table 74: Middle East and Africa Market Volume (Unit Pack) Forecast by Product Type, 2019 to 2034

Table 75: Middle East and Africa Market Value (US$ Million) Forecast by Fat Content, 2019 to 2034

Table 76: Middle East and Africa Market Volume (Unit Pack) Forecast by Fat Content, 2019 to 2034

Table 77: Middle East and Africa Market Value (US$ Million) Forecast by Flavors, 2019 to 2034

Table 78: Middle East and Africa Market Volume (Unit Pack) Forecast by Flavors, 2019 to 2034

Table 79: Middle East and Africa Market Value (US$ Million) Forecast by Sales Channel, 2019 to 2034

Table 80: Middle East and Africa Market Volume (Unit Pack) Forecast by Sales Channel, 2019 to 2034

List of Figures

Figure 1: Global Market Value (US$ Million) by Product Type, 2024 to 2034

Figure 2: Global Market Value (US$ Million) by Fat Content, 2024 to 2034

Figure 3: Global Market Value (US$ Million) by Flavors, 2024 to 2034

Figure 4: Global Market Value (US$ Million) by Sales Channel, 2024 to 2034

Figure 5: Global Market Value (US$ Million) by Region, 2024 to 2034

Figure 6: Global Market Value (US$ Million) Analysis by Region, 2019 to 2034

Figure 7: Global Market Volume (Unit Pack) Analysis by Region, 2019 to 2034

Figure 8: Global Market Value Share (%) and BPS Analysis by Region, 2024 to 2034

Figure 9: Global Market Y-o-Y Growth (%) Projections by Region, 2024 to 2034

Figure 10: Global Market Value (US$ Million) Analysis by Product Type, 2019 to 2034

Figure 11: Global Market Volume (Unit Pack) Analysis by Product Type, 2019 to 2034

Figure 12: Global Market Value Share (%) and BPS Analysis by Product Type, 2024 to 2034

Figure 13: Global Market Y-o-Y Growth (%) Projections by Product Type, 2024 to 2034

Figure 14: Global Market Value (US$ Million) Analysis by Fat Content, 2019 to 2034

Figure 15: Global Market Volume (Unit Pack) Analysis by Fat Content, 2019 to 2034

Figure 16: Global Market Value Share (%) and BPS Analysis by Fat Content, 2024 to 2034

Figure 17: Global Market Y-o-Y Growth (%) Projections by Fat Content, 2024 to 2034

Figure 18: Global Market Value (US$ Million) Analysis by Flavors, 2019 to 2034

Figure 19: Global Market Volume (Unit Pack) Analysis by Flavors, 2019 to 2034

Figure 20: Global Market Value Share (%) and BPS Analysis by Flavors, 2024 to 2034

Figure 21: Global Market Y-o-Y Growth (%) Projections by Flavors, 2024 to 2034

Figure 22: Global Market Value (US$ Million) Analysis by Sales Channel, 2019 to 2034

Figure 23: Global Market Volume (Unit Pack) Analysis by Sales Channel, 2019 to 2034

Figure 24: Global Market Value Share (%) and BPS Analysis by Sales Channel, 2024 to 2034

Figure 25: Global Market Y-o-Y Growth (%) Projections by Sales Channel, 2024 to 2034

Figure 26: Global Market Attractiveness by Product Type, 2024 to 2034

Figure 27: Global Market Attractiveness by Fat Content, 2024 to 2034

Figure 28: Global Market Attractiveness by Flavors, 2024 to 2034

Figure 29: Global Market Attractiveness by Sales Channel, 2024 to 2034

Figure 30: Global Market Attractiveness by Region, 2024 to 2034

Figure 31: North America Market Value (US$ Million) by Product Type, 2024 to 2034

Figure 32: North America Market Value (US$ Million) by Fat Content, 2024 to 2034

Figure 33: North America Market Value (US$ Million) by Flavors, 2024 to 2034

Figure 34: North America Market Value (US$ Million) by Sales Channel, 2024 to 2034

Figure 35: North America Market Value (US$ Million) by Country, 2024 to 2034

Figure 36: North America Market Value (US$ Million) Analysis by Country, 2019 to 2034

Figure 37: North America Market Volume (Unit Pack) Analysis by Country, 2019 to 2034

Figure 38: North America Market Value Share (%) and BPS Analysis by Country, 2024 to 2034

Figure 39: North America Market Y-o-Y Growth (%) Projections by Country, 2024 to 2034

Figure 40: North America Market Value (US$ Million) Analysis by Product Type, 2019 to 2034

Figure 41: North America Market Volume (Unit Pack) Analysis by Product Type, 2019 to 2034

Figure 42: North America Market Value Share (%) and BPS Analysis by Product Type, 2024 to 2034

Figure 43: North America Market Y-o-Y Growth (%) Projections by Product Type, 2024 to 2034

Figure 44: North America Market Value (US$ Million) Analysis by Fat Content, 2019 to 2034

Figure 45: North America Market Volume (Unit Pack) Analysis by Fat Content, 2019 to 2034

Figure 46: North America Market Value Share (%) and BPS Analysis by Fat Content, 2024 to 2034

Figure 47: North America Market Y-o-Y Growth (%) Projections by Fat Content, 2024 to 2034

Figure 48: North America Market Value (US$ Million) Analysis by Flavors, 2019 to 2034

Figure 49: North America Market Volume (Unit Pack) Analysis by Flavors, 2019 to 2034

Figure 50: North America Market Value Share (%) and BPS Analysis by Flavors, 2024 to 2034

Figure 51: North America Market Y-o-Y Growth (%) Projections by Flavors, 2024 to 2034

Figure 52: North America Market Value (US$ Million) Analysis by Sales Channel, 2019 to 2034

Figure 53: North America Market Volume (Unit Pack) Analysis by Sales Channel, 2019 to 2034

Figure 54: North America Market Value Share (%) and BPS Analysis by Sales Channel, 2024 to 2034

Figure 55: North America Market Y-o-Y Growth (%) Projections by Sales Channel, 2024 to 2034

Figure 56: North America Market Attractiveness by Product Type, 2024 to 2034

Figure 57: North America Market Attractiveness by Fat Content, 2024 to 2034

Figure 58: North America Market Attractiveness by Flavors, 2024 to 2034

Figure 59: North America Market Attractiveness by Sales Channel, 2024 to 2034

Figure 60: North America Market Attractiveness by Country, 2024 to 2034

Figure 61: Latin America Market Value (US$ Million) by Product Type, 2024 to 2034

Figure 62: Latin America Market Value (US$ Million) by Fat Content, 2024 to 2034

Figure 63: Latin America Market Value (US$ Million) by Flavors, 2024 to 2034

Figure 64: Latin America Market Value (US$ Million) by Sales Channel, 2024 to 2034

Figure 65: Latin America Market Value (US$ Million) by Country, 2024 to 2034

Figure 66: Latin America Market Value (US$ Million) Analysis by Country, 2019 to 2034

Figure 67: Latin America Market Volume (Unit Pack) Analysis by Country, 2019 to 2034

Figure 68: Latin America Market Value Share (%) and BPS Analysis by Country, 2024 to 2034

Figure 69: Latin America Market Y-o-Y Growth (%) Projections by Country, 2024 to 2034

Figure 70: Latin America Market Value (US$ Million) Analysis by Product Type, 2019 to 2034

Figure 71: Latin America Market Volume (Unit Pack) Analysis by Product Type, 2019 to 2034

Figure 72: Latin America Market Value Share (%) and BPS Analysis by Product Type, 2024 to 2034

Figure 73: Latin America Market Y-o-Y Growth (%) Projections by Product Type, 2024 to 2034

Figure 74: Latin America Market Value (US$ Million) Analysis by Fat Content, 2019 to 2034

Figure 75: Latin America Market Volume (Unit Pack) Analysis by Fat Content, 2019 to 2034

Figure 76: Latin America Market Value Share (%) and BPS Analysis by Fat Content, 2024 to 2034

Figure 77: Latin America Market Y-o-Y Growth (%) Projections by Fat Content, 2024 to 2034

Figure 78: Latin America Market Value (US$ Million) Analysis by Flavors, 2019 to 2034

Figure 79: Latin America Market Volume (Unit Pack) Analysis by Flavors, 2019 to 2034

Figure 80: Latin America Market Value Share (%) and BPS Analysis by Flavors, 2024 to 2034

Figure 81: Latin America Market Y-o-Y Growth (%) Projections by Flavors, 2024 to 2034

Figure 82: Latin America Market Value (US$ Million) Analysis by Sales Channel, 2019 to 2034

Figure 83: Latin America Market Volume (Unit Pack) Analysis by Sales Channel, 2019 to 2034

Figure 84: Latin America Market Value Share (%) and BPS Analysis by Sales Channel, 2024 to 2034

Figure 85: Latin America Market Y-o-Y Growth (%) Projections by Sales Channel, 2024 to 2034

Figure 86: Latin America Market Attractiveness by Product Type, 2024 to 2034

Figure 87: Latin America Market Attractiveness by Fat Content, 2024 to 2034

Figure 88: Latin America Market Attractiveness by Flavors, 2024 to 2034

Figure 89: Latin America Market Attractiveness by Sales Channel, 2024 to 2034

Figure 90: Latin America Market Attractiveness by Country, 2024 to 2034

Figure 91: Western Europe Market Value (US$ Million) by Product Type, 2024 to 2034

Figure 92: Western Europe Market Value (US$ Million) by Fat Content, 2024 to 2034

Figure 93: Western Europe Market Value (US$ Million) by Flavors, 2024 to 2034

Figure 94: Western Europe Market Value (US$ Million) by Sales Channel, 2024 to 2034

Figure 95: Western Europe Market Value (US$ Million) by Country, 2024 to 2034

Figure 96: Western Europe Market Value (US$ Million) Analysis by Country, 2019 to 2034

Figure 97: Western Europe Market Volume (Unit Pack) Analysis by Country, 2019 to 2034

Figure 98: Western Europe Market Value Share (%) and BPS Analysis by Country, 2024 to 2034

Figure 99: Western Europe Market Y-o-Y Growth (%) Projections by Country, 2024 to 2034

Figure 100: Western Europe Market Value (US$ Million) Analysis by Product Type, 2019 to 2034

Figure 101: Western Europe Market Volume (Unit Pack) Analysis by Product Type, 2019 to 2034

Figure 102: Western Europe Market Value Share (%) and BPS Analysis by Product Type, 2024 to 2034

Figure 103: Western Europe Market Y-o-Y Growth (%) Projections by Product Type, 2024 to 2034

Figure 104: Western Europe Market Value (US$ Million) Analysis by Fat Content, 2019 to 2034

Figure 105: Western Europe Market Volume (Unit Pack) Analysis by Fat Content, 2019 to 2034

Figure 106: Western Europe Market Value Share (%) and BPS Analysis by Fat Content, 2024 to 2034

Figure 107: Western Europe Market Y-o-Y Growth (%) Projections by Fat Content, 2024 to 2034

Figure 108: Western Europe Market Value (US$ Million) Analysis by Flavors, 2019 to 2034

Figure 109: Western Europe Market Volume (Unit Pack) Analysis by Flavors, 2019 to 2034

Figure 110: Western Europe Market Value Share (%) and BPS Analysis by Flavors, 2024 to 2034

Figure 111: Western Europe Market Y-o-Y Growth (%) Projections by Flavors, 2024 to 2034

Figure 112: Western Europe Market Value (US$ Million) Analysis by Sales Channel, 2019 to 2034

Figure 113: Western Europe Market Volume (Unit Pack) Analysis by Sales Channel, 2019 to 2034

Figure 114: Western Europe Market Value Share (%) and BPS Analysis by Sales Channel, 2024 to 2034

Figure 115: Western Europe Market Y-o-Y Growth (%) Projections by Sales Channel, 2024 to 2034

Figure 116: Western Europe Market Attractiveness by Product Type, 2024 to 2034

Figure 117: Western Europe Market Attractiveness by Fat Content, 2024 to 2034

Figure 118: Western Europe Market Attractiveness by Flavors, 2024 to 2034

Figure 119: Western Europe Market Attractiveness by Sales Channel, 2024 to 2034

Figure 120: Western Europe Market Attractiveness by Country, 2024 to 2034

Figure 121: Eastern Europe Market Value (US$ Million) by Product Type, 2024 to 2034

Figure 122: Eastern Europe Market Value (US$ Million) by Fat Content, 2024 to 2034

Figure 123: Eastern Europe Market Value (US$ Million) by Flavors, 2024 to 2034

Figure 124: Eastern Europe Market Value (US$ Million) by Sales Channel, 2024 to 2034

Figure 125: Eastern Europe Market Value (US$ Million) by Country, 2024 to 2034

Figure 126: Eastern Europe Market Value (US$ Million) Analysis by Country, 2019 to 2034

Figure 127: Eastern Europe Market Volume (Unit Pack) Analysis by Country, 2019 to 2034

Figure 128: Eastern Europe Market Value Share (%) and BPS Analysis by Country, 2024 to 2034

Figure 129: Eastern Europe Market Y-o-Y Growth (%) Projections by Country, 2024 to 2034

Figure 130: Eastern Europe Market Value (US$ Million) Analysis by Product Type, 2019 to 2034

Figure 131: Eastern Europe Market Volume (Unit Pack) Analysis by Product Type, 2019 to 2034

Figure 132: Eastern Europe Market Value Share (%) and BPS Analysis by Product Type, 2024 to 2034

Figure 133: Eastern Europe Market Y-o-Y Growth (%) Projections by Product Type, 2024 to 2034

Figure 134: Eastern Europe Market Value (US$ Million) Analysis by Fat Content, 2019 to 2034

Figure 135: Eastern Europe Market Volume (Unit Pack) Analysis by Fat Content, 2019 to 2034

Figure 136: Eastern Europe Market Value Share (%) and BPS Analysis by Fat Content, 2024 to 2034

Figure 137: Eastern Europe Market Y-o-Y Growth (%) Projections by Fat Content, 2024 to 2034

Figure 138: Eastern Europe Market Value (US$ Million) Analysis by Flavors, 2019 to 2034

Figure 139: Eastern Europe Market Volume (Unit Pack) Analysis by Flavors, 2019 to 2034

Figure 140: Eastern Europe Market Value Share (%) and BPS Analysis by Flavors, 2024 to 2034

Figure 141: Eastern Europe Market Y-o-Y Growth (%) Projections by Flavors, 2024 to 2034

Figure 142: Eastern Europe Market Value (US$ Million) Analysis by Sales Channel, 2019 to 2034

Figure 143: Eastern Europe Market Volume (Unit Pack) Analysis by Sales Channel, 2019 to 2034

Figure 144: Eastern Europe Market Value Share (%) and BPS Analysis by Sales Channel, 2024 to 2034

Figure 145: Eastern Europe Market Y-o-Y Growth (%) Projections by Sales Channel, 2024 to 2034

Figure 146: Eastern Europe Market Attractiveness by Product Type, 2024 to 2034

Figure 147: Eastern Europe Market Attractiveness by Fat Content, 2024 to 2034

Figure 148: Eastern Europe Market Attractiveness by Flavors, 2024 to 2034

Figure 149: Eastern Europe Market Attractiveness by Sales Channel, 2024 to 2034

Figure 150: Eastern Europe Market Attractiveness by Country, 2024 to 2034

Figure 151: South Asia and Pacific Market Value (US$ Million) by Product Type, 2024 to 2034

Figure 152: South Asia and Pacific Market Value (US$ Million) by Fat Content, 2024 to 2034

Figure 153: South Asia and Pacific Market Value (US$ Million) by Flavors, 2024 to 2034

Figure 154: South Asia and Pacific Market Value (US$ Million) by Sales Channel, 2024 to 2034

Figure 155: South Asia and Pacific Market Value (US$ Million) by Country, 2024 to 2034

Figure 156: South Asia and Pacific Market Value (US$ Million) Analysis by Country, 2019 to 2034

Figure 157: South Asia and Pacific Market Volume (Unit Pack) Analysis by Country, 2019 to 2034

Figure 158: South Asia and Pacific Market Value Share (%) and BPS Analysis by Country, 2024 to 2034

Figure 159: South Asia and Pacific Market Y-o-Y Growth (%) Projections by Country, 2024 to 2034

Figure 160: South Asia and Pacific Market Value (US$ Million) Analysis by Product Type, 2019 to 2034

Figure 161: South Asia and Pacific Market Volume (Unit Pack) Analysis by Product Type, 2019 to 2034

Figure 162: South Asia and Pacific Market Value Share (%) and BPS Analysis by Product Type, 2024 to 2034

Figure 163: South Asia and Pacific Market Y-o-Y Growth (%) Projections by Product Type, 2024 to 2034

Figure 164: South Asia and Pacific Market Value (US$ Million) Analysis by Fat Content, 2019 to 2034

Figure 165: South Asia and Pacific Market Volume (Unit Pack) Analysis by Fat Content, 2019 to 2034

Figure 166: South Asia and Pacific Market Value Share (%) and BPS Analysis by Fat Content, 2024 to 2034

Figure 167: South Asia and Pacific Market Y-o-Y Growth (%) Projections by Fat Content, 2024 to 2034

Figure 168: South Asia and Pacific Market Value (US$ Million) Analysis by Flavors, 2019 to 2034

Figure 169: South Asia and Pacific Market Volume (Unit Pack) Analysis by Flavors, 2019 to 2034

Figure 170: South Asia and Pacific Market Value Share (%) and BPS Analysis by Flavors, 2024 to 2034

Figure 171: South Asia and Pacific Market Y-o-Y Growth (%) Projections by Flavors, 2024 to 2034

Figure 172: South Asia and Pacific Market Value (US$ Million) Analysis by Sales Channel, 2019 to 2034

Figure 173: South Asia and Pacific Market Volume (Unit Pack) Analysis by Sales Channel, 2019 to 2034

Figure 174: South Asia and Pacific Market Value Share (%) and BPS Analysis by Sales Channel, 2024 to 2034

Figure 175: South Asia and Pacific Market Y-o-Y Growth (%) Projections by Sales Channel, 2024 to 2034

Figure 176: South Asia and Pacific Market Attractiveness by Product Type, 2024 to 2034

Figure 177: South Asia and Pacific Market Attractiveness by Fat Content, 2024 to 2034

Figure 178: South Asia and Pacific Market Attractiveness by Flavors, 2024 to 2034

Figure 179: South Asia and Pacific Market Attractiveness by Sales Channel, 2024 to 2034

Figure 180: South Asia and Pacific Market Attractiveness by Country, 2024 to 2034

Figure 181: East Asia Market Value (US$ Million) by Product Type, 2024 to 2034

Figure 182: East Asia Market Value (US$ Million) by Fat Content, 2024 to 2034

Figure 183: East Asia Market Value (US$ Million) by Flavors, 2024 to 2034

Figure 184: East Asia Market Value (US$ Million) by Sales Channel, 2024 to 2034

Figure 185: East Asia Market Value (US$ Million) by Country, 2024 to 2034

Figure 186: East Asia Market Value (US$ Million) Analysis by Country, 2019 to 2034

Figure 187: East Asia Market Volume (Unit Pack) Analysis by Country, 2019 to 2034

Figure 188: East Asia Market Value Share (%) and BPS Analysis by Country, 2024 to 2034

Figure 189: East Asia Market Y-o-Y Growth (%) Projections by Country, 2024 to 2034

Figure 190: East Asia Market Value (US$ Million) Analysis by Product Type, 2019 to 2034

Figure 191: East Asia Market Volume (Unit Pack) Analysis by Product Type, 2019 to 2034

Figure 192: East Asia Market Value Share (%) and BPS Analysis by Product Type, 2024 to 2034

Figure 193: East Asia Market Y-o-Y Growth (%) Projections by Product Type, 2024 to 2034

Figure 194: East Asia Market Value (US$ Million) Analysis by Fat Content, 2019 to 2034

Figure 195: East Asia Market Volume (Unit Pack) Analysis by Fat Content, 2019 to 2034

Figure 196: East Asia Market Value Share (%) and BPS Analysis by Fat Content, 2024 to 2034

Figure 197: East Asia Market Y-o-Y Growth (%) Projections by Fat Content, 2024 to 2034

Figure 198: East Asia Market Value (US$ Million) Analysis by Flavors, 2019 to 2034

Figure 199: East Asia Market Volume (Unit Pack) Analysis by Flavors, 2019 to 2034

Figure 200: East Asia Market Value Share (%) and BPS Analysis by Flavors, 2024 to 2034

Figure 201: East Asia Market Y-o-Y Growth (%) Projections by Flavors, 2024 to 2034

Figure 202: East Asia Market Value (US$ Million) Analysis by Sales Channel, 2019 to 2034

Figure 203: East Asia Market Volume (Unit Pack) Analysis by Sales Channel, 2019 to 2034

Figure 204: East Asia Market Value Share (%) and BPS Analysis by Sales Channel, 2024 to 2034

Figure 205: East Asia Market Y-o-Y Growth (%) Projections by Sales Channel, 2024 to 2034

Figure 206: East Asia Market Attractiveness by Product Type, 2024 to 2034

Figure 207: East Asia Market Attractiveness by Fat Content, 2024 to 2034

Figure 208: East Asia Market Attractiveness by Flavors, 2024 to 2034

Figure 209: East Asia Market Attractiveness by Sales Channel, 2024 to 2034

Figure 210: East Asia Market Attractiveness by Country, 2024 to 2034

Figure 211: Middle East and Africa Market Value (US$ Million) by Product Type, 2024 to 2034

Figure 212: Middle East and Africa Market Value (US$ Million) by Fat Content, 2024 to 2034

Figure 213: Middle East and Africa Market Value (US$ Million) by Flavors, 2024 to 2034

Figure 214: Middle East and Africa Market Value (US$ Million) by Sales Channel, 2024 to 2034

Figure 215: Middle East and Africa Market Value (US$ Million) by Country, 2024 to 2034

Figure 216: Middle East and Africa Market Value (US$ Million) Analysis by Country, 2019 to 2034

Figure 217: Middle East and Africa Market Volume (Unit Pack) Analysis by Country, 2019 to 2034

Figure 218: Middle East and Africa Market Value Share (%) and BPS Analysis by Country, 2024 to 2034

Figure 219: Middle East and Africa Market Y-o-Y Growth (%) Projections by Country, 2024 to 2034

Figure 220: Middle East and Africa Market Value (US$ Million) Analysis by Product Type, 2019 to 2034

Figure 221: Middle East and Africa Market Volume (Unit Pack) Analysis by Product Type, 2019 to 2034

Figure 222: Middle East and Africa Market Value Share (%) and BPS Analysis by Product Type, 2024 to 2034

Figure 223: Middle East and Africa Market Y-o-Y Growth (%) Projections by Product Type, 2024 to 2034

Figure 224: Middle East and Africa Market Value (US$ Million) Analysis by Fat Content, 2019 to 2034

Figure 225: Middle East and Africa Market Volume (Unit Pack) Analysis by Fat Content, 2019 to 2034

Figure 226: Middle East and Africa Market Value Share (%) and BPS Analysis by Fat Content, 2024 to 2034

Figure 227: Middle East and Africa Market Y-o-Y Growth (%) Projections by Fat Content, 2024 to 2034

Figure 228: Middle East and Africa Market Value (US$ Million) Analysis by Flavors, 2019 to 2034

Figure 229: Middle East and Africa Market Volume (Unit Pack) Analysis by Flavors, 2019 to 2034

Figure 230: Middle East and Africa Market Value Share (%) and BPS Analysis by Flavors, 2024 to 2034

Figure 231: Middle East and Africa Market Y-o-Y Growth (%) Projections by Flavors, 2024 to 2034

Figure 232: Middle East and Africa Market Value (US$ Million) Analysis by Sales Channel, 2019 to 2034

Figure 233: Middle East and Africa Market Volume (Unit Pack) Analysis by Sales Channel, 2019 to 2034

Figure 234: Middle East and Africa Market Value Share (%) and BPS Analysis by Sales Channel, 2024 to 2034

Figure 235: Middle East and Africa Market Y-o-Y Growth (%) Projections by Sales Channel, 2024 to 2034

Figure 236: Middle East and Africa Market Attractiveness by Product Type, 2024 to 2034

Figure 237: Middle East and Africa Market Attractiveness by Fat Content, 2024 to 2034

Figure 238: Middle East and Africa Market Attractiveness by Flavors, 2024 to 2034

Figure 239: Middle East and Africa Market Attractiveness by Sales Channel, 2024 to 2034

Figure 240: Middle East and Africa Market Attractiveness by Country, 2024 to 2034

Frequently Asked Questions

What is the expected worth of the frozen yogurt market in 2024?

As of 2024, the market for frozen yogurts is expected to be valued at USD 99.29 billion.

What is the market potential for frozen yogurt?

The frozen yogurt market is projected to expand at a CAGR of 10.6% between 2024 and 2034.

Which product type segment dominates the frozen yogurt market?

The dairy based segment is projected to dominate the industry.

What is the anticipated market value for frozen yogurt in 2034?

By 2034, the market value of frozen yogurt is expected to reach USD 272.74 billion.

Which country is likely to dominate the frozen yogurt market?

India is likely the top-performing market, with a CAGR of 6%.

Explore Similar Insights

Future Market Insights

Frozen Yogurt Market