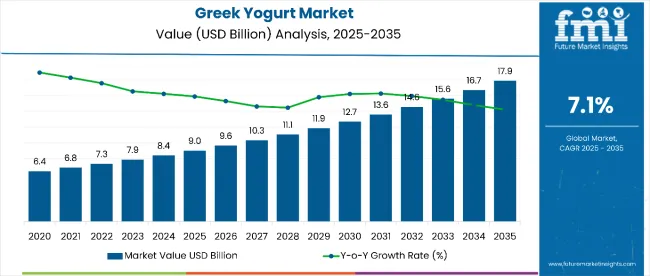
The global Greek yogurt market is estimated to be valued at USD 9.0 billion in 2025 and is projected to reach USD 17.9 billion by 2035, registering a CAGR of 7.1% over the forecast period. This represents an absolute dollar opportunity of USD 8.9 billion during 2025 to 2035, or amarket expansion.
| Metric | Value |
|---|---|
| Market Size (2025) | USD 9.0 Billion |
| Market Size (2035) | USD 17.9 Billion |
| CAGR (2025 to 2035) | 7.1% |
The market’s sustained growth will be driven by increasing demand for protein-rich snacks, rising health and wellness trends, and the growing appeal of functional dairy products among fitness-conscious and aging populations. By 2030, the market is projected to reach USD 12.7 billion, contributing an incremental USD 3.7 billion in value during the first half of the decade. The remaining USD 5.2 billion is expected between 2030 and 2035, indicating a more accelerated growth trajectory in the latter half of the forecast period.
Consumer preference is shifting toward clean-label, organic, and low-fat Greek yogurt products. Innovation in flavors, probiotic enhancements, and sustainable packaging formats are helping brands capture new demographics and usage occasions. The Plain segment is anticipated to retain dominance due to its versatility, while Cups & Tubs remain the packaging of choice for convenience and portion control.
Leading players such as Chobani LLC are expanding their competitive edge through product innovation, strategic partnerships, and sustainability initiatives. Investments in domestic sourcing, supply chain transparency, and nutritional marketing are expected to influence market dynamics positively. The evolution of retail formats and growth in online grocery channels will further enhance product accessibility and visibility.
The market accounts for 39% of the healthy dairy snacking market, driven by its high protein content, digestive health benefits, and on-the-go convenience. It contributes to nearly 33% of the protein-enriched functional food segment, as consumers increasingly turn to Greek yogurt as a natural, low-fat, high-protein option. The market holds close to 26% of the low-sugar dairy category, supported by demand for clean-label and low-GI foods.
Greek yogurt represents about 23% of the probiotic and gut-health foods segment, with live cultures and strained textures appealing to both wellness and therapeutic nutrition audiences. Additionally, it contributes around 30% of the premium dairy segment, where organic, grass-fed, and artisanal products command a significant price premium among health-conscious and affluent consumers.
The market is undergoing structural transformation driven by shifting dietary habits, rising awareness of functional nutrition, and growing interest in specialty diets such as keto and high-protein regimens. Innovations in flavor, format (drinkable, frozen), and packaging have expanded usage occasions from breakfast to post-workout snacking. Manufacturers are launching value-added variants such as plant-based Greek-style yogurts, digestive health-enhanced SKUs, and single-serve pouches for portability
Rising health consciousness among consumers globally has positioned Greek yogurt as a preferred alternative to traditional dairy and snack options, fueling consistent market growth. Growing awareness of its high protein content, digestive health benefits (due to probiotics), and low sugar and fat profiles has supported its adoption across a wide range of consumer demographics from fitness enthusiasts to aging populations.
The market is further supported by expanding applications in the food and beverage industry, where Greek yogurt is increasingly used in smoothies, sauces, frozen desserts, and as a base for high-protein meal replacements. Innovations in flavor profiles, texture, and packaging have broadened its appeal beyond breakfast and into snacking and post-workout nutrition.
As the prevalence of lifestyle-related diseases increases and consumers shift toward preventive, functional nutrition, Greek yogurt stands out as a versatile, nutrient-dense food. Backed by scientific research supporting its benefits for gut health, satiety, and muscle recovery, Greek yogurt is gaining traction across both developed and emerging markets. Its alignment with trends such as high-protein diets, clean-label eating, and gut health optimization positions the category for sustained long-term growth.
The market is segmented by package type, nature, flavor, distribution channel, product type, and region. By package type, the market is bifurcated into cups & tubs and bottles. Based on nature, the market is bifurcated into conventional and organic. In terms of flavor, the market is segmented into plain, strawberry, blueberry, vanilla, and others (mango, peach, honey, and mixed berry).
By distribution channel, the market is divided into supermarkets/hypermarkets, convenience stores, online stores, and others (specialty stores, grocery chains, and foodservice outlets). Based on product type, the market is classified into full-fat yogurt, de-fat yogurt, and fat-free yogurt. Regionally, the market is divided into North America, Latin America, Western Europe, Eastern Europe, South Asia and Pacific, East Asia, and the Middle East & Africa.
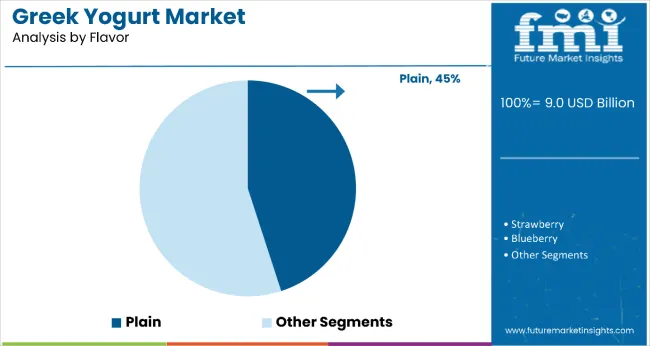
The plain Greek yogurt segment is the most lucrative flavor category, holding an estimated 45% share of the global Greek yogurt market in 2025. Its dominance is driven by its nutritional density, versatility, and strong alignment with health and wellness trends. Unlike flavored variants, plain yogurt contains minimal to no added sugars, making it the preferred choice among fitness-conscious, diabetic, and clean-label consumers. It also serves as a foundational base in both sweet and savory preparations, increasing its utility across meals, snacks, and cooking applications.
The segment benefits from rising popularity of low-carb, high-protein diets, especially among urban and aging populations. Additionally, plain yogurt’s use in meal prepping, smoothies, and culinary applications in regions such as North America and Europe further enhances demand. With manufacturers focusing on organic, grass-fed, and probiotic-enhanced plain yogurt lines, the segment is poised for continued value growth throughout the forecast period.
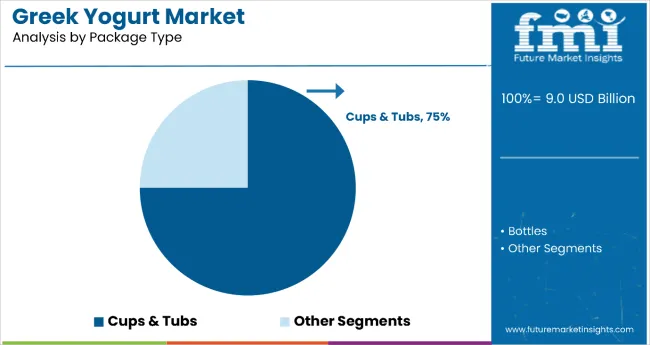
The cups and tubs segment dominates the Greek yogurt market by packaging type, accounting for approximately 75% of global market share in 2025. This format continues to lead due to its convenience, portion control, and broad consumer appeal across demographics. Cups and tubs are especially favored in retail and grab-and-go formats, making them ideal for busy lifestyles and on-the-move consumption, particularly in urban centers. The segment’s growth is supported by a wide range of product innovations, including single-serve tubs, multi-pack options, and compartmentalized designs for mix-ins such as granola or fruit.
Cups and tubs also offer better shelf visibility, effective branding real estate, and packaging customization, all of which enhance consumer engagement and drive purchase intent. Moreover, sustainability trends are encouraging brands to adopt eco-friendly materials and recyclable packaging within this format, aligning with consumer values. The segment’s adaptability across mainstream, premium, and organic offerings further cements its leadership in the market.
From 2025 to 2035, rising focus on digestive health, weight management, and high-protein diets has transformed Greek yogurt into a staple within health-conscious consumer routines. As consumers increasingly turn to functional foods for daily wellness, Greek yogurt - rich in probiotics, calcium, and protein has emerged as a high-demand dairy category across both mature and emerging markets.
Rising Health Consciousness Drives Greek Yogurt Market Growth
Growing global awareness of gut health, metabolic function, and nutrient-dense diets has been a primary driver of Greek yogurt adoption. In 2024, Greek yogurt gained prominence in clinical nutrition programs due to its probiotic content, supporting digestive health and immunity.
By 2025, endorsements from nutritionists and fitness professionals positioned it as a core component in high-protein, low-sugar diets especially popular among millennials and aging populations. These developments show that nutritional efficacy, rather than just taste or indulgence, is establishing Greek yogurt as a daily dietary essential.
Premium Product Innovation Creates Market Opportunities
In 2024, brands began expanding into value-added formats such as drinkable Greek yogurt, plant-based Greek-style alternatives, and nutrient-enhanced formulations (e.g., with added fiber or collagen). By 2025, products with organic certification, grass-fed dairy sourcing, and sustainable packaging gained increased shelf space in premium retail outlets and health specialty stores.
This reflects a broader shift toward product differentiation, where innovation in flavor (e.g., honey-lavender, coconut-chia), packaging (on-the-go pouches, dual-compartment tubs), and functional positioning (e.g., keto-friendly, probiotic-boosted) is enabling brands to command premium pricing and build brand loyalty.
| Countries | CAGR |
|---|---|
| USA | 9.3% |
| Germany | 9.0% |
| Japan | 8.1% |
| France | 6.5% |
| UK | 5.2% |
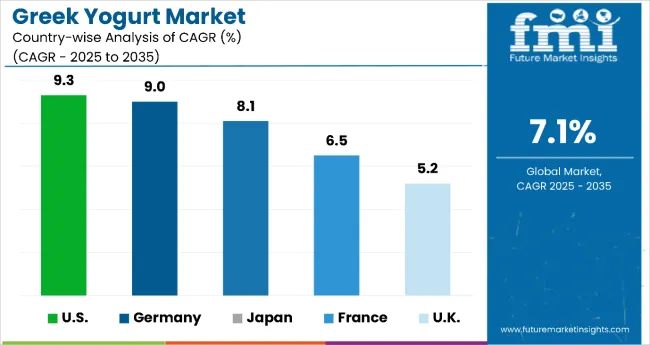
Between 2025 and 2035, the market is experiencing varied growth across key countries, led by the United States, which boasts the highest CAGR at 9.3%, fueled by health trends, clean-label demand, and strong innovation from leading brands. Germany follows closely with a 9.0% CAGR, driven by demand for low-sugar, probiotic-rich products and clean-label preferences.
Japan is expanding steadily at 8.1% CAGR, supported by an aging population, functional food trends, and a preference for lighter, portion-controlled servings. France, at 6.5% CAGR, is evolving into a premium market, with consumers drawn to full-fat, organic, and artisan varieties. Meanwhile, the UK shows the slowest growth at 5.2% CAGR, but continues to expand through plant-based innovations, online availability, and sustainability-driven offerings.
The report covers an in-depth analysis of 40+ countries; five top-performing OECD countries are highlighted below.
The USA Greek yogurt market is expanding at a CAGR of 9.3% from 2025 to 2035. Greek yogurt is firmly embedded in American breakfast and snacking routines, driven by active lifestyles, diet trends, and preference for functional nutrition. Brands like Chobani and Danone dominate shelf space, innovating with high-protein, lactose-free, and plant-based varieties.
Distribution is supported by robust retail networks, convenience formats, and strong digital marketing. Growth is further fueled by the popularity of keto and clean-label products. The USA also sees high demand for multipack, portion-controlled formats, especially among working adults and health-conscious youth.
Greek yogurt revenuein Germany is growing at a CAGR of 9.0% through 2035. German consumers prioritize low-sugar, probiotic-rich products with clean-label certifications. The rise in functional and organic diets is encouraging broader adoption of Greek yogurt, especially among aging populations and wellness-focused buyers.
Private-label offerings from large retail chains are expanding, helping price-sensitive customers access premium nutrition. Innovations in flavor and packaging continue to influence purchase patterns. Regulatory alignment with EU health standards supports consistent product quality, further promoting trust and repeat purchase.
Greek yogurt revenue in Japan is expected to grow at a CAGR of 8.1% during 2025 to 2035. The market is growing steadily as functional foods gain traction among health-conscious consumers. Yogurt is increasingly viewed as a digestive aid, making Greek yogurt popular for its high protein and probiotic content.
Japanese consumers show strong preferences for lighter textures, subtle flavors, and portion-controlled servings. This has led to innovation in fusion variants and smaller packaging sizes. Greek yogurt is also marketed as a smart snacking choice and breakfast staple. Retailers are capitalizing on this by expanding their offerings in convenience stores, supermarkets, and specialty outlets.
Sales of Greek yogurt in Franceare expanding at a CAGR of 6.5% between 2025 and 2035.France is evolving into a premium market for Greek yogurt. French consumers are drawn to full-fat, organic, and artisan-style Greek yogurt options that align with the country’s culinary values. Growth is driven by increased awareness of protein intake, digestive health, and clean-label ingredients.
Supermarkets and specialty food stores are giving more space to high-end Greek yogurt products. Product diversificationsuch as fruit-on-the-bottom and layered yogurt cupscaters to local preferences. The rise of health-focused snacking and indulgent yet functional dairy products is helping Greek yogurt become a staple in modern French diets.
Sales of Greek yogurt in the UK are forecasted to grow at a CAGR of 5.2% over 2025 to 2035. The market is expanding quickly with growing interest in high-protein, low-sugar snacking. Busy urban lifestyles and shifting dietary habits are pushing demand for convenient and nutritious yogurt options. Plant-based Greek-style products are also gaining momentum, reflecting evolving ethical and dietary preferences.
Major supermarkets and e-commerce platforms have widened product availability, contributing to national reach. Retail promotions and new product launches, particularly in vanilla and berry flavors, are keeping consumers engaged. The segment is benefiting from sustainability trends too, with brands offering recyclable and eco-friendly packaging formats.
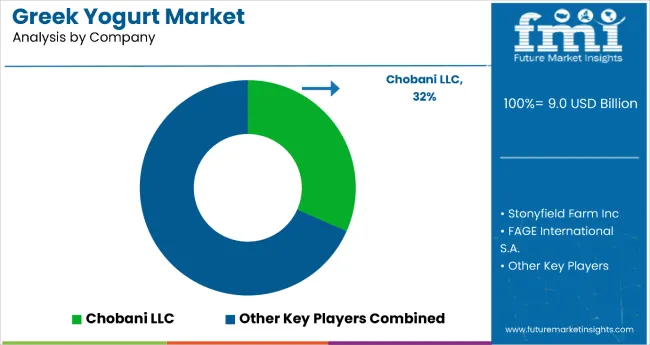
The market is moderately consolidated, with Chobani LLC commanding a leading 32% market share as of 2025. Its dominance stems from robust brand equity, aggressive retail penetration, and continuous product innovation, particularly in high-protein, low-sugar, and plant-based Greek yogurt variants. Chobani’s vertical integration and direct-to-consumer models have also strengthened its market presence globally.
Key players in the Greek yogurt landscape include Danone S.A., General Mills (Yoplait), FAGE International S.A., Nestlé S.A., Siggi’s Dairy, The Kroger Co., Stonyfield Farm (a subsidiary of Lactalis), Trader Joe’s, Aldi, and Meiji Holdings Co. Ltd. These companies compete across product lines including full-fat, non-fat, organic, fruit-layered, lactose-free, and plant-based Greek yogurt formats.
Most players focus on product differentiation, sustainability in packaging, and expanding their flavor portfolios to attract urban, health-conscious, and on-the-go consumers. Private-label brands are also gaining share in mass retail, offering competitive pricing without compromising on nutritional quality.
Key Development inGreek Yogurt Market
In October 2024, Chobani launched its High Protein Greek Yogurt line, featuring cups with 20g protein and drinks with 15g, 20g, or 30g protein, made with natural ingredients, real fruit, and 0g added sugar.
| Item | Value |
|---|---|
| Quantitative Units | USD 9.0 Billion |
| Product Type | Full-Fat Yogurt, De-Fat Yogurt, and Fat-Free Yogurt |
| Flavor | Plain, Strawberry, Blueberry, Vanilla, Others |
| Distribution Channel | Supermarket/Hypermarket, Convenience Stores, Online Stores, and Others (includes specialty stores, departmental stores, health & wellness stores, and direct-to-consumer channels) |
| Package Type | Cups & Tubs, Bottles |
| Nature | Organic, Conventional |
| End-Use | Household, Foodservice Industry |
| Regions Covered | North America, Europe, Asia-Pacific, Latin America, Middle East & Africa |
| Countries Covered | United States, Canada, United Kingdom, Germany, France, China, Japan, South Korea, Brazil, Australia and 40+ countries |
| Key Companies Profiled | Chobani LLC, Stonyfield Farm Inc, FAGE International S.A., GROUPE DANONE, General Mills, Inc., Nestle S.A., Parmalat S.p.A, Muller UK & Ireland Group, The Kroger Co., Wallaby Yogurt Company |
| Additional Attributes | Rising demand for high-protein dairy snacks, increased health consciousness, growth in lactose-free and plant-based yogurt segments |
The global greek yogurt market is estimated to be valued at USD 9.0 billion in 2025.
The market size for the greek yogurt market is projected to reach USD 17.4 billion by 2035.
The greek yogurt market is expected to grow at a 6.8% CAGR between 2025 and 2035.
The key product types in greek yogurt market are cups & tubs and bottles.
In terms of nature, conventional greek yogurt segment to command 62.8% share in the greek yogurt market in 2025.


Our Research Products

The "Full Research Suite" delivers actionable market intel, deep dives on markets or technologies, so clients act faster, cut risk, and unlock growth.

The Leaderboard benchmarks and ranks top vendors, classifying them as Established Leaders, Leading Challengers, or Disruptors & Challengers.

Locates where complements amplify value and substitutes erode it, forecasting net impact by horizon

We deliver granular, decision-grade intel: market sizing, 5-year forecasts, pricing, adoption, usage, revenue, and operational KPIs—plus competitor tracking, regulation, and value chains—across 60 countries broadly.

Spot the shifts before they hit your P&L. We track inflection points, adoption curves, pricing moves, and ecosystem plays to show where demand is heading, why it is changing, and what to do next across high-growth markets and disruptive tech

Real-time reads of user behavior. We track shifting priorities, perceptions of today’s and next-gen services, and provider experience, then pace how fast tech moves from trial to adoption, blending buyer, consumer, and channel inputs with social signals (#WhySwitch, #UX).

Partner with our analyst team to build a custom report designed around your business priorities. From analysing market trends to assessing competitors or crafting bespoke datasets, we tailor insights to your needs.
Supplier Intelligence
Discovery & Profiling
Capacity & Footprint
Performance & Risk
Compliance & Governance
Commercial Readiness
Who Supplies Whom
Scorecards & Shortlists
Playbooks & Docs
Category Intelligence
Definition & Scope
Demand & Use Cases
Cost Drivers
Market Structure
Supply Chain Map
Trade & Policy
Operating Norms
Deliverables
Buyer Intelligence
Account Basics
Spend & Scope
Procurement Model
Vendor Requirements
Terms & Policies
Entry Strategy
Pain Points & Triggers
Outputs
Pricing Analysis
Benchmarks
Trends
Should-Cost
Indexation
Landed Cost
Commercial Terms
Deliverables
Brand Analysis
Positioning & Value Prop
Share & Presence
Customer Evidence
Go-to-Market
Digital & Reputation
Compliance & Trust
KPIs & Gaps
Outputs
Full Research Suite comprises of:
Market outlook & trends analysis
Interviews & case studies
Strategic recommendations
Vendor profiles & capabilities analysis
5-year forecasts
8 regions and 60+ country-level data splits
Market segment data splits
12 months of continuous data updates
DELIVERED AS:
PDF EXCEL ONLINE
Yogurt Powder Market Analysis - Size, Share, and Forecast Outlook 2025 to 2035
Yogurt Dips Market Size, Growth, and Forecast for 2025 to 2035
Yogurt Market Analysis - Size, Share, & Forecast Outlook 2025 to 2035
Yogurt Maker Market – Trends, Growth & Forecast 2025 to 2035
Yogurt Packaging Market Trends – Growth & Demand Forecast 2025 to 2035
Yogurt And Probiotic Drink Market Analysis by Product Type, Source Type, and Region Through 2035
A2 Yogurt Market Trends – Growth, Demand & Innovations
Fenugreek Fiber Market Size and Share Forecast Outlook 2025 to 2035
Market Positioning & Share in Fenugreek Seed Extract Manufacturing
Dry Yogurt Market Outlook - Growth, Demand & Forecast 2025 to 2035
Vegan Yogurt Market Size, Growth, and Forecast for 2025 to 2035
Japan Yogurt Powder Market Analysis by Product Type, Flavor, Nature, Application, End-Use, and Distribution Channel Through 2035
Frozen Yogurt Market Size and Share Forecast Outlook 2025 to 2035
Citrus Yogurt Market Insights – Flavor Trends & Consumer Demand 2025 to 2035
Analysis and Growth Projections for Savory Yogurt Market
Non-GMO yogurt Market Analysis by Product Type, By End use, By Distribution Channel of the and End User Through 2035
Flavored Yogurt Market Analysis by Form, Flavor, End Use and Distribution Channel Through 2035
Non-Dairy Yogurt Market Analysis - Size, Share, and Forecast Outlook 2025 to 2035
Drinkable Yogurt Market Size and Share Forecast Outlook 2025 to 2035
Probiotic Yogurt Market Analysis - Size, Share & Forecast 2025 to 2035

Thank you!
You will receive an email from our Business Development Manager. Please be sure to check your SPAM/JUNK folder too.
Chat With
MaRIA