Fenugreek Fiber Market Size and Share Forecast Outlook 2025 to 2035

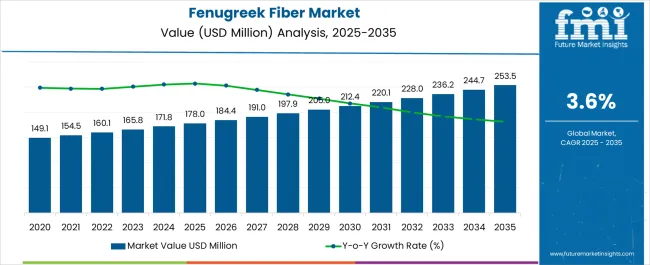
The Fenugreek Fiber Market is estimated to be valued at USD 178.0 million in 2025 and is projected to reach USD 253.5 million by 2035, registering a compound annual growth rate (CAGR) of 3.6% over the forecast period.
Quick Stats for Fenugreek Fiber Market

  • Fenugreek Fiber Market Value (2025): USD 178.0 million
  • Fenugreek Fiber Market Forecast Value (2035): USD 253.5 million
  • Fenugreek Fiber Market Forecast CAGR: 3.6%
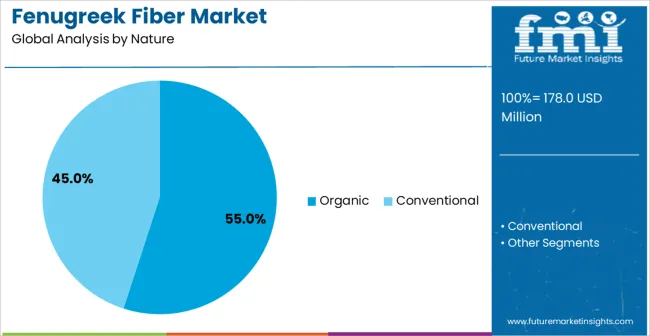
  • Leading Segment in Fenugreek Fiber Market in 2025: Organic (55.0%)
  • Key Growth Regions in Fenugreek Fiber Market: North America, Asia-Pacific, Europe
  • Top Key Players in Fenugreek Fiber Market: Altrafine Gums, Natural Agro Products, Frutarom Health, Nature’s Own, GlucoBliss Pure, Fenu Fiber, GNC Herbal Plus, Nature’s Plus, Wonder Laboratories

Fenugreek Fiber Market Market Value Analysis

Fenugreek Fiber Market Key Takeaways

Metric Value
Fenugreek Fiber Market Estimated Value in (2025 E) USD 178.0 million
Fenugreek Fiber Market Forecast Value in (2035 F) USD 253.5 million
Forecast CAGR (2025 to 2035) 3.6%

Why is the Fenugreek Fiber Market Growing?

Market Overview:

The Fenugreek Fiber market is experiencing steady growth due to its increasing adoption in health-oriented food products, functional foods, and dietary supplements. Rising consumer awareness regarding gut health, digestive wellness, and high-fiber nutrition has been driving demand across both developed and emerging markets. The market is further supported by growing interest in natural and plant-based ingredients, which are being preferred over synthetic alternatives for their perceived health benefits and sustainability.

Manufacturers are focusing on enhancing product availability through diversified distribution channels, including both modern retail and online platforms, to reach a wider consumer base. Additionally, innovation in product formulations and ease of incorporation into multiple food and beverage applications has strengthened market adoption.

With consumers increasingly prioritizing health-conscious diets, Fenugreek Fiber is positioned as a functional ingredient with growing relevance The ongoing expansion of functional food markets, coupled with the trend toward preventive healthcare, is expected to propel market growth in the coming years.

Segmental Analysis

The fenugreek fiber market is segmented by nature, end-use, distribution channel, and geographic regions. By nature, fenugreek fiber market is divided into Organic and Conventional. In terms of end-use, fenugreek fiber market is classified into Food And Beverage, Jelly And Candies, Soups And Spreads, Milkshakes, Ice Cream And Chocolate, Frozen Foods, Bakery Products, Nutraceuticals, Dietary Supplements, and Cosmetic And Personal Care. Based on distribution channel, fenugreek fiber market is segmented into Online Retailers, Wholesalers, Supermarkets, and Specialty Stores. Regionally, the fenugreek fiber industry is classified into North America, Latin America, Western Europe, Eastern Europe, Balkan & Baltic Countries, Russia & Belarus, Central Asia, East Asia, South Asia & Pacific, and the Middle East & Africa.
Insights into the Organic Segment

Fenugreek Fiber Market Analysis By Nature

The Organic segment is projected to hold 55.00% of the Fenugreek Fiber market revenue share in 2025, making it the leading nature-based segment. This prominence is being attributed to the rising consumer preference for clean-label and naturally sourced ingredients.

Organic fenugreek fiber is increasingly preferred due to its minimal processing, higher nutrient retention, and absence of synthetic additives, aligning with the global demand for sustainable and health-oriented food ingredients. Growth has been further facilitated by expanding certification standards, greater consumer trust, and increasing adoption by food and beverage manufacturers who are integrating organic ingredients into functional products.

The segment benefits from the perception of superior safety and quality associated with organic farming practices, which has encouraged repeated purchases and long-term adoption As demand for natural and organic dietary supplements continues to rise, the Organic segment is anticipated to maintain its leading position, supported by consumer-driven trends favoring transparency, environmental responsibility, and functional health benefits.
Insights into the Food and Beverage Segment

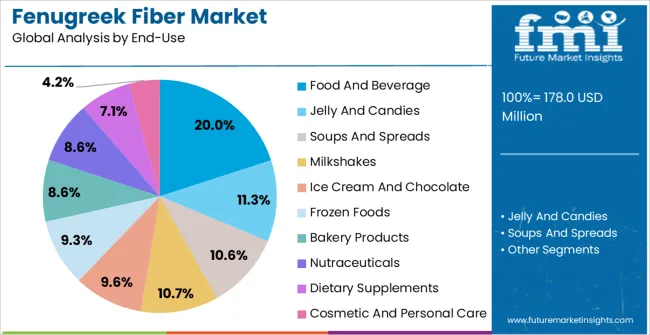
Fenugreek Fiber Market Analysis By End Use

The Food and Beverage end-use industry is expected to account for 20.00% of the Fenugreek Fiber market revenue share in 2025, establishing it as the most significant application segment. The growth of this segment is being driven by the increasing incorporation of fenugreek fiber in functional foods, bakery products, snacks, and nutritional beverages.

Manufacturers are leveraging the fiber’s natural solubility, health benefits, and neutral taste to formulate products that cater to the rising demand for digestive health and weight management solutions. The segment has been further reinforced by evolving consumer preferences for fiber-enriched products that promote satiety, gut health, and overall wellness.

Product versatility and ease of integration into a variety of food matrices have accelerated adoption across the industry With increasing consumer awareness regarding dietary fiber benefits and proactive nutrition, the Food and Beverage segment is expected to maintain a strong market presence and continue driving the demand for fenugreek fiber-based formulations.
Insights into the Online Retailers Segment

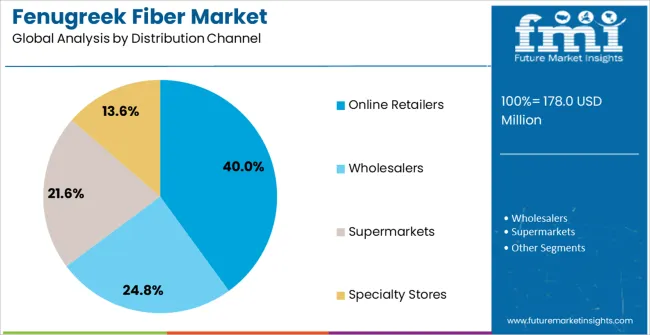
Fenugreek Fiber Market Analysis By Distribution Channel

The Online Retailers distribution channel is anticipated to hold 40.00% of the Fenugreek Fiber market revenue share in 2025, making it the leading channel for product accessibility. This leadership is being driven by the rapid growth of e-commerce platforms and direct-to-consumer sales models, which provide convenience, broader product variety, and home delivery options.

Consumers are increasingly preferring online channels for purchasing dietary fibers and functional food ingredients due to easy price comparison, product reviews, and access to specialty organic products. The segment benefits from the expanding digital infrastructure, improved logistics networks, and the rise of health-conscious consumer behavior, which has encouraged repeated online purchases.

Additionally, manufacturers are leveraging online retail to introduce innovative formulations and target niche consumer segments The Online Retailers segment is expected to continue its dominance as digital adoption accelerates, providing a scalable platform for market expansion and enhanced consumer engagement.

Market Overview

Fenugreek Fiber Market Outlook from (2025 to 2035)

Fenugreek, a plant belonging to the Fabaceae family, is widely used in food preparation in various regions such as Southwest Asia, central Europe, and Africa, owing to its unique flavor. The seeds of fenugreek contain a type of polymer called galactomannans, which is primarily responsible for the plant's fiber content. Galactomannans are produced only by a few select plants, mainly endospermic seeds from the Fabaceae family, including fenugreek seeds, guar, tara, and locust bean. To extract fenugreek fiber, powdered fenugreek seeds are utilized.

Fenugreek fiber is a soluble fiber with high viscosity due to a 1:1 ratio of galactose to mannose present in it. It possesses excellent hydration properties, causing an increase in viscosity when dissolved in water. Moreover, fenugreek fiber has remarkable stability, has a long shelf life, and can withstand baking, cooking, freezing, and frying. Fenugreek fiber is known for its ability to treat various health issues, including constipation, stomach discomfort, obesity, kidney problems, and heartburn. It is particularly beneficial for people with diabetes, as it lowers blood sugar levels and helps in diabetes management.

In our new study, ESOMAR-certified market research and consulting firm Future Market Insights (FMI) offers insights into key factors driving demand for Fenugreek Fiber.
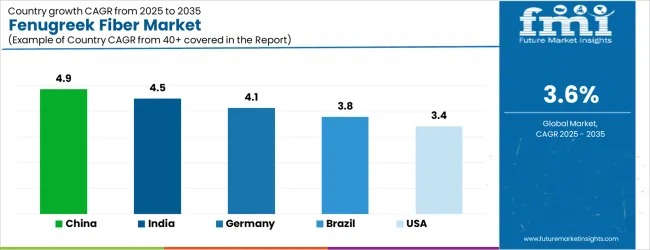
Analysis of Fenugreek Fiber Market By Key Countries

Fenugreek Fiber Market Cagr Analysis By Country

Country CAGR
China 4.9%
India 4.5%
Germany 4.1%
Brazil 3.8%
USA 3.4%
U.K. 3.1%
Japan 2.7%

Country-wise Analysis

The Fenugreek Fiber Market is expected to register a CAGR of 3.6% during the forecast period, exhibiting varied country level momentum. China leads with the highest CAGR of 4.9%, followed by India at 4.5%. Developed markets such as Germany, France, and the U.K. continue to expand steadily, while the U.S. is likely to grow at consistent rates. Japan posts the lowest CAGR at 2.7%, yet still underscores a broadly positive trajectory for the global Fenugreek Fiber Market. In 2024, Germany held a dominant revenue in the Western Europe market and is expected to grow with a CAGR of 4.1%. The U.S. Fenugreek Fiber Market is estimated to be valued at USD 65.6 million in 2025 and is anticipated to reach a valuation of USD 65.6 million by 2035. Sales are projected to rise at a CAGR of 0.0% over the forecast period between 2025 and 2035. While Japan and South Korea markets are estimated to be valued at USD 9.1 million and USD 6.2 million respectively in 2025.
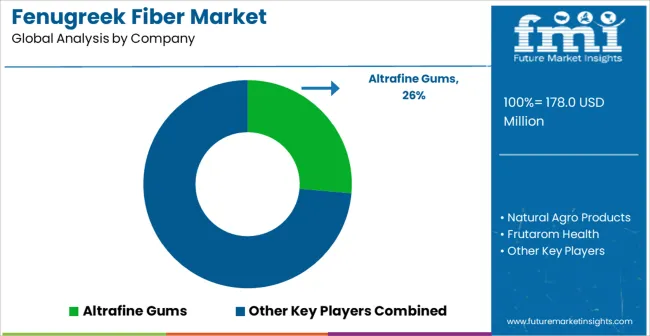
Key Players in the Fenugreek Fiber Market

Fenugreek Fiber Market Analysis By Company

  • Altrafine Gums
  • Natural Agro Products
  • Frutarom Health
  • Nature’s Own
  • GlucoBliss Pure
  • Fenu Fiber
  • GNC Herbal Plus
  • Nature’s Plus
  • Wonder Laboratories

Scope of the Report

Item Value
Quantitative Units USD 178.0 Million
Nature Organic and Conventional
End-Use Food And Beverage, Jelly And Candies, Soups And Spreads, Milkshakes, Ice Cream And Chocolate, Frozen Foods, Bakery Products, Nutraceuticals, Dietary Supplements, and Cosmetic And Personal Care
Distribution Channel Online Retailers, Wholesalers, Supermarkets, and Specialty Stores
Regions Covered North America, Europe, Asia-Pacific, Latin America, Middle East & Africa
Country Covered United States, Canada, Germany, France, United Kingdom, China, Japan, India, Brazil, South Africa
Key Companies Profiled Altrafine Gums, Natural Agro Products, Frutarom Health, Nature’s Own, GlucoBliss Pure, Fenu Fiber, GNC Herbal Plus, Nature’s Plus, and Wonder Laboratories

Fenugreek Fiber Market by Segments

Nature:

  • Organic
  • Conventional

End-Use:

  • Food And Beverage
  • Jelly And Candies
  • Soups And Spreads
  • Milkshakes
  • Ice Cream And Chocolate
  • Frozen Foods
  • Bakery Products
  • Nutraceuticals
  • Dietary Supplements
  • Cosmetic And Personal Care

Distribution Channel:

  • Online Retailers
  • Wholesalers
  • Supermarkets
  • Specialty Stores

Region:

  • North America
    • U.S.
    • Canada
    • Mexico
  • Latin America
    • Brazil
    • Chile
    • Rest of Latin America
  • Western Europe
    • Germany
    • U.K.
    • Italy
    • Spain
    • France
    • Nordic
    • BENELUX
    • Rest of Western Europe
  • Eastern Europe
    • Russia
    • Poland
    • Hungary
    • Balkan & Baltic
    • Rest of Eastern Europe
  • East Asia
    • China
    • Japan
    • South Korea
  • South Asia and Pacific
    • India
    • ASEAN
    • Australia & New Zealand
    • Rest of South Asia and Pacific
  • Middle East & Africa
    • Kingdom of Saudi Arabia
    • Other GCC Countries
    • Turkiye
    • South Africa
    • Other African Union
    • Rest of Middle East & Africa

Frequently Asked Questions

How big is the fenugreek fiber market in 2025?

The global fenugreek fiber market is estimated to be valued at USD 178.0 million in 2025.

What will be the size of fenugreek fiber market in 2035?

The market size for the fenugreek fiber market is projected to reach USD 253.5 million by 2035.

How much will be the fenugreek fiber market growth between 2025 and 2035?

The fenugreek fiber market is expected to grow at a 3.6% CAGR between 2025 and 2035.

What are the key product types in the fenugreek fiber market?

The key product types in fenugreek fiber market are organic and conventional.

Which end-use segment to contribute significant share in the fenugreek fiber market in 2025?

In terms of end-use, food and beverage segment to command 20.0% share in the fenugreek fiber market in 2025.

Table of Content

  1. Executive Summary
    • Global Market Outlook
    • Demand-side Trends
    • Supply-side Trends
    • Technology Roadmap Analysis
    • Analysis and Recommendations
  2. Market Overview
    • Market Coverage / Taxonomy
    • Market Definition / Scope / Limitations
  3. Market Background
    • Market Dynamics
      • Drivers
      • Restraints
      • Opportunity
      • Trends
    • Scenario Forecast
      • Demand in Optimistic Scenario
      • Demand in Likely Scenario
      • Demand in Conservative Scenario
    • Opportunity Map Analysis
    • Product Life Cycle Analysis
    • Supply Chain Analysis
    • Investment Feasibility Matrix
    • Value Chain Analysis
    • PESTLE and Porter’s Analysis
    • Regulatory Landscape
    • Regional Parent Market Outlook
    • Production and Consumption Statistics
    • Import and Export Statistics
  4. Global Market Analysis 2020-2024 and Forecast, 2025-2035
    • Historical Market Size Value (USD Million) Analysis, 2020-2024
    • Current and Future Market Size Value (USD Million) Projections, 2025-2035
      • Y-o-Y Growth Trend Analysis
      • Absolute $ Opportunity Analysis
  5. Global Market Pricing Analysis 2020-2024 and Forecast 2025-2035
  6. Global Market Analysis 2020-2024 and Forecast 2025-2035, By Nature
    • Introduction / Key Findings
    • Historical Market Size Value (USD Million) Analysis By Nature , 2020-2024
    • Current and Future Market Size Value (USD Million) Analysis and Forecast By Nature , 2025-2035
      • Organic
      • Conventional
    • Y-o-Y Growth Trend Analysis By Nature , 2020-2024
    • Absolute $ Opportunity Analysis By Nature , 2025-2035
  7. Global Market Analysis 2020-2024 and Forecast 2025-2035, By End-Use
    • Introduction / Key Findings
    • Historical Market Size Value (USD Million) Analysis By End-Use, 2020-2024
    • Current and Future Market Size Value (USD Million) Analysis and Forecast By End-Use, 2025-2035
      • Food And Beverage
      • Jelly And Candies
      • Soups And Spreads
      • Milkshakes
      • Ice Cream And Chocolate
      • Frozen Foods
      • Bakery Products
      • Nutraceuticals
      • Dietary Supplements
      • Cosmetic And Personal Care
    • Y-o-Y Growth Trend Analysis By End-Use, 2020-2024
    • Absolute $ Opportunity Analysis By End-Use, 2025-2035
  8. Global Market Analysis 2020-2024 and Forecast 2025-2035, By Distribution Channel
    • Introduction / Key Findings
    • Historical Market Size Value (USD Million) Analysis By Distribution Channel, 2020-2024
    • Current and Future Market Size Value (USD Million) Analysis and Forecast By Distribution Channel, 2025-2035
      • Online Retailers
      • Wholesalers
      • Supermarkets
      • Specialty Stores
    • Y-o-Y Growth Trend Analysis By Distribution Channel, 2020-2024
    • Absolute $ Opportunity Analysis By Distribution Channel, 2025-2035
  9. Global Market Analysis 2020-2024 and Forecast 2025-2035, By Region
    • Introduction
    • Historical Market Size Value (USD Million) Analysis By Region, 2020-2024
    • Current Market Size Value (USD Million) Analysis and Forecast By Region, 2025-2035
      • North America
      • Latin America
      • Western Europe
      • Eastern Europe
      • East Asia
      • South Asia and Pacific
      • Middle East & Africa
    • Market Attractiveness Analysis By Region
  10. North America Market Analysis 2020-2024 and Forecast 2025-2035, By Country
    • Historical Market Size Value (USD Million) Trend Analysis By Market Taxonomy, 2020-2024
    • Market Size Value (USD Million) Forecast By Market Taxonomy, 2025-2035
      • By Country
        • U.S.
        • Canada
        • Mexico
      • By Nature
      • By End-Use
      • By Distribution Channel
    • Market Attractiveness Analysis
      • By Country
      • By Nature
      • By End-Use
      • By Distribution Channel
    • Key Takeaways
  11. Latin America Market Analysis 2020-2024 and Forecast 2025-2035, By Country
    • Historical Market Size Value (USD Million) Trend Analysis By Market Taxonomy, 2020-2024
    • Market Size Value (USD Million) Forecast By Market Taxonomy, 2025-2035
      • By Country
        • Brazil
        • Chile
        • Rest of Latin America
      • By Nature
      • By End-Use
      • By Distribution Channel
    • Market Attractiveness Analysis
      • By Country
      • By Nature
      • By End-Use
      • By Distribution Channel
    • Key Takeaways
  12. Western Europe Market Analysis 2020-2024 and Forecast 2025-2035, By Country
    • Historical Market Size Value (USD Million) Trend Analysis By Market Taxonomy, 2020-2024
    • Market Size Value (USD Million) Forecast By Market Taxonomy, 2025-2035
      • By Country
        • Germany
        • U.K.
        • Italy
        • Spain
        • France
        • Nordic
        • BENELUX
        • Rest of Western Europe
      • By Nature
      • By End-Use
      • By Distribution Channel
    • Market Attractiveness Analysis
      • By Country
      • By Nature
      • By End-Use
      • By Distribution Channel
    • Key Takeaways
  13. Eastern Europe Market Analysis 2020-2024 and Forecast 2025-2035, By Country
    • Historical Market Size Value (USD Million) Trend Analysis By Market Taxonomy, 2020-2024
    • Market Size Value (USD Million) Forecast By Market Taxonomy, 2025-2035
      • By Country
        • Russia
        • Poland
        • Hungary
        • Balkan & Baltic
        • Rest of Eastern Europe
      • By Nature
      • By End-Use
      • By Distribution Channel
    • Market Attractiveness Analysis
      • By Country
      • By Nature
      • By End-Use
      • By Distribution Channel
    • Key Takeaways
  14. East Asia Market Analysis 2020-2024 and Forecast 2025-2035, By Country
    • Historical Market Size Value (USD Million) Trend Analysis By Market Taxonomy, 2020-2024
    • Market Size Value (USD Million) Forecast By Market Taxonomy, 2025-2035
      • By Country
        • China
        • Japan
        • South Korea
      • By Nature
      • By End-Use
      • By Distribution Channel
    • Market Attractiveness Analysis
      • By Country
      • By Nature
      • By End-Use
      • By Distribution Channel
    • Key Takeaways
  15. South Asia and Pacific Market Analysis 2020-2024 and Forecast 2025-2035, By Country
    • Historical Market Size Value (USD Million) Trend Analysis By Market Taxonomy, 2020-2024
    • Market Size Value (USD Million) Forecast By Market Taxonomy, 2025-2035
      • By Country
        • India
        • ASEAN
        • Australia & New Zealand
        • Rest of South Asia and Pacific
      • By Nature
      • By End-Use
      • By Distribution Channel
    • Market Attractiveness Analysis
      • By Country
      • By Nature
      • By End-Use
      • By Distribution Channel
    • Key Takeaways
  16. Middle East & Africa Market Analysis 2020-2024 and Forecast 2025-2035, By Country
    • Historical Market Size Value (USD Million) Trend Analysis By Market Taxonomy, 2020-2024
    • Market Size Value (USD Million) Forecast By Market Taxonomy, 2025-2035
      • By Country
        • Kingdom of Saudi Arabia
        • Other GCC Countries
        • Turkiye
        • South Africa
        • Other African Union
        • Rest of Middle East & Africa
      • By Nature
      • By End-Use
      • By Distribution Channel
    • Market Attractiveness Analysis
      • By Country
      • By Nature
      • By End-Use
      • By Distribution Channel
    • Key Takeaways
  17. Key Countries Market Analysis
    • U.S.
      • Pricing Analysis
      • Market Share Analysis, 2024
        • By Nature
        • By End-Use
        • By Distribution Channel
    • Canada
      • Pricing Analysis
      • Market Share Analysis, 2024
        • By Nature
        • By End-Use
        • By Distribution Channel
    • Mexico
      • Pricing Analysis
      • Market Share Analysis, 2024
        • By Nature
        • By End-Use
        • By Distribution Channel
    • Brazil
      • Pricing Analysis
      • Market Share Analysis, 2024
        • By Nature
        • By End-Use
        • By Distribution Channel
    • Chile
      • Pricing Analysis
      • Market Share Analysis, 2024
        • By Nature
        • By End-Use
        • By Distribution Channel
    • Germany
      • Pricing Analysis
      • Market Share Analysis, 2024
        • By Nature
        • By End-Use
        • By Distribution Channel
    • U.K.
      • Pricing Analysis
      • Market Share Analysis, 2024
        • By Nature
        • By End-Use
        • By Distribution Channel
    • Italy
      • Pricing Analysis
      • Market Share Analysis, 2024
        • By Nature
        • By End-Use
        • By Distribution Channel
    • Spain
      • Pricing Analysis
      • Market Share Analysis, 2024
        • By Nature
        • By End-Use
        • By Distribution Channel
    • France
      • Pricing Analysis
      • Market Share Analysis, 2024
        • By Nature
        • By End-Use
        • By Distribution Channel
    • India
      • Pricing Analysis
      • Market Share Analysis, 2024
        • By Nature
        • By End-Use
        • By Distribution Channel
    • ASEAN
      • Pricing Analysis
      • Market Share Analysis, 2024
        • By Nature
        • By End-Use
        • By Distribution Channel
    • Australia & New Zealand
      • Pricing Analysis
      • Market Share Analysis, 2024
        • By Nature
        • By End-Use
        • By Distribution Channel
    • China
      • Pricing Analysis
      • Market Share Analysis, 2024
        • By Nature
        • By End-Use
        • By Distribution Channel
    • Japan
      • Pricing Analysis
      • Market Share Analysis, 2024
        • By Nature
        • By End-Use
        • By Distribution Channel
    • South Korea
      • Pricing Analysis
      • Market Share Analysis, 2024
        • By Nature
        • By End-Use
        • By Distribution Channel
    • Russia
      • Pricing Analysis
      • Market Share Analysis, 2024
        • By Nature
        • By End-Use
        • By Distribution Channel
    • Poland
      • Pricing Analysis
      • Market Share Analysis, 2024
        • By Nature
        • By End-Use
        • By Distribution Channel
    • Hungary
      • Pricing Analysis
      • Market Share Analysis, 2024
        • By Nature
        • By End-Use
        • By Distribution Channel
    • Kingdom of Saudi Arabia
      • Pricing Analysis
      • Market Share Analysis, 2024
        • By Nature
        • By End-Use
        • By Distribution Channel
    • Turkiye
      • Pricing Analysis
      • Market Share Analysis, 2024
        • By Nature
        • By End-Use
        • By Distribution Channel
    • South Africa
      • Pricing Analysis
      • Market Share Analysis, 2024
        • By Nature
        • By End-Use
        • By Distribution Channel
  18. Market Structure Analysis
    • Competition Dashboard
    • Competition Benchmarking
    • Market Share Analysis of Top Players
      • By Regional
      • By Nature
      • By End-Use
      • By Distribution Channel
  19. Competition Analysis
    • Competition Deep Dive
      • Altrafine Gums
        • Overview
        • Product Portfolio
        • Profitability by Market Segments (Product/Age /Sales Channel/Region)
        • Sales Footprint
        • Strategy Overview
          • Marketing Strategy
          • Product Strategy
          • Channel Strategy
      • Natural Agro Products
      • Frutarom Health
      • Nature’s Own
      • GlucoBliss Pure
      • Fenu Fiber
      • GNC Herbal Plus
      • Nature’s Plus
      • Wonder Laboratories
  20. Assumptions & Acronyms Used
  21. Research Methodology

List of Tables

  • Table 1: Global Market Value (USD Million) Forecast by Region, 2020-2035
  • Table 2: Global Market Value (USD Million) Forecast by Nature , 2020-2035
  • Table 3: Global Market Value (USD Million) Forecast by End-Use, 2020-2035
  • Table 4: Global Market Value (USD Million) Forecast by Distribution Channel, 2020-2035
  • Table 5: North America Market Value (USD Million) Forecast by Country, 2020-2035
  • Table 6: North America Market Value (USD Million) Forecast by Nature , 2020-2035
  • Table 7: North America Market Value (USD Million) Forecast by End-Use, 2020-2035
  • Table 8: North America Market Value (USD Million) Forecast by Distribution Channel, 2020-2035
  • Table 9: Latin America Market Value (USD Million) Forecast by Country, 2020-2035
  • Table 10: Latin America Market Value (USD Million) Forecast by Nature , 2020-2035
  • Table 11: Latin America Market Value (USD Million) Forecast by End-Use, 2020-2035
  • Table 12: Latin America Market Value (USD Million) Forecast by Distribution Channel, 2020-2035
  • Table 13: Western Europe Market Value (USD Million) Forecast by Country, 2020-2035
  • Table 14: Western Europe Market Value (USD Million) Forecast by Nature , 2020-2035
  • Table 15: Western Europe Market Value (USD Million) Forecast by End-Use, 2020-2035
  • Table 16: Western Europe Market Value (USD Million) Forecast by Distribution Channel, 2020-2035
  • Table 17: Eastern Europe Market Value (USD Million) Forecast by Country, 2020-2035
  • Table 18: Eastern Europe Market Value (USD Million) Forecast by Nature , 2020-2035
  • Table 19: Eastern Europe Market Value (USD Million) Forecast by End-Use, 2020-2035
  • Table 20: Eastern Europe Market Value (USD Million) Forecast by Distribution Channel, 2020-2035
  • Table 21: East Asia Market Value (USD Million) Forecast by Country, 2020-2035
  • Table 22: East Asia Market Value (USD Million) Forecast by Nature , 2020-2035
  • Table 23: East Asia Market Value (USD Million) Forecast by End-Use, 2020-2035
  • Table 24: East Asia Market Value (USD Million) Forecast by Distribution Channel, 2020-2035
  • Table 25: South Asia and Pacific Market Value (USD Million) Forecast by Country, 2020-2035
  • Table 26: South Asia and Pacific Market Value (USD Million) Forecast by Nature , 2020-2035
  • Table 27: South Asia and Pacific Market Value (USD Million) Forecast by End-Use, 2020-2035
  • Table 28: South Asia and Pacific Market Value (USD Million) Forecast by Distribution Channel, 2020-2035
  • Table 29: Middle East & Africa Market Value (USD Million) Forecast by Country, 2020-2035
  • Table 30: Middle East & Africa Market Value (USD Million) Forecast by Nature , 2020-2035
  • Table 31: Middle East & Africa Market Value (USD Million) Forecast by End-Use, 2020-2035
  • Table 32: Middle East & Africa Market Value (USD Million) Forecast by Distribution Channel, 2020-2035

List of Figures

  • Figure 1: Global Market Pricing Analysis
  • Figure 2: Global Market Value (USD Mn) Forecast 2020–2035
  • Figure 3: Global Market Value Share and BPS Analysis by Nature , 2025 and 2035
  • Figure 4: Global Market Y-o-Y Growth Comparison by Nature , 2025 to 2035
  • Figure 5: Global Market Attractiveness Analysis by Nature
  • Figure 6: Global Market Value Share and BPS Analysis by End-Use, 2025 and 2035
  • Figure 7: Global Market Y-o-Y Growth Comparison by End-Use, 2025 to 2035
  • Figure 8: Global Market Attractiveness Analysis by End-Use
  • Figure 9: Global Market Value Share and BPS Analysis by Distribution Channel, 2025 and 2035
  • Figure 10: Global Market Y-o-Y Growth Comparison by Distribution Channel, 2025 to 2035
  • Figure 11: Global Market Attractiveness Analysis by Distribution Channel
  • Figure 12: Global Market Value (USD Mn) Share and BPS Analysis by Region, 2025 and 2035
  • Figure 13: Global Market Y-o-Y Growth Comparison by Region, 2025 to 2035
  • Figure 14: Global Market Attractiveness Analysis by Region
  • Figure 15: North America Market Incremental Dollar Opportunity, 2025 to 2035
  • Figure 16: Latin America Market Incremental Dollar Opportunity, 2025 to 2035
  • Figure 17: Western Europe Market Incremental Dollar Opportunity, 2025 to 2035
  • Figure 18: Eastern Europe Market Incremental Dollar Opportunity, 2025 to 2035
  • Figure 19: East Asia Market Incremental Dollar Opportunity, 2025 to 2035
  • Figure 20: South Asia and Pacific Market Incremental Dollar Opportunity, 2025 to 2035
  • Figure 21: Middle East & Africa Market Incremental Dollar Opportunity, 2025 to 2035
  • Figure 22: North America Market Value Share and BPS Analysis by Country, 2025 and 2035
  • Figure 23: North America Market Value Share and BPS Analysis by Nature , 2025 and 2035
  • Figure 24: North America Market Y-o-Y Growth Comparison by Nature , 2025 to 2035
  • Figure 25: North America Market Attractiveness Analysis by Nature
  • Figure 26: North America Market Value Share and BPS Analysis by End-Use, 2025 and 2035
  • Figure 27: North America Market Y-o-Y Growth Comparison by End-Use, 2025 to 2035
  • Figure 28: North America Market Attractiveness Analysis by End-Use
  • Figure 29: North America Market Value Share and BPS Analysis by Distribution Channel, 2025 and 2035
  • Figure 30: North America Market Y-o-Y Growth Comparison by Distribution Channel, 2025 to 2035
  • Figure 31: North America Market Attractiveness Analysis by Distribution Channel
  • Figure 32: Latin America Market Value Share and BPS Analysis by Country, 2025 and 2035
  • Figure 33: Latin America Market Value Share and BPS Analysis by Nature , 2025 and 2035
  • Figure 34: Latin America Market Y-o-Y Growth Comparison by Nature , 2025 to 2035
  • Figure 35: Latin America Market Attractiveness Analysis by Nature
  • Figure 36: Latin America Market Value Share and BPS Analysis by End-Use, 2025 and 2035
  • Figure 37: Latin America Market Y-o-Y Growth Comparison by End-Use, 2025 to 2035
  • Figure 38: Latin America Market Attractiveness Analysis by End-Use
  • Figure 39: Latin America Market Value Share and BPS Analysis by Distribution Channel, 2025 and 2035
  • Figure 40: Latin America Market Y-o-Y Growth Comparison by Distribution Channel, 2025 to 2035
  • Figure 41: Latin America Market Attractiveness Analysis by Distribution Channel
  • Figure 42: Western Europe Market Value Share and BPS Analysis by Country, 2025 and 2035
  • Figure 43: Western Europe Market Value Share and BPS Analysis by Nature , 2025 and 2035
  • Figure 44: Western Europe Market Y-o-Y Growth Comparison by Nature , 2025 to 2035
  • Figure 45: Western Europe Market Attractiveness Analysis by Nature
  • Figure 46: Western Europe Market Value Share and BPS Analysis by End-Use, 2025 and 2035
  • Figure 47: Western Europe Market Y-o-Y Growth Comparison by End-Use, 2025 to 2035
  • Figure 48: Western Europe Market Attractiveness Analysis by End-Use
  • Figure 49: Western Europe Market Value Share and BPS Analysis by Distribution Channel, 2025 and 2035
  • Figure 50: Western Europe Market Y-o-Y Growth Comparison by Distribution Channel, 2025 to 2035
  • Figure 51: Western Europe Market Attractiveness Analysis by Distribution Channel
  • Figure 52: Eastern Europe Market Value Share and BPS Analysis by Country, 2025 and 2035
  • Figure 53: Eastern Europe Market Value Share and BPS Analysis by Nature , 2025 and 2035
  • Figure 54: Eastern Europe Market Y-o-Y Growth Comparison by Nature , 2025 to 2035
  • Figure 55: Eastern Europe Market Attractiveness Analysis by Nature
  • Figure 56: Eastern Europe Market Value Share and BPS Analysis by End-Use, 2025 and 2035
  • Figure 57: Eastern Europe Market Y-o-Y Growth Comparison by End-Use, 2025 to 2035
  • Figure 58: Eastern Europe Market Attractiveness Analysis by End-Use
  • Figure 59: Eastern Europe Market Value Share and BPS Analysis by Distribution Channel, 2025 and 2035
  • Figure 60: Eastern Europe Market Y-o-Y Growth Comparison by Distribution Channel, 2025 to 2035
  • Figure 61: Eastern Europe Market Attractiveness Analysis by Distribution Channel
  • Figure 62: East Asia Market Value Share and BPS Analysis by Country, 2025 and 2035
  • Figure 63: East Asia Market Value Share and BPS Analysis by Nature , 2025 and 2035
  • Figure 64: East Asia Market Y-o-Y Growth Comparison by Nature , 2025 to 2035
  • Figure 65: East Asia Market Attractiveness Analysis by Nature
  • Figure 66: East Asia Market Value Share and BPS Analysis by End-Use, 2025 and 2035
  • Figure 67: East Asia Market Y-o-Y Growth Comparison by End-Use, 2025 to 2035
  • Figure 68: East Asia Market Attractiveness Analysis by End-Use
  • Figure 69: East Asia Market Value Share and BPS Analysis by Distribution Channel, 2025 and 2035
  • Figure 70: East Asia Market Y-o-Y Growth Comparison by Distribution Channel, 2025 to 2035
  • Figure 71: East Asia Market Attractiveness Analysis by Distribution Channel
  • Figure 72: South Asia and Pacific Market Value Share and BPS Analysis by Country, 2025 and 2035
  • Figure 73: South Asia and Pacific Market Value Share and BPS Analysis by Nature , 2025 and 2035
  • Figure 74: South Asia and Pacific Market Y-o-Y Growth Comparison by Nature , 2025 to 2035
  • Figure 75: South Asia and Pacific Market Attractiveness Analysis by Nature
  • Figure 76: South Asia and Pacific Market Value Share and BPS Analysis by End-Use, 2025 and 2035
  • Figure 77: South Asia and Pacific Market Y-o-Y Growth Comparison by End-Use, 2025 to 2035
  • Figure 78: South Asia and Pacific Market Attractiveness Analysis by End-Use
  • Figure 79: South Asia and Pacific Market Value Share and BPS Analysis by Distribution Channel, 2025 and 2035
  • Figure 80: South Asia and Pacific Market Y-o-Y Growth Comparison by Distribution Channel, 2025 to 2035
  • Figure 81: South Asia and Pacific Market Attractiveness Analysis by Distribution Channel
  • Figure 82: Middle East & Africa Market Value Share and BPS Analysis by Country, 2025 and 2035
  • Figure 83: Middle East & Africa Market Value Share and BPS Analysis by Nature , 2025 and 2035
  • Figure 84: Middle East & Africa Market Y-o-Y Growth Comparison by Nature , 2025 to 2035
  • Figure 85: Middle East & Africa Market Attractiveness Analysis by Nature
  • Figure 86: Middle East & Africa Market Value Share and BPS Analysis by End-Use, 2025 and 2035
  • Figure 87: Middle East & Africa Market Y-o-Y Growth Comparison by End-Use, 2025 to 2035
  • Figure 88: Middle East & Africa Market Attractiveness Analysis by End-Use
  • Figure 89: Middle East & Africa Market Value Share and BPS Analysis by Distribution Channel, 2025 and 2035
  • Figure 90: Middle East & Africa Market Y-o-Y Growth Comparison by Distribution Channel, 2025 to 2035
  • Figure 91: Middle East & Africa Market Attractiveness Analysis by Distribution Channel
  • Figure 92: Global Market – Tier Structure Analysis
  • Figure 93: Global Market – Company Share Analysis
Dashboard
Dashboard
Dashboard
Dashboard
Dashboard
Dashboard

Full Research Suite comprises of:

Market outlook & trends analysis

Market outlook & trends analysis

Interviews & case studies

Interviews & case studies

Strategic recommendations

Strategic recommendations

Vendor profiles & capabilities analysis

Vendor profiles & capabilities analysis

5-year forecasts

5-year forecasts

8 regions and 60+ country-level data splits

8 regions and 60+ country-level data splits

Market segment data splits

Market segment data splits

12 months of continuous data updates

12 months of continuous data updates

DELIVERED AS:

PDF EXCEL ONLINE

Full Research Suite


$3500

$5000

$6500

Buy Report Now
Similar Industry Reports

Similar Industry Reports

Fenugreek Seed Extract Market Share Analysis

Market Positioning & Share in Fenugreek Seed Extract Manufacturing

Fiber Optic Tester Market

Fiber Optic Tester Market Size and Share Forecast Outlook 2025 to 2035

Fiber Laser Market
Fiber Laser Market

Fiber Laser Market Size and Share Forecast Outlook 2025 to 2035

Fiberglass Market
Fiberglass Market

Fiberglass Market Size and Share Forecast Outlook 2025 to 2035

Fiber Spinning Equipment Market

Fiber Spinning Equipment Market Size and Share Forecast Outlook 2025 to 2035

Fiber Reinforced Plastic (FRP) Panels & Sheets Market

Fiber Reinforced Plastic (FRP) Panels & Sheets Market Size and Share Forecast Outlook 2025 to 2035

Fiberglass Fabric Market

Fiberglass Fabric Market Size and Share Forecast Outlook 2025 to 2035

Fiber Optic Connectivity Market

Fiber Optic Connectivity Market Size and Share Forecast Outlook 2025 to 2035

Fiber Optic Collimating Lens Market

Fiber Optic Collimating Lens Market Size and Share Forecast Outlook 2025 to 2035

Fiberglass Duct Wrap Insulation Market

Fiberglass Duct Wrap Insulation Market Size and Share Forecast Outlook 2025 to 2035

Fiber-Based Blister Pack Market

Fiber-Based Blister Pack Market Analysis - Size and Share Forecast Outlook 2025 to 2035

Fiber Optics Testing Market

Fiber Optics Testing Market Size and Share Forecast Outlook 2025 to 2035

Fiber Laser Coding System Market

Fiber Laser Coding System Market Size and Share Forecast Outlook 2025 to 2035

Fiber Optics Market
Fiber Optics Market

Fiber Optics Market Size and Share Forecast Outlook 2025 to 2035

Fiber Reinforced Polymer (FRP) Rebars Market

Fiber Reinforced Polymer (FRP) Rebars Market Size and Share Forecast Outlook 2025 to 2035

Fiber Supplements Market

Fiber Supplements Market Size and Share Forecast Outlook 2025 to 2035

Fiberglass Filters Market

Fiberglass Filters Market Size and Share Forecast Outlook 2025 to 2035

Fiber Optic Test Equipment Market

Fiber Optic Test Equipment Market Outlook - Size, Share & Forecast 2025 to 2035

Fiberglass Light Poles Market

Fiberglass Light Poles Market Size and Share Forecast Outlook 2025 to 2035

Fiberboard Packaging Market

Fiberboard Packaging Market Size and Share Forecast Outlook 2025 to 2035

Future Market Insights

Fenugreek Fiber Market

Chat With MaRIA

Chat With

MaRIA

Hi There, I am MaRIA, Your Market Research Intelligence Assistant. How may I help you?