Reports

- Global Locations -

Headquarters

Future Market Insights, Inc.

Christiana Corporate, 200
Continental Drive, Suite 401,
Newark, Delaware - 19713,
United States

T: +1-845-579-5705

Americas

Future Market Insights, Inc.

616 Corporate Way, Suite 2-9018,
Valley Cottage, NY 10989, United States

T: +1-347-918-3531

MEA

Future Market Insights

1602-6 Jumeirah Bay X2 Tower, Plot No: JLT-PH2-X2A,
Jumeirah Lakes Towers, Dubai,
United Arab Emirates

Europe

Future Market Insights

3rd Floor, 207 Regent Street,
W1B 3HH London
United Kingdom

T: + 44 (0) 20 8123 9659
D: +44 (0) 20 3287 4268

Asia Pacific

Future Market Insights

IndiaLand Global Tech Park, Unit UG-1, Behind Grand HighStreet, Phase 1, Hinjawadi, MH, Pune – 411057, India

About the Report

Steady increase in consumer awareness levels about ethics of producing animal-based foods & beverages, and the impact of animal husbandry on the environment are key factors that are driving demand for plant-based butter. Further, the surging vegan and vegetarian global population, and the culinary importance of butter is creating a surge in shelf space and retail sales in the market. The wide range of plant-based dairy sources and the associated flavor profiles, positively influence growth of the market, appealing to a wider consumer demographic.

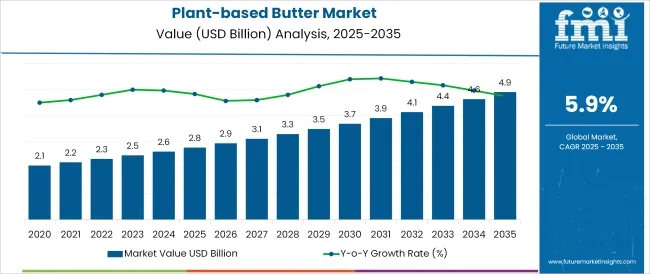
 According to a new report from ESOMAR-certified market research and consulting firm Future Market Insights (FMI), the global plant-based butter market surpassed US$ 2.4 Bn in 2020. The market study has tracked demand in more than 20 countries, with a comprehensive section on the effects of the covid-19 pandemic on the industry.

Don't pay for what you don't need

Customize your report by selecting specific countries or regions and save 30%!

Historical Sales and Future Outlook on Plant-based Butter Market

In the recent past between 2015 and 2019, the plant-based butter market has grown steadily. According to FMI report, during this period dairy volumes slumped by around 300 million gallons. On the other hand, the consumption of plant-based alternatives went up by around 50 million gallons. This trend has continued post 2019 and is likely to rise through 2030.

While the covid-19 outbreak is expected to slow down growth, the market will witness steady growth post 2021 to reach an estimated US$ 5.1 Bn valuation by the end of 2030. North America, led by the United States will have a major role to play in future growth. According to the Good Food Institute, dollar sales of plant-based foods have increased by 29% in the past 2 years, creating a favorable environment for plant-based butter sales.

Why is Plant-based Food Industry Focusing on Flexitarian Consumers?

While plant-based butter products are largely aimed towards vegans and vegetarians, flexitarians are rapidly emerging as a major consumer group. According to the Food Industry Association, around a third of all households hold at least one vegan, vegetarian, flexitarian, or pescatarian. However, only 5% of households adhere strictly to animal-free diets.

The Food Industry Association report states that more than 10% of all Gen Z, Gen X, and millennial consumers adhere to a flexitarian diet. On the other hand, only around 5% of older boomer demographics are flexitarians. Consequently, with the increased interest in plant-based food products, plant-based alternatives have risen by more than 19% between 2018 and 2019. This trend is projected to aid growth in the market through the forecast period.

Nandini Roy Choudhury

Principal Consultant

Talk to Analyst

Find your sweet spots for generating winning opportunities in this market.

How has Home Cooking Influenced Sales of Plant-based Butter?

As per Virginia-based FMI Foundation, a non-profit organization on nutrition, health, and food, 40% of the American population has increased cooking activities following the covid-19 pandemic. Restrictions on the food service sector has made home cooking a viable option, creating opportunities for plant-based butter sales.

According to the United States Census Bureau, nearly 50% of households have reported a loss income during the pandemic. As per the European Commission disposable income levels have dropped by over 700 euros in 2020. Consequently, home cooking is becoming more popular as an option for savings. This will create potential revenue generation opportunities during this period.

Why are Nutritional Profiles Gaining Traction?

Consumption of conventional butter has widely been associated with obesity, heart disease and other ailments. As per a report by Switch4Good, a health awareness non-profit organization, a tablespoon of butter accounts for more than 30% of the daily recommended saturated fat in a 2000 calorie diet.

Also, a 2018 study by the United States Department of Health and Human Services has stated that high fat diets can also result in alternation of red blood cells, and immunity cells aside from heart disease. This will create opportunities for clean label, organic plant-based butter alternatives, which are characterized by lower fat levels.

Get the data you need at a Fraction of the cost

Personalize your report by choosing insights you need
and save 40%!

What Challenges Does Plant-based Food Face as a Category?

The global market for plant-based butter is steadily becoming mainstream, as supply chains are more resilient in comparison to that of industrial animal agriculture. However, participants in the industry are likely to face challenges that affect the potential for growth through the forecast period.

For instance, the costs of producing conventional plant-based butter and the resultant pricing is expected to be higher than that of conventional butter alternatives. This will limit adoption rates for the foreseeable future.

Also, the plant-based butter industry is largely reliant on the yields of vegetable and nuts. The fluctuation of yields and prices of these raw materials owing to environmental factors is also a challenge to market players in the industry.
Region-wise Insights

United States Plant-based Butter Market

North America is a major market for plant-based butter products and is projected to account for more than 35% of the global market share by the end of the forecast period in 2030. The United States holds the lead with a valuation of approximately US$ 200 million.

Plant-based Butter Market

According to a report by the Good Food Institute, the sales of plant-based butter in the United States has jumped by 15% between 2017 and 2019. The report also states that sales of plant -based products have surpassed animal based alternatives in meat and dairy sectors following the advent of the covid-19 pandemic.

A study by Cornell University has also found that more than 10% of the overall American population is lactose intolerant. This factor will also support the adoption of plant-based butter in North America through the forecast period.

Will Plant-based Butter Sales Benefit from UK’s Growing Veganism Trend?

According to the Vegan Society, the number of vegans has gone up four times between 2014 and 2019. Also, in 2018 UK launched the highest number of vegan products in comparison to any other nation. Also, the UK's sales and consumption of vegan butter, milk, margarine, cheese, and ready meals have become the highest in Europe.

The Vegan Society has also stated that the UK plant-based milk sector was worth more than 320 million in 2019, accounting for more than 15% of the overall European market share. This figure is projected to more than double with a CAGR of close to 14% through 2025. This is likely to create a highly favorable environment for the expansion of plant-based butter producers in the country.

According to FarmingUK, dairy farmers in the U.K. were hit by a 50 percent slump in profits from milk sales between 2018 to 2019, with a quarter of Brits now opting for plant-based dairy products, including butter. However, the covid-19 pandemic has created challenges for manufacturers. As per the Journal of Food Science and Technology, dairy-free products reflected a growth rate of less than 1% between late 2019 and early 2020.

Bullish Plant-based Butter Sales in France

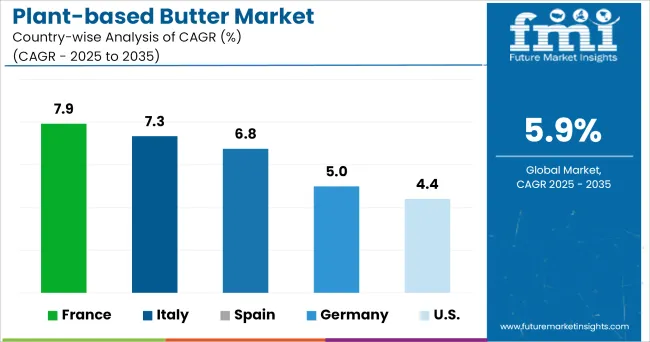
As per the Association Végétarienne de France, plant-based dairy products are most commonly consumed in the UK and Belgium, with France being among the lowest at around 40%, attributed to general consumer preference for conventional milk-based options.

However, France has been facing a crisis in terms of conventional butter stocks. 30% of demand for butter in French supermarkets was not met in October 2020. Also, butter prices have tripled between 2016 and 2020 reaching a valuation of 7,000 euros per ton. According to the FNPL milk-producers federation, the issue can be largely attributed to a price war occurring among French retailers.

This is a key factor that is likely to generate opportunities for growth in the plant-based butter sector in the near term. According to Mercy for Animals, a 17% annual growth of plant-based products is expected between 2019 and 2021 in France, creating a favorable atmosphere for the industry.

How will Plant-based Butter Demand Fare in Germany?

As per a USDA report, 15 percent of all new vegan food and beverage product launches for 2017-18 took place in Germany. As per Proveg International the country is home to around 1.3 million vegans, and approximately 8 million vegetarians. The USDA report has also stated that around 70 % of German households would like to see a larger variety of vegetarian products in supermarkets, with close to two-thirds purchasing vegan and vegetarian products intentionally.

Further, the projected growth of dairy alternatives product sales between 2019-2024 is expected to be more than 7% CAGR, and plant-based milk accounted for 15 percent of the overall milk sales in 2018. According to a study by Veganz, 30% of Germany’s population is flexitarian. These factors are likely to generate favorable conditions for long-term growth of the plant-based butter industry in Germany.

Are Spanish Consumers Ready for Plant-based Butter?

As per a report by the Irish Food Board, lactose-free products are gaining ground in Spain with close to 35% of the country’s population suffering from lactose intolerance, which is among the highest numbers in European countries.

Further, a report from the USDA has stated that retail sales of free-from products in Spain reached a value of US$ 1.2 billion in 2018, which was a 12% increase over the previous year. Also, the free-from dairy retail value sales went up by 17% in 2018. The Green Revolution has stated that food stores and restaurants catering to vegans and vegetarians has doubled between 2016 and 2019.

According to WhiteWave Foods, Spain has emerged as a key market for non-dairy alternatives, with soy-milk being the primary source, while almond and oats reflecting stronger growth. Also, 2% of the country’s population is vegan or vegetarian, while flexitarians account for 8%. This bodes well for the future of the country’s plant-based butter industry.

Italy’s Shift-away from Meat an Influencer for Plant-based Industry

According to the Vegan Society, close to 50% of all Italian consumers have stated an interest in lowering meat intakes, with close a quarter pushing to increase consumption of vegetarian processed foods in daily diets. Also, Vegan Society has also indicated that Italy has the fastest growing population of animal-free consumers.

A report by the European Data Journalism Network, the population of Italian vegans, albeit small at 3%, nearly doubled between 2016 and 2018. Also, a report by the National Library of Medicine Northern and Southern Italy populations reflect 52% and 41% lactose malabsorption cases, while central Italy accounts for only 19%. These trends are likely to have significant influence on the prospects of plant-based butter purchases in the country.

Has ‘Plant-based’ Really Caught Up in Indo-China?

According to the Good Food Institute, the growth of plant-based product sales has surpassed that of animal-based products in China in terms of dairy and meat products. As per Health Ingredients China, Asian consumers, of which the Chinese comprise a large percentage, are prioritizing healthy food choices, with approximately 90% of Asians being lactose intolerant.

Also, the adoption of vegan labeling on food packaging has increased by more than 400% between 2016 and 2018. Health Ingredients China has also stated that between 2015 and 2017, the sales of plant-based milk rose in the country by 17%. According to the Xinhua News Agency, the Chinese vegan population has surpassed 50 million individuals.

Also, the Chinese government has set up standards for plant-based dairy including the GB/T 10789-2015 General Standard for Beverages which provides details on the different standards used in different plant milks: GB/T 31325-2014 for walnut milk, QB/T 2439 for peanut milk, and GB/T 30885-2014 among others. These factors are likely to aid China as a high potential market for plant-based market in the near future.

According to the Census data from the government of India, around 30% of the country’s population is either vegan or vegetarian. On the other hand, a substantial percentage of this demographic is lacto-vegetarian, with the consumption of milk products. These trends are likely to influence the sales of plant-based butter products.

Some of the prominent brands in India offering plant-based butters include Dakini Health Foods, i2Cook, and JUS’ AMAZIN Seed who have launched sesame, sunflower, peanut, cashew, and almond-based butter offerings.

While higher levels of health awareness among the Indian population will prove beneficial, the higher costs of vegan products in the country are likely to hold back growth of the plan based butter industry in the near term.

Category-wise Analysis

What are the Commercial Prospects of Soy Milk as a Source?

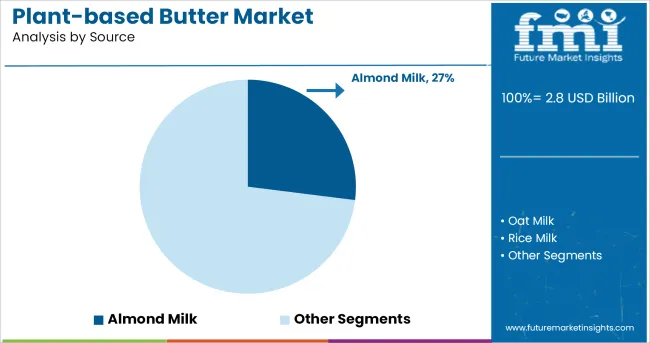
Plant-based butter can be sourced from oat milk, rice milk, corn milk, soy milk, pea milk, almond milk, coconut milk, cashew milk, flax milk, and hemp milk. Of these soy milk will account for major market share, holding more than 40% of the overall market share in 2020.

Easy access to soy raw materials and significant cultivation efforts around the world result in low costs and prices, which is a key factor likely to drive demand throughout the assessment period. Almond milk is also witnessing strong growth, supported by a favorable flavor profile and higher consumer preference.

What Percentage of Plant-based Butter Sales Occur through Online Mode?

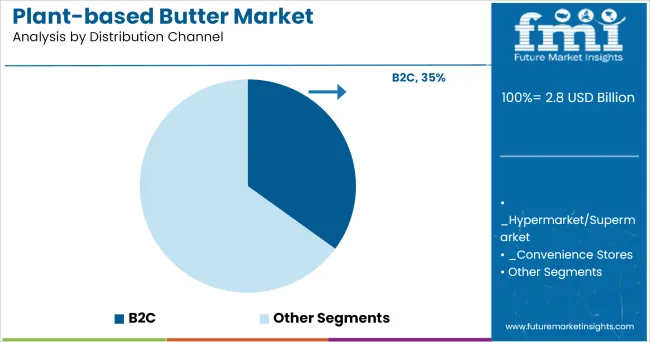
Prominent distribution channels for the market are B2B and B2C. B2B distribution can be further segmented into hotels, restaurants, and cafes. B2C distribution can be divided into hypermarket/supermarket, convenience stores, mom and pop stores, discount stores, food & drink specialty stores, independent small groceries, and online retail. Online retail is expected to be a fast-growing segment with a significant market share.

Online retail has been gaining ground in the food and beverage industry, with advantages in terms of consumer engagement, with minimal costs. Sales through online channels are especially expected to rise in 2020 owing to lockdown restrictions arising from the covid-19 pandemic.
Competitive Landscape

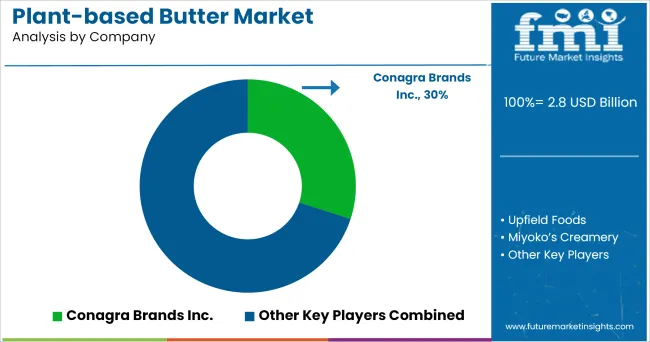
The global plant-based butter industry is competitive and fragmented in nature, with the numerous small scale players operating in the industry. Top players are increasingly investing in product launch and geographical expansion strategies to consolidate their position in the market.

In December 2020, Nestle announced the launch of Harvest Gourmet range of vegan foods including butter among others for consumers in China. The products will be manufactured at a new facility in the Tianjin province.

Kite Hill Launched its Plant-based Butter Alternative in the summer of 2020, which is produced with almond milk, and oils from sunflower, olives, and coconut, for consumers in the United States.

Further, ForA has launched a plant-based butter, with key ingredients of the original recipe being coconut oil, coconut cream, sunflower oil, aquafaba, and cocoa butter. The product is largely aimed towards bakery applications.

Future Market Insights has also studied the following plant-based butter manufacturers in its detailed study*:

  • Conagra Brands Inc.
  • Upfield Foods
  • Miyoko’s Creamery
  • Wayfare Food
  • Prosperity Organic Food Inc.
  • Lyrical Foods Inc.
  • Califia Farms
  • Premier Organics
  • Naturli Foods
  • Ekogram-the real food
  • Wildfriend Foods
  • The J.M. Smuker Co.
  • The Leaviet Corp.
  • Milkadamia
  • Chobani LLC
  • Carley’s Organic
  • Pintola
  • Alpino Health Foods
  • Vegan Way
  • Dhatu Organics
  • Kitchen Garden
  • Naturally Organic
  • Daisya Fine Food
  • Ceres Organics

*This list is indicative- full details about the plant-based butter manufacturers are available upon request.

Plant-based Butter Market- Report Scope

Attribute Details
Forecast Period 2020-2030
Historical Data Available for 2015-2019
Market Analysis USD Million for Value, Mn Units for Volume
Key Regions Covered North America, Latin America, Europe, Middle East & Africa, and Asia Pacific
Key Countries Covered US, Canada, Mexico, Greater China, Japan, India, South Korea, Australia, and New Zealand
Key Segments Covered Source, Distribution Channel, and Region
Key Companies Profiled Conagra Brands Inc., Upfield Foods, Miyoko’s Creamery, Wayfare Food, Prosperity Organic Food Inc., Lyrical Foods Inc., Califia Farms, Premier Organics, Naturli Foods, Ekogram-the real food, Wildfriend Foods, The J.M. Smuker Co., The Leaviet Corp., Milkadamia, Chobani LLC, Carley’s Organic, Pintola, Alpino Health Foods, Vegan Way, Dhatu Organics, Kitchen Garden, Naturally Organic, Daisya Fine Food, and Ceres Organics
Report Coverage Market Overview, Key Market Trends, COVID-19’s Impact, Demand Analysis, Market Background, Segmental Analysis, Regional Profiling, Market Structure Analysis and Competition Analysis
Customization & Pricing Available upon Request

Key Segments

Source

  • Oat Milk
  • Rice Milk
  • Corn Milk
  • Soy Milk
  • Pea Milk
  • Almond Milk
  • Coconut Milk
  • Cashew Milk
  • Flax Milk
  • Hemp Milk
  • Others

Distribution Channel

  • B2B
    • Hotels
    • Restaurants
    • Cafes
  • B2C
    • Hypermarket/Supermarket
    • Convenience Stores
    • Specialty Stores
    • Mom and Pop Stores
    • Discount Stores
    • Food & Drink Specialty Stores
    • Independent Small Groceries
    • Online Retail
    • Others

Region

  • North America (U.S. & Canada)
  • Latin America (Mexico & Rest of LATAM)
  • Europe, Middle East & Africa
  • Asia Pacific (Greater China, South East Asia, Japan, India, South Korea, Australia, New Zealand)

Frequently Asked Questions

How will the plant-based butter market expand through 2030?

As per the Future Market Insights (FMI) market study, the global plant-based butter market is likely to derive growth from the wide range of plant-sources, and flavors, surpassing US$ 2.4 Bn by 2020 and rising at a value CAGR of 7.6%.

Which is the largest plant-based butter market?

US is expected to be the leading market for plant-based butter products, accounting for over 35% of the global revenue share by the end of the forecast period. Growth in the region is attributed to higher health awareness and adoption in fast food applications.

How is COVID-19 impacting the plant-based butter growth projections?

The COVID-19 pandemic has created opportunities for growth. While the lockdown regulations in early 2020 has hurt demand from the food service sector, the demand for planned, healthy, vegan diets will create higher demand in the short term.

Which are some of the prominent market players?

Prominent plant-based butter manufacturers include

Table of Content

1. Executive Summary

    1.1. Global Market Outlook

    1.2. Demand Side Trends

    1.3. Supply Side Trends

    1.4. Analysis and Recommendation

2. Market Overview

    2.1. Market Coverage / Taxonomy

    2.2. Market Definition / Scope / Limitations

3. Plant-based Food 2.0_How novel technologies are disrupting the Plant-based food industry

    3.1. Plant-Based Trend On Rise

    3.2. Health Being an Important Quotient Leading to Veganism

    3.3. Understanding Consumer Perceptions

    3.4. Alternative Proteins: Not A New Idea

    3.5. Not All Alternatives Are Created Equal

    3.6. Why Opt for Plant-based Alternatives?

    3.7. What is Motivating Consumers for Meat Alternatives

    3.8. Rise in NPD in the Meat Substitute Market

    3.9. Alternative Proteins Are Gaining Share

    3.10. Our Meatless Future

    3.11. Butchering’ a Traditional Industry

    3.12. Global and Government Organizations Are Taking Measures for Reducing Meat Production

    3.13. Regulatory Landscape for the Plant-Based Protein

    3.14. Factors Driving the Alternative Proteins

    3.15. Consumer-Ready Products Available on the Shelves

    3.16. Funding from Various Sources is Driving the Meat Substitute Market

    3.17. Influence of Technology on the Alternative Protein Market

4. Plant-based Butter- Recent Developments

    4.1. Plant-based Butter- Recent Developments 

5. Global Plant-based Butter Demand Analysis 2015-2019  and Forecast, 2020-2030 

    5.1. Historical Market Volume (Mn Units) Analysis, 2015-2019 

    5.2. Current and Future Market Volume (Mn Units) Projections, 2020-2030 

    5.3. Y-o-Y Growth Trend Analysis

6. Global Plant-based Butter Market - Pricing Analysis

    6.1. Pricing Break-up

        6.1.1. Manufacturer Level Pricing

        6.1.2. Distributor Level Pricing

        6.1.3. Retail Level Pricing

7. Market Dynamics 

    7.1. Plant-based Butter Market Drivers 

    7.2. Plant-based Butter Market Restraints

    7.3. Plant-based Butter Market Opportunities

    7.4. Plant-based Butter Market Trends

    7.5. Macro-economic Factors

8. Global Plant-based Butter Analysis 2015-2019  and Forecast 2020-2030, by Source

    8.1. Introduction / Key Findings

    8.2. Historical Market Size (US$ Mn) and Volume Analysis By Source, 2015-2019

    8.3. Current and Future Market Size (US$ Mn) and Volume Analysis and Forecast By Source,      2020-2030

        8.3.1. Oat Milk source

        8.3.2. Rice Milk Source

        8.3.3. Corn Milk Source

        8.3.4. Soy Milk Source

        8.3.5. Pea Milk Source

        8.3.6. Almond Milk Source

        8.3.7. Coconut Milk Source

        8.3.8. Cashew Milk Source

        8.3.9. Flax Milk Source

        8.3.10. Hemp Milk Source

        8.3.11. Other Milk Source

    8.4. Market Attractiveness Analysis By Source

9. Global Plant-based Butter Analysis 2015-2019  and Forecast 2020-2030, by Distribution Channel

    9.1. Introduction / Key Findings

    9.2. Historical Market Size (US$ Mn) and Volume Analysis By Distribution Channel, 2015-2019

    9.3. Current and Future Market Size (US$ Mn) and Volume Analysis and Forecast By Distribution Channel, 2020-2030

        9.3.1. B2B

            9.3.1.1. Hotels

            9.3.1.2. Restaurants

            9.3.1.3. Cafes

        9.3.2. B2C

            9.3.2.1. Hypermarkets/Supermarkets

            9.3.2.2. Convenience Stores

            9.3.2.3. Specialty Stores

            9.3.2.4. Mom and Pop Stores

            9.3.2.5. Discount Stores

            9.3.2.6. Food & Drink Specialty Stores

            9.3.2.7. Independent Small Groceries

            9.3.2.8. Online Retail

            9.3.2.9. Others Retail Formats

    9.4. Market Attractiveness Analysis By Distribution Channel

10. Global Plant-based Butter Market Analysis 2015-2019 and Forecast 2020-2030, By Region

    10.1. Introduction/ Key Findings

    10.2. Historical Market Size (US$ Mn) and Volume Analysis By Region, 2015 - 2019

    10.3. Current Market Size (US$ Mn) and Volume Analysis and Forecast By Region, 2020 - 2030

        10.3.1. North America

        10.3.2. Latin America

        10.3.3. EMEA

        10.3.4. APAC

    10.4. Market Attractiveness Analysis By Region

11. North America Plant-based Butter Market Analysis 2015-2019 and Forecast 2020-2030

    11.1. Introduction/ Key Findings

    11.2. Historical Market Size (US$ Mn) and Volume Trend Analysis By Market Taxonomy, 2015 - 2019

    11.3. Market Size (US$ Mn) and Volume Forecast By Market Taxonomy, 2020 - 2030

        11.3.1. By Country

            11.3.1.1. U.S.

            11.3.1.2. Canada

            11.3.1.3. Mexico

        11.3.2. By Source

        11.3.3. By Distribution Channel

    11.4. Market Attractiveness Analysis

        11.4.1. By Source

        11.4.2. By Distribution Channel

    11.5. Market Trends

    11.6. Drivers and Restraints - Impact Analysis

12. Latin America Plant-based Butter Market Analysis 2015-2019 and Forecast 2020-2030

    12.1. Introduction/ Key Findings

    12.2. Historical Market Size (US$ Mn) and Volume Trend Analysis By Market Taxonomy, 2015 - 2019

    12.3. Market Size (US$ Mn) and Volume Forecast By Market Taxonomy, 2020 - 2030

        12.3.1. By Source

        12.3.2. By Distribution Channel

    12.4. Market Attractiveness Analysis

        12.4.1.By Source

        12.4.2.By Distribution Channel

    12.5. Market Trends

    12.6. Drivers and Restraints - Impact Analysis

13. EMEA Plant-based Butter Market Analysis 2015-2019 and Forecast 2020-2030

    13.1. Introduction/ Key Findings

    13.2. Historical Market Size (US$ Mn) and Volume Trend Analysis By Market Taxonomy, 2015 - 2019

    13.3. Market Size (US$ Mn) and Volume Forecast By Market Taxonomy, 2020 – 2030

        13.3.1. By Country

            13.3.1.1. Europe

            13.3.1.2. Middle East and Africa

        13.3.2. By Source

        13.3.3. By Distribution Channel

    13.4. Market Attractiveness Analysis

        13.4.1. By Source

        13.4.2. By Distribution Channel

    13.5. Market Trends

    13.6. Drivers and Restraints - Impact Analysis

14. APAC Plant-based Butter Market Analysis 2015-2019 and Forecast 2020-2030

    14.1. Introduction/ Key Findings

    14.2. Historical Market Size (US$ Mn) and Volume Trend Analysis By Market Taxonomy, 2015 - 2019

    14.3. Market Size (US$ Mn) and Volume Forecast By Market Taxonomy, 2020 - 2030

        14.3.1. By Country

            14.3.1.1. Greater China

            14.3.1.2. South East Asia

            14.3.1.3. Japan

            14.3.1.4. India

            14.3.1.5. South Korea

            14.3.1.6. Australia and New Zealand

        14.3.2. By Source

        14.3.3. By Distribution Channel

    14.4. Market Attractiveness Analysis

        14.4.1. By Source

        14.4.2. By Distribution Channel

    14.5. Market Trends

    14.6. Drivers and Restraints - Impact Analysis

15. Global Plant-based Butter Market Recent M&A Activity

    15.1. Recent M&A Activity

16. Global Plant-based Butter Market Competition Analysis

    16.1. Start-ups Innovating Across the Meatless Ecosystem

    16.2. Competition Dashboard

    16.3. Industry Structure Analysis

    16.4. Company Share Analysis- By Segment

17. Competition Deep Dive 

    17.1. Conagra Brands, Inc 

        17.1.1. Overview

        17.1.2. Product Portfolio

        17.1.3. Profitability by Market Segments (Product/Channel/Target Population)

        17.1.4. Sales Footprint

        17.1.5. Strategy Overview

            17.1.5.1. Marketing Strategy

            17.1.5.2. Product Strategy

            17.1.5.3. Channel Strategy

            17.1.5.4. Analysts’ Comments

    17.2. Upfield Foods

        17.2.1. Overview

        17.2.2. Product Portfolio

        17.2.3. Profitability by Market Segments (Product/Channel/Target Population)

        17.2.4. Sales Footprint

        17.2.5. Strategy Overview

            17.2.5.1. Marketing Strategy

            17.2.5.2. Product Strategy

            17.2.5.3. Channel Strategy

            17.2.5.4. Analysts’ Comments

    17.3. Miyoko’s Creamery

        17.3.1. Overview

        17.3.2. Product Portfolio

        17.3.3. Profitability by Market Segments (Product/Channel/Target Population)

        17.3.4. Sales Footprint

        17.3.5. Strategy Overview

            17.3.5.1. Marketing Strategy

            17.3.5.2. Product Strategy

            17.3.5.3. Channel Strategy

            17.3.5.4. Analysts’ Comments

    17.4. Wayfare Food

        17.4.1. Overview

        17.4.2. Product Portfolio

        17.4.3. Profitability by Market Segments (Product/Channel/Target Population)

        17.4.4. Sales Footprint

        17.4.5. Strategy Overview

            17.4.5.1. Marketing Strategy

            17.4.5.2. Product Strategy

            17.4.5.3. Channel Strategy

            17.4.5.4. Analysts’ Comments

    17.5. Prosperity Organic Food Inc.

        17.5.1. Overview

        17.5.2. Product Portfolio

        17.5.3. Profitability by Market Segments (Product/Channel/Target Population)

        17.5.4. Sales Footprint

        17.5.5. Strategy Overview

            17.5.5.1. Marketing Strategy

            17.5.5.2. Product Strategy

            17.5.5.3. Channel Strategy

            17.5.5.4. Analysts’ Comments

    17.6. Lyrical Foods Inc.

        17.6.1. Overview

        17.6.2. Product Portfolio

        17.6.3. Profitability by Market Segments (Product/Channel/Target Population)

        17.6.4. Sales Footprint

        17.6.5. Strategy Overview

            17.6.5.1. Marketing Strategy

            17.6.5.2. Product Strategy

            17.6.5.3. Channel Strategy

            17.6.5.4. Analysts’ Comments

    17.7. Califia Farms

        17.7.1. Overview

        17.7.2. Product Portfolio

        17.7.3. Profitability by Market Segments (Product/Channel/Target Population)

        17.7.4. Sales Footprint

        17.7.5. Strategy Overview

            17.7.5.1. Marketing Strategy

            17.7.5.2. Product Strategy

            17.7.5.3. Channel Strategy

            17.7.5.4. Analysts’ Comments

    17.8. Premier Organics

        17.8.1. Overview

        17.8.2. Product Portfolio

        17.8.3. Profitability by Market Segments (Product/Channel/Target Population)

        17.8.4. Sales Footprint

        17.8.5. Strategy Overview

            17.8.5.1. Marketing Strategy

            17.8.5.2. Product Strategy

            17.8.5.3. Channel Strategy

            17.8.5.4. Analysts’ Comments

    17.9. Naturli Foods

        17.9.1. Overview

        17.9.2. Product Portfolio

        17.9.3. Profitability by Market Segments (Product/Channel/Target Population)

        17.9.4. Sales Footprint

        17.9.5. Strategy Overview

            17.9.5.1. Marketing Strategy

            17.9.5.2. Product Strategy

            17.9.5.3. Channel Strategy

            17.9.5.4. Analysts’ Comments

    17.10. Ekogram-the real food

        17.10.1. Overview

        17.10.2. Product Portfolio

        17.10.3. Profitability by Market Segments (Product/Channel/Target Population)

        17.10.4. Sales Footprint

        17.10.5. Strategy Overview

            17.10.5.1. Marketing Strategy

            17.10.5.2. Product Strategy

            17.10.5.3. Channel Strategy

            17.10.5.4. Analysts’ Comments

    17.11. Wildfriend Foods

        17.11.1. Overview

        17.11.2. Product Portfolio

        17.11.3. Profitability by Market Segments (Product/Channel/Target Population)

        17.11.4. Sales Footprint

        17.11.5. Strategy Overview

            17.11.5.1. Marketing Strategy

            17.11.5.2. Product Strategy

            17.11.5.3. Channel Strategy

            17.11.5.4. Analysts’ Comments

    17.12. The J.M.Smuker Co

        17.12.1. Overview

        17.12.2. Product Portfolio

        17.12.3. Profitability by Market Segments (Product/Channel/Target Population)

        17.12.4. Sales Footprint

        17.12.5. Strategy Overview

            17.12.5.1. Marketing Strategy

            17.12.5.2. Product Strategy

            17.12.5.3. Channel Strategy

            17.12.5.4. Analysts’ Comments

    17.13. The leaveit Corp.

        17.13.1. Overview

        17.13.2. Product Portfolio

        17.13.3. Profitability by Market Segments (Product/Channel/Target Population)

        17.13.4. Sales Footprint

        17.13.5. Strategy Overview

            17.13.5.1. Marketing Strategy

            17.13.5.2. Product Strategy

            17.13.5.3. Channel Strategy

            17.13.5.4. Analysts’ Comments

    17.14. Milkadamia

        17.14.1. Overview

        17.14.2. Product Portfolio

        17.14.3. Profitability by Market Segments (Product/Channel/Target Population)

        17.14.4. Sales Footprint

        17.14.5. Strategy Overview

            17.14.5.1. Marketing Strategy

            17.14.5.2. Product Strategy

            17.14.5.3. Channel Strategy

            17.14.5.4. Analysts’ Comments

    17.15. chobani LLc

        17.15.1. Overview

        17.15.2. Product Portfolio

        17.15.3. Profitability by Market Segments (Product/Channel/Target Population)

        17.15.4. Sales Footprint

        17.15.5. Strategy Overview

            17.15.5.1. Marketing Strategy

            17.15.5.2. Product Strategy

            17.15.5.3. Channel Strategy

            17.15.5.4. Analysts’ Comments

    17.16. Carley's Organic

        17.16.1. Overview

        17.16.2. Product Portfolio

        17.16.3. Profitability by Market Segments (Product/Channel/Target Population)

        17.16.4. Sales Footprint

        17.16.5. Strategy Overview

            17.16.5.1. Marketing Strategy

            17.16.5.2. Product Strategy

            17.16.5.3. Channel Strategy

            17.16.5.4. Analysts’ Comments

    17.17. Pintola

        17.17.1. Overview

        17.17.2. Product Portfolio

        17.17.3. Profitability by Market Segments (Product/Channel/Target Population)

        17.17.4. Sales Footprint

        17.17.5. Strategy Overview

            17.17.5.1. Marketing Strategy

            17.17.5.2. Product Strategy

            17.17.5.3. Channel Strategy

            17.17.5.4. Analysts’ Comments

    17.18. Alpino Health Foods

        17.18.1. Overview

        17.18.2. Product Portfolio

        17.18.3. Profitability by Market Segments (Product/Channel/Target Population)

        17.18.4. Sales Footprint

        17.18.5. Strategy Overview

            17.18.5.1. Marketing Strategy

            17.18.5.2. Product Strategy

            17.18.5.3. Channel Strategy

            17.18.5.4. Analysts’ Comments

    17.19. Vegan Way

        17.19.1. Overview

        17.19.2. Product Portfolio

        17.19.3. Profitability by Market Segments (Product/Channel/Target Population)

        17.19.4. Sales Footprint

        17.19.5. Strategy Overview

            17.19.5.1. Marketing Strategy

            17.19.5.2. Product Strategy

            17.19.5.3. Channel Strategy

            17.19.5.4. Analysts’ Comments

    17.20. Dhatu Organics

        17.20.1. Overview

        17.20.2. Product Portfolio

        17.20.3. Profitability by Market Segments (Product/Channel/Target Population)

        17.20.4. Sales Footprint

        17.20.5. Strategy Overview

            17.20.5.1. Marketing Strategy

            17.20.5.2. Product Strategy

            17.20.5.3. Channel Strategy

            17.20.5.4. Analysts’ Comments

    17.21. Kitchen Garden

        17.21.1. Overview

        17.21.2. Product Portfolio

        17.21.3. Profitability by Market Segments (Product/Channel/Target Population)

        17.21.4. Sales Footprint

        17.21.5. Strategy Overview

            17.21.5.1. Marketing Strategy

            17.21.5.2. Product Strategy

            17.21.5.3. Channel Strategy

            17.21.5.4. Analysts’ Comments

    17.22. Naturally Organic

        17.22.1. Overview

        17.22.2. Product Portfolio

        17.22.3. Profitability by Market Segments (Product/Channel/Target Population)

        17.22.4. Sales Footprint

        17.22.5. Strategy Overview

            17.22.5.1. Marketing Strategy

            17.22.5.2. Product Strategy

            17.22.5.3. Channel Strategy

            17.22.5.4. Analysts’ Comments

    17.23. Daisya Fine Food

        17.23.1. Overview

        17.23.2. Product Portfolio

        17.23.3. Profitability by Market Segments (Product/Channel/Target Population)

        17.23.4. Sales Footprint

        17.23.5. Strategy Overview

            17.23.5.1. Marketing Strategy

            17.23.5.2. Product Strategy

            17.23.5.3. Channel Strategy

            17.23.5.4. Analysts’ Comments

    17.24. Ceres Organics

        17.24.1. Overview

        17.24.2. Product Portfolio

        17.24.3. Profitability by Market Segments (Product/Channel/Target Population)

        17.24.4. Sales Footprint

        17.24.5. Strategy Overview

            17.24.5.1. Marketing Strategy

            17.24.5.2. Product Strategy

            17.24.5.3. Channel Strategy

            17.24.5.4. Analysts’ Comments

18. Appendix

19. Research Methodology Data Sources Used 

20. Data Sources Used 

21. Assumptions & Acronyms Used

22. Disclaimer

Don't pay for what you don't need

Customize your report by selecting specific countries or regions and save 30%!

List of Tables

Table 01: list of Plant-based proteins 

Table 02: Price Point Assessment by Region and Source (US$ MT), 2020 

Table 03: Price Point Assessment by Region and Source (US$ MT), 2020 

Table 04: Price Point Assessment by Region and Source (US$ MT), 2020 

Table 05: Global Plant-based Butter Historical Market Value (US$ Mn) Analysis, by Source, 2015–2019

Table 06: Global Plant-based Butter Market Value (US$ Mn) Forecast, by Source, 2020–2030

Table 07: Global Plant-based Butter Historical Market Volume (MT) Analysis, by Source, 2015–2019

Table 08: Global Plant-based Butter Market Volume (MT) Forecast, by Source, 2020–2030

Table 09: Global Plant-based Butter Historical Market Value (US$ Mn) analysis, by Distribution Channel, 2015–2019

Table 10: Global Plant-based Butter Historical Market Value (US$ Mn) analysis, by Distribution Channel, 2015–2019

Table 11: Global Plant-based Butter Market Value (US$ Mn) forecast, by Distribution Channel, 2020–2030

Table 12: Global Plant-based Butter Historical Market Value (US$ Mn) analysis, by Distribution Channel, 2020–2030

Table 13: Global Plant-based Butter Historical Market Volume (MT) analysis, by Distribution Channel, 2015–2019

Table 14: Global Plant-based Butter Historical Market Volume (MT) analysis, by Distribution Channel, 2015–2019

Table 15: Global Plant-based Butter Market Volume (MT) forecast, by Distribution Channel, 2020–2030

Table 16: Global Plant-based Butter Historical Market Volume (MT) analysis, by Distribution Channel, 2020–2030

Table 17: Global Plant-based Butter Market Historical Market Value (US$ Mn) Analysis, by Region, 2015–2019

Table 18: Global Plant-based Butter Market Historical Market Volume (MT) Analysis, by Region, 2015–2019

Table 19: Global Plant-based Butter Market Value (US$ Mn) Forecast, by Region, 2020–2030

Table 20: Global Plant-based Butter Market Volume (MT) Forecast, by Region, 2020–2030

Table 21: North America Plant-based Butter Historical Market Value (US$ Mn) Analysis, by Source, 2015–2019

Table 22: North America Plant-based Butter Market Value (US$ Mn) Forecast, by Source, 2020–2030

Table 23: North America Plant-based Butter Historical Market Volume (MT) Analysis, by Source, 2015–2019

Table 24: North America Plant-based Butter Market Volume (MT) Forecast, by Source, 2020–2030

Table 25: North America Plant-based Butter Historical Market Value (US$ Mn) analysis, by Distribution Channel, 2015–2019

Table 26: North America Plant-based Butter Historical Market Value (US$ Mn) analysis, by Distribution Channel, 2015–2019

Table 27: North America Plant-based Butter Market Value (US$ Mn) forecast, by Distribution Channel, 2020–2030

Table 28: North America Plant-based Butter Historical Market Value (US$ Mn) analysis, by Distribution Channel, 2020–2030

Table 29: North America Plant-based Butter Historical Market Volume (MT) analysis, by Distribution Channel, 2015–2019

Table 30: North America Plant-based Butter Historical Market Volume (MT) analysis, by Distribution Channel, 2015–2019

Table 31: North America Plant-based Butter Market Volume (MT) forecast, by Distribution Channel, 2020–2030

Table 32: North America Plant-based Butter Historical Market Volume (MT) analysis, by Distribution Channel, 2020–2030

Table 33: North America Plant-based Butter Market Historical Market Value (US$ Mn) Analysis, by Country, 2015–2019

Table 34: North America Plant-based Butter Market Historical Market Volume (MT) Analysis, by Country, 2015–2019

Table 35: North America Plant-based Butter Market Value (US$ Mn) Forecast, by Country, 2020–2030

Table 36: North America Plant-based Butter Market Volume (MT) Forecast, by Country, 2020–2030

Table 37: Latin America Plant-based Butter Historical Market Value (US$ Mn) Analysis, by Source, 2015–2019

Table 38: Latin America Plant-based Butter Market Value (US$ Mn) Forecast, by Source, 2020–2030

Table 39: Latin America Plant-based Butter Historical Market Volume (MT) Analysis, by Source, 2015–2019

Table 40: Latin America Plant-based Butter Market Volume (MT) Forecast, by Source, 2020–2030

Table 41: Latin America Plant-based Butter Historical Market Value (US$ Mn) analysis, by Distribution Channel, 2015–2019

Table 42: Latin America Plant-based Butter Historical Market Value (US$ Mn) analysis, by Distribution Channel, 2015–2019

Table 43: Latin America Plant-based Butter Market Value (US$ Mn) forecast, by Distribution Channel, 2020–2030

Table 44: Latin America Plant-based Butter Historical Market Value (US$ Mn) analysis, by Distribution Channel, 2020–2030

Table 45: Latin America Plant-based Butter Historical Market Volume (MT) analysis, by Distribution Channel, 2015–2019

Table 46: Latin America Plant-based Butter Historical Market Volume (MT) analysis, by Distribution Channel, 2015–2019

Table 47: Latin America Plant-based Butter Market Volume (MT) forecast, by Distribution Channel, 2020–2030

Table 48: Latin America Plant-based Butter Historical Market Volume (MT) analysis, by Distribution Channel, 2020–2030

Table 49: EMEA Plant-based Butter Historical Market Value (US$ Mn) Analysis, by Source, 2015–2019

Table 50: EMEA Plant-based Butter Market Value (US$ Mn) Forecast, by Source, 2020–203

Table 51: EMEA Plant-based Butter Historical Market Volume (MT) Analysis, by Source, 2015–2019

Table 52: EMEA Plant-based Butter Market Volume (MT) Forecast, by Source, 2020–2030

Table 53: EMEA Plant-based Butter Historical Market Value (US$ Mn) analysis, by Distribution Channel, 2015–2019

Table 54: EMEA Plant-based Butter Historical Market Value (US$ Mn) analysis, by Distribution Channel, 2015–2019

Table 55: EMEA Plant-based Butter Market Value (US$ Mn) forecast, by Distribution Channel, 2020–2030

Table 56: EMEA Plant-based Butter Market Value (US$ Mn) forecast, by Distribution Channel, 2020–2030

Table 57: EMEA Plant-based Butter Historical Market Volume (MT) analysis, by Distribution Channel, 2015–2019

Table 58: EMEA Plant-based Butter Historical Market Volume (MT) analysis, by Distribution Channel, 2015–2019

Table 59: EMEA Plant-based Butter Market Volume (MT) forecast, by Distribution Channel, 2020–2030

Table 60: EMEA Plant-based Butter Market Volume (MT) forecast, by Distribution Channel, 2020–2030

Table 61: EMEA Plant-based Butter Market Historical Market Value (US$ Mn) Analysis, by Country, 2015–2019

Table 62: EMEA Plant-based Butter Market Historical Market Volume (MT) Analysis, by Country, 2015–2019

Table 63: EMEA Plant-based Butter Market Value (US$ Mn) Forecast, by Country, 2020–2030

Table 64: EMEA Plant-based Butter Market Volume (MT) Forecast, by Country, 2020–2030

Table 65: APAC Plant-based Butter Historical Market Value (US$ Mn) Analysis, by Source, 2015–2019

Table 66: APAC Plant-based Butter Market Value (US$ Mn) Forecast, by Source, 2020–2030

Table 67: APAC Plant-based Butter Historical Market Volume (MT) Analysis, by Source, 2015–2019

Table 68: APAC Plant-based Butter Market Volume (MT) Forecast, by Source, 2020–2030

Table 69: APAC Plant-based Butter Historical Market Value (US$ Mn) analysis, by Distribution Channel, 2015–2019

Table 70: APAC Plant-based Butter Historical Market Value (US$ Mn) analysis, by Distribution Channel, 2015–2019

Table 71: APAC Plant-based Butter Market Value (US$ Mn) forecast, by Distribution Channel, 2020–2030

Table 72: APAC Plant-based Butter Historical Market Value (US$ Mn) analysis, by Distribution Channel, 2020–2030

Table 73: APAC Plant-based Butter Historical Market Volume (MT) analysis, by Distribution Channel, 2015–2019

Table 74: APAC Plant-based Butter Historical Market Volume (MT) analysis, by Distribution Channel, 2015–2019

Table 75: APAC Plant-based Butter Market Volume (MT) forecast, by Distribution Channel, 2020–2030

Table 76: APAC Plant-based Butter Historical Market Volume (MT) analysis, by Distribution Channel, 2020–2030

Table 77: APAC Plant-based Butter Market Historical Market Value (US$ Mn) Analysis, by Country, 2015–2019

Table 78: APAC Plant-based Butter Market Historical Market Volume (MT) Analysis, by Country, 2015–2019

Table 79: APAC Plant-based Butter Market Value (US$ Mn) Forecast, by Country, 2020–2030

Table 80: APAC Plant-based Butter Market Volume (MT) Forecast, by Country, 2020–2030
Nandini Roy Choudhury

Principal Consultant

Talk to Analyst

Find your sweet spots for generating winning opportunities in this market.

List of Charts

Figure 01: Motivations to Being/Become Vegan

Figure 02: Percentage of Consumers Indicating If They Are Currently Trying to Reduce Their Meat Consumption

Figure 03: Reasons for People Eating Plant-Based Foods

Figure 04: Meat alternative motivations

Figure 05: Beef Consumption (thousand tones) – China

Figure 06: Relative Contribution of Top 5 GHG Emitting – Intensive Foods and All Other Foods

Figure 07: Funding Invested in Plant-Based Food and Cell-Based Meat, 2018

Figure 08: Global Plant-based Butter Market Size and Incremental $ Opportunity (US$ Mn), 2015-2030

Figure 09: Global Plant-based Butter Market Value and Volume Analysis, 2020

Figure 10: Global Plant-based Butter Market Value (US$ Mn) Scenario Forecast, 2020 & 2030

Figure 11: Global Plant-based Butter Market Share and BPS Analysis by Source – 2020 & 2030

Figure 12: Global Plant-based Butter Market Attractiveness Analysis by Source, 2020-2030

Figure 13: Global Plant-based Butter Market by Oat Milk Source Market Value (US$ Mn), Volume (MT) 2015-2030

Figure 14: Global Plant-based Butter Market Oat Milk Source Incremental $ Opportunity, 2020-2030

Figure 15: Global Plant-based Butter Market by Rice Milk Source Market Value (US$ Mn), Volume (MT) 2015-2030

Figure 16: Global Plant-based Butter Market Rice Milk Source Incremental $ Opportunity, 2020-2030

Figure 17: Global Plant-based Butter Market by Corn Milk Source Market Value (US$ Mn), Volume (MT) 2015-2030

Figure 18: Global Plant-based Butter Market Corn Milk Source Incremental $ Opportunity, 2020-2030

Figure 19: Global Plant-based Butter Market by Soy Milk Source Market Value (US$ Mn), Volume (MT) 2015-2030

Figure 20: Global Plant-based Butter Market Soy Milk Source Incremental $ Opportunity, 2020-2030

Figure 21: Global Plant-based Butter Market by Pea Milk Source Market Value (US$ Mn), Volume (MT) 2015-2030

Figure 22: Global Plant-based Butter Market Pea Milk Source Incremental $ Opportunity, 2020-2030

Figure 23: Global Plant-based Butter Market by Almond Milk Source Market Value (US$ Mn), Volume (MT) 2015-2030

Figure 24: Global Plant-based Butter Market Almond Milk Source Incremental $ Opportunity, 2020-2030

Figure 25: Global Plant-based Butter Market by Coconut Milk Source Market Value (US$ Mn), Volume (MT) 2015-2030

Figure 26: Global Plant-based Butter Market Coconut Milk Source Incremental $ Opportunity, 2020-2030

Figure 27: Global Plant-based Butter Market by Cashew Milk Source Market Value (US$ Mn), Volume (MT) 2015-2030

Figure 28: Global Plant-based Butter Market Cashew Milk Source Incremental $ Opportunity, 2020-2030

Figure 29: Global Plant-based Butter Market by Flax Milk Source Market Value (US$ Mn), Volume (MT) 2015-2030

Figure 30: Global Plant-based Butter Market Flax Milk Source Incremental $ Opportunity, 2020-2030

Figure 31: Global Plant-based Butter Market by Hemp Milk Source Market Value (US$ Mn), Volume (MT) 2015-2030

Figure 32: Global Plant-based Butter Market Hemp Milk Source Incremental $ Opportunity, 2020-2030

Figure 33: Global Plant-based Butter Market by Other Milk Source Market Value (US$ Mn), Volume (MT) 2015-2030

Figure 34: Global Plant-based Butter Market Other Milk Source Incremental $ Opportunity, 2020-2030

Figure 35: Global Plant-based Butter Market Share and BPS Analysis by Distribution Channel– 2020 & 2030

Figure 36: Global Plant-based Butter Market Attractiveness Analysis by Distribution Channel, 2020-2030

Figure 37: Global Plant-based Butter Market Share and BPS Analysis by B2B Distribution Channel– 2020 & 2030

Figure 38: Global Plant-based Butter Market Attractiveness Analysis by B2B Distribution Channel, 2020-2030

Figure 39: Global Plant-based Butter Market Share and BPS Analysis by B2C Distribution Channel– 2020 & 2030

Figure 40: Global Plant-based Butter Market Attractiveness Analysis by B2C Distribution Channel, 2020-2030

Figure 41: Global Plant-based Butter Market by B2B Distribution Channel Market Value (US$ Mn), Volume (MT) 2015-2030

Figure 42: Global Plant-based Butter B2B Distribution Channel Incremental $ Opportunity, 2020-2030

Figure 43: Global Plant-based Butter Market by B2C Distribution Channel Market Value (US$ Mn), Volume (MT) 2015-2030

Figure 44: Global Plant-based Butter Market B2C Distribution Channel Incremental $ Opportunity, 2020-2030

Figure 45: Global Plant-based Butter Market Value Share (%) and BPS Analysis by Region, 2015, 2020 & 2030

Figure 46: Global Plant-based Butter Market Y-o-Y Growth (%) Projections by Segment, 2020-2030

Figure 47: North America Plant-based Butter Absolute $ Opportunity Analysis, 2020-2030

Figure 48: Latin America Plant-based Butter Absolute $ Opportunity Analysis, 2020-2030

Figure 49: EMEA Plant-based Butter Absolute $ Opportunity Analysis, 2020-2030

Figure 50: APAC Plant-based Butter Absolute $ Opportunity Analysis, 2019-2029

Figure 51: Global Plant-based Butter Market Attractiveness Analysis, 2020-2030

Figure 52: North America Plant-based Butter Market Value (US$ Mn), Volume (MT) Forecast and Analysis, 2020-2030

Figure 53: North America Plant-based Butter Market Share and BPS Analysis by Source – 2020 & 2030

Figure 54: North America Plant-based Butter Market Attractiveness Analysis by Source, 2020-2030

Figure 55: U.S Plant-based Butter Market Incremental $ Opportunity, 2020-2030

Figure 56: Canada Plant-based Butter Market Incremental $ Opportunity, 2020-2030

Figure 57: Mexico Plant-based Butter Market Incremental $ Opportunity, 2020-2030

Figure 58: North America Plant-based Butter Market Share and BPS Analysis by Source – 2020 & 2030

Figure 59: North America Plant-based Butter Market Attractiveness Analysis by Source, 2020-203

Figure 60: North America Plant-based Butter Market Share and BPS Analysis by Distribution Channel – 2020 & 2030

Figure 61: North America Plant-based Butter Market Attractiveness Analysis by Distribution Channel, 2020-2030

Figure 62: North America Plant-based Butter Market Share and BPS Analysis by B2B distribution channel – 2020 & 2030

Figure 63: North America Plant-based Butter Market Attractiveness Analysis by B2B distribution channel, 2020-2030

Figure 64: North America Plant-based Butter Market Share and BPS Analysis by B2C distribution channel – 2020 & 2030

Figure 65: North America Plant-based Butter Market Attractiveness Analysis by B2C distribution channel, 2020-2030

Figure 66: Latin America Plant-based Butter Market Value (US$ Mn), Volume (MT) Forecast and Analysis, 2020-2030

Figure 67: Latin America Plant-based Butter Market Share and BPS Analysis by Source – 2020 & 2030

Figure 68: Latin America Plant-based Butter Market Attractiveness Analysis by Source, 2020-2030

Figure 69: Latin America Based Butter Market Share and BPS Analysis by Distribution Channel – 2020 & 2030

Figure 70: Latin America Plant-based Butter Market Attractiveness Analysis by Distribution Channel, 2020-2030

Figure 71: Latin America Plant-based Butter Market Share and BPS Analysis by B2B distribution channel – 2020 & 2030

Figure 72: Latin America Plant-based Butter Market Attractiveness Analysis by B2B distribution channel, 2020-2030

Figure 73: Latin America Plant-based Butter Market Share and BPS Analysis by B2C distribution channel – 2020 & 2030

Figure 74: Latin America Plant-based Butter Market Attractiveness Analysis by B2C distribution channel, 2020-2030

Figure 75: EMEA Plant-based Butter Market Value (US$ Mn), Volume (MT) Forecast and Analysis, 2020-2030

Figure 76: EMEA Plant-based Butter Market Share and BPS Analysis by Country – 2020 & 2030

Figure 77: EMEA Plant-based Butter Market Attractiveness Analysis by Country, 2020-2030

Figure 78: MEA Plant-based Butter Market Incremental $ Opportunity, 2020-2030

Figure 79: Europe Plant-based Butter Market Incremental $ Opportunity, 2020-2030

Figure 80: EMEA Plant-based Butter Market Share and BPS Analysis by Source – 2020 & 2030

Figure 81: EMEA Plant-based Butter Market Attractiveness Analysis by Source, 2020-2030

Figure 82: EMEA Plant-based Butter Market Share and BPS Analysis by Distribution Channel – 2020 & 2030

Figure 83: EMEA Butter Market Attractiveness Analysis by Distribution Channel, 2020-2030

Figure 84: EMEA Plant-based Butter Market Share and BPS Analysis by B2B distribution channel – 2020 & 2030

Figure 85: EMEA Plant-based Butter Market Attractiveness Analysis by B2B distribution channel, 2020-2030

Figure 86: EMEA Plant-based Butter Market Share and BPS Analysis by B2C distribution channel – 2020 & 2030

Figure 87: EMEA Plant-based Butter Market Attractiveness Analysis by B2C distribution channel, 2020-2030

Figure 88: APAC Plant-based Butter Market Value (US$ Mn), Volume (Unit) Forecast and Analysis, 2020-2030

Figure 89: APAC Plant-based Butter Market Share and BPS Analysis by Source – 2020 & 2030

Figure 90: APAC Plant-based Butter Market Attractiveness Analysis by Source, 2020-2030

Figure 91: Greater China Plant-based Butter Market Incremental $ Opportunity, 2020-2030

Figure 92: South East Asia Plant-based Butter Market Incremental $ Opportunity, 2020-2030

Figure 93: Japan Plant-based Butter Market Incremental $ Opportunity, 2020-2030

Figure 94: India Plant-based Butter Market Incremental $ Opportunity, 2020-2030

Figure 95: South Korea Plant-based Butter Market Incremental $ Opportunity, 2020-2030

Figure 96: Australia and New Zealand Plant-based Butter Market Incremental $ Opportunity, 2020-2030

Figure 97: APAC Plant-based Butter Market Share and BPS Analysis by Source – 2020 & 2030

Figure 98: APAC Plant-based Butter Market Attractiveness Analysis by Source, 2020-2030

Figure 99: APAC Based Butter Market Share and BPS Analysis by Distribution Channel – 2020 & 2030

Figure 100: APAC Plant-based Butter Market Attractiveness Analysis by Distribution Channel, 2020-2030

Figure 101: APAC Plant-based Butter Market Share and BPS Analysis by B2B distribution channel – 2020 & 2030

Figure 102: APAC Plant-based Butter Market Attractiveness Analysis by B2B distribution channel, 2020-2030

Figure 103: APAC Plant-based Butter Market Share and BPS Analysis by B2C distribution channel – 2020 & 2030

Figure 104: APAC Plant-based Butter Market Attractiveness Analysis by B2C distribution channel, 2020-2030

Figure 105: Plant-based Butter Industry Structure Analysis, 2019

Figure 106: Key players in Plant-based Butter Industry (market share in % of value), 2019

Figure 108: Company Market Share Analysis of Top 10 Players, By Region

Figure 107: Company Share Analysis- By Source

Explore Food and Beverage Insights

View Reports

Plant-based Butter Market