Plant-based Milk Market
Market Insights on Plant-based Milk covering sales outlook, demand forecast & up-to-date key trends
Plant-based Milk Market By Category (Organic, Conventional), Form (Liquid, Powder), Product Type (Soy Milk, Almond Milk, Coconut milk), Flavor Type (Original/Unflavored, Flavoured), End-use (Infant Formula, Dairy Products, Bakery & Confectionary), Sales Channel (Direct Sales, Indirect Sales) & Region - Forecast to 2021 - 2031
Plant-based Milk Market
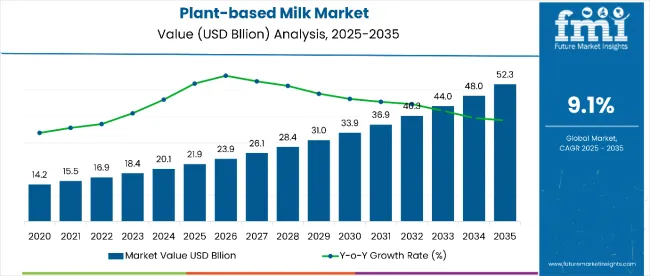
[250 Pages Report] The demand for plant-based milk market is expected to reach a value of US$ 13.24 Bn in 2021. As per Future Market Insights (FMI), the overall market value is expected to reach US$ 30.79 Bn by 2031. Rising demand for alternative sources of milk and protein will push sales in the market at 8.8% CAGR through 2031.
Key Points Covered in Plant-based Milk Market in Food and Beverage Sector Study
- Market estimates and forecast 2015-2031
- Key drivers and restraints impacting market growth
- Segment-wise, Country-wise, and Region-wise Analysis
- Competition Mapping and Benchmarking
- Brand share and Market Share Analysis
- Key Product Innovations and Regulatory Climate
- COVID-19 Impact on Demand for Plant-based Milk and How to Navigate
- Recommendation on Key Winning Strategies
2016-2020 Plant-based Milk Market Outlook in Comparison to 2021-2031 Growth Forecast
There has been a rising interest among consumers to reduce their dietary intake of animal-based food products amidst soaring focus on sustainability, health, and ethical concerns. As a result, the food industry is manufacturing novel plant-based goods that mimic many of the physicochemical and sensory properties of animal-derived meals such as milk, eggs, and meat.
When compared to traditional dairy products, animal-free dairy proteins provide a number of advantages. They are free of antibiotics, hormones, and lactose, making them acceptable for anyone with the aforementioned sensitivities or intolerances. They are also comparable to dairy protein in terms of nutritional value, taste, texture, and usefulness.
Plant-based milk alternatives have grown in popularity in recent years, and several commercial versions are now available, with oat, almond, coconut, flaxseed, rice, and soy milks among the most popular. Thus the market has grown with a CAGR of 6.0% for 2016-2020 and is expected to grow at a CAGR of 8.8% for 2021-2031.
Is Growing Veganism Primary Factor Fuelling the Demand for Plant-based Milk?
With the growing trend among athletes and young consumers to adopt a vegan diet that includes only plant-based products, completely excluding dairy foods or drinks, demand for plant-based products and dairy alternatives is increasing.
Consumers are also becoming more familiar with animal welfare, which is another factor steering them away from animal-based products.
Such changing trends in consumer food consumption foster demand for plant-based foods and alternatives to dairy products. This, in effect, fuels the growth of the market for plant-based milk, as it provides a very good choice for people following strict dairy, gluten-free, or vegan diets. Therefore, these consumers' preference for plant-based milk is driving the market growth.
Find your sweet spots for generating winning opportunities in this market.
Talk to AnalystIs Plant-based Milk Useful as a Dairy Alternative for Individuals with Health Disorders?
Individuals who are undergoing radioiodine cancer treatment, have eczema, or have other diseases that react adversely to dairy frequently use plant-based milk. According to a recent study, close to 40% of the global suffers from Lactose Intolerance, which is a big number. Further, plant-based milk is a recommended dairy substitute for people with irritable bowel syndrome and inflammatory bowel disease.
Individuals with gluten and nut allergies may find plant-based milk to be a viable option because it is naturally free of nuts and gluten. Oat milk contains calcium, proteins, iron, vitamins A, D, potassium, and phosphorus, among other nutrients. Several plant-based milk manufacturers supplement their products with additional nutrients for consumers with a deficiency.
It is also a good source of beta-glucans, which are beneficial to heart health. As a result, plant-based milk is a healthy option for consumers suffering from heart ailments.
How is ‘Power to the Plant’ Trend Impacting the Market Growth?
'Power to the plant' is one of the fastest growing phenomena, as more and more producers and buyers are now investing in plant based products, including dairy, vegetables, fruits, seeds, spices, and grains.
This has resulted from the effect of the vegan movement that is gaining popularity around the world especially among people with lactose-intolerance and from a change in consumer preference for dairy products.
To order to address this trend among consumers, companies shift away from conventional dairy milk to dairy alternatives and attract more customers by supplying them with what they want to their products. Plant-based milk, which is one of these more environmentally friendly beverages, would also capitalize on these various food patterns on the market.

An unified Market Research Subscription Platform, built for today’s disparate research needs.
Rising Demand for Additive-free, Chemical free & Non-GMO Milk Creating Opportunities for Growth
The detrimental influence of food additives, chemicals, antibiotics, and other substances on health is becoming more widely recognized among millennials. Millennials are anticipated to be the most vocal consumers of organic products, as they buy more natural and organic items than other generations.
According to guidelines implemented for marketing organic products, organizations need to label their products suitably. For example, organic food items are to be guaranteed with naming that whether they are 100% affirmed or incorporates only organic inclusions. Accessibility of this data fulfilled the interest for customers looking for items with different wellbeing and dietary advantages.
What is the Impact of COVID-19 on Plant-based Milk Market?
COVID-19 continues to be a significant challenge for all businesses around the world. Plant-based foods are now widely accepted by people from all walks of life. It offers a range of flavors in addition to being a good source of protein. As a result, most food firms have changed their marketing and production strategies to promote it more than other traditional healthy foods.
There have been erroneous claims made concerning plant-based foods, such as that consumers will have to forgo taste or texture, that cooking will be more complicated, or that it will not provide adequate nutrition. Because of the competition between corporations to offer a variety of items with various tastes, more possibilities are coming to market.
As a result of the COVID-19 pandemic, it encouraged most consumers to make shifting from animal-based food to plant-based food due to various health and environmental concerns.
Country-wise Insights
How Is Rising Flexitarian Diet in the U.S. Impacting the Market Growth?
According to the latest study, the U.S. is estimated to account for more than 80% of the North America market in 2021.
Consumers in the U.S. are progressively leaning towards plant-based milk over traditional milk. The key driving factors of the growing interest of plant-based beverages are the innate insufficiencies of customary dairy items, taking lactose intolerance and protein allergies as specific illustrations, and pervasiveness of Vegan food.
The rise of the flexitarian lifestyle has opened up a lot of possibilities for novel plant-based milk product development. Changing consumer lifestyles have a significant impact on the functional food and beverage business, but the ageing of the population, as well as increased chronic-degenerative diseases and rising healthcare spending, are also important drivers.
What are the Factors Fuelling the Demand for Plant-based Milk in China?
According to the latest report, China is expected to hold dominance in East Asia. Several factors indicate that China's plant-based milk market will continue to expand over the forecast period. China is expected to over 60% of sales in Asia Pacific.
Plant-based milk has a high level of acceptance in China due to a long-standing food tradition of ingesting soya products. The rising prevalence of lactose intolerance in Asia also will support overall expansion of the market.
Expanding population and popularity of western diet also will create conducive environment for expansion of the market in China.
What is Driving the Demand for Plant-based Milk in the U.K.?
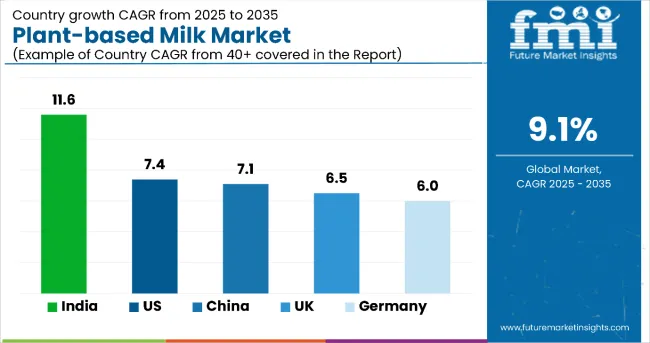
According to FMI’s analysis, the U.K. market is forecast to grow at a CAGR of 8.3%. The rising popularity of vegan, vegetarian, and flexitarian diets is driving sales in the U.K. Animal compassion is typically cited as a main motivation by vegan and vegetarian consumers. Consumer studies, on the other hand, suggest that individuals who are not totally vegetarian/vegan but follow a more "flexitarian" diet have major motivations to limit their environmental effect and support sustainability.
These trends are expected to create attractive prospects for growth in the U.K.
What are the Implications of COVID-19 on Thailand Plant-based Milk Market?
According to FMI’s analysis, the Thailand market is forecast to grow at a CAGR of 9.3%. In 2020, the COVID-19 pandemic impacted negatively on the worldwide economy. Thailand's economy was not spared, with the country's GDP seeing its worst full-year decline since independence.
The economy had to deal with demand- and supply-side shocks during the year, including a drop in external demand for products and services produced in Thailand as a result of the global economic recession and travel restrictions, as well as supply chain disruptions. COVID-19's economic impact was seen across sectors via various transmission mechanisms.
However progress in the health conscious customers and lactose sensitivity may perhaps drive oat milk industry extensively.
Category-wise Insights
How is Increasing Demand for Premium Products Driving Organic Plant-based Milk?
According to FMI analysis, organic plant-based milk segment is forecast to grow at a CAGR of 10.1%. Many premium plant-based milk manufacturers are adoption various marketing strategies to entice customers to purchase the product.
Premium product sales are now commonplace all over the world, and they are rapidly distinguishing themselves from private label.
Consumers who are willing to pay extra for high-quality ingredients and better plant-based milk are the target market for premium 'organic' variants.
Which is the Preferred Flavor Type?
According to FMI’s analysis, flavored plant-based milk segment is forecast to grow at a CAGR of 8.6%. Plant-based milk manufacturers are seeking to sell more exclusive flavors since the more varieties a manufacturer provides, the more customers it draws.
There is increasing focus on launching diverse flavors to cater to the diverse requirements of consumers.
Who are the Leading End Users of Plant-based Milk?
The demand for plant-based milk will remain considerably high in the food and beverage industry.
Plant-based milk is used as a base for smoothies, frothy soups, and baked products, in addition to coffee. It can be substituted for dairy milk in any cuisine or beverage. As a result, the demand for plant-based milk is increasing across various sectors within the food industry, from coffee shops to bakeries.
Which is the Preferred Form of plant-based milk?
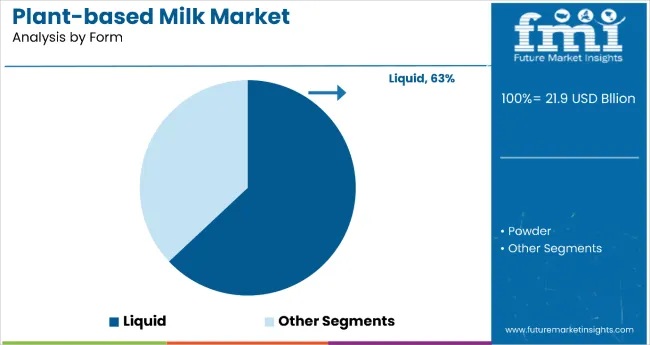
There are two forms for plant-based milk. Among these, the liquid form of plant-based milk holds more than 85% of the market share and is expected to grow at a market value CAGR of 7.6% by 2031.
How is Growing E-Commerce Making Plant-based Milk More Accessible to Consumer?
According to FMI’s analysis, online retail is forecast to grow at a CAGR of 10.8%. Consumers' busy and chaotic lifestyles, particularly in industrialized countries, leave them with little time to go to supermarkets or stores to buy the products they need on a daily basis.
However, online shopping gives consumers the convenience of being able to buy anything from an online shopping platform without having to leave their homes. Considering this, sales via ecommerce are expected to increase at an impressive rate in the coming years.
Competitive Landscape
Product launches have emerged as chief strategy among market players. With soaring competition, focus on differentiating products is expected to rise, which will encourage product launches in the plant-based milk market.
Scope of Report
Attribute |
Details |
Forecast Period |
2021-2031 |
Historical Data Available for |
2016-2020 |
Market Analysis |
USD Million for Value |
Key Countries Covered |
US, Canada, Germany, U.K., France, Italy, Spain, Russia, China, Japan, South Korea, India, Thailand, Malaysia, Indonesia, Australia, New Zealand, GCC Countries, Turkey, Northern Africa, and South Africa |
Key Segments Covered |
Nature, Form, Product Type, Flavor Type, End-Use, Sales Channel, and Region |
Key Companies Profiled |
|
Report Coverage |
Market Forecast, Company Share Analysis, Competition Intelligence, DROT Analysis, Market Dynamics and Challenges, and Strategic Growth Initiatives |
Customization and Pricing |
Available upon Request |
By Nature, Plant-based Milk Market is Segmented as:
by Category
- Organic
- Conventional
By Form:
- Liquid
- Powder
By Product Type:
- Soy Milk
- Almond Milk
- Coconut milk
- Cashew Milk
- Hemp Seed Milk
- Rice Milk
- Oat Milk
- Peanut Milk
- Pea Milk
- Hazelnut Milk
- Macadamia Milk
- Flax Milk
- Walnut
- Other Product Types (Spelt Milk, Banana, etc.)
By Flavor Type:
- Original/Unflavored
- Flavoured
- Chocolate
- Vanilla
- Strawberry
- Coconut
- Mocha
- Berry
- Hazelnut
- other Flavors
By End-use:
- Infant Formula
- Dairy Products
- Milk
- Cheese
- Yogurt
- Butter
- Spreads
- Ice Cream
- Frozen Dessert
- Bakery & Confectionary
- Milk & Milk-based Beverages
- Retail Sales
By Sales Channel:
- Direct Sales
- Indirect Sales
- Modern Trade
- Convenience Store
- Departmental Store
- Traditional Store
- Specialty Store
- Online Retailers
- Other Sales Channel
By Region:
- North America
- Latin America
- Europe
- South Asia
- East Asia
- Oceania
- Middle East & Africa
Frequently Asked Questions
The plant based milk market is forecast to reach a valuation of US$ 13.24 Bn by 2021
The plant based milk market is expected to register growth at a CAGR of 8.8% between 2021 and 2031.
The demand for plant based milk will rise in response to the increasing focus on health and wellness among consumers and rising demand for milk derived from plant-based sources. Popularity of veganism also will have positive impact on growth.
Focus on product launches, including a variety of flavors in plant based milk, will remain a key trend enabling growth in the market.
The U.S. has emerged as the largest market for plant based milk in North America. It will account for more than 80% of sales in North America in 2021.
According to FMI, the plant based milk market will rise at 9% CAGR in North America.
The Europe plant based milk market is expected to expand at 6.1% CAGR between 2021 and 2031.
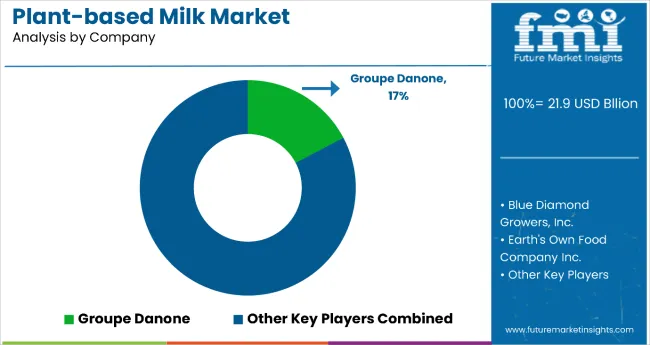
Groupe Danone, Alpina Foods, Blue Diamond Growers, Inc., Döhler GmbH, Earth’s Own Food Company Inc, Elden Foods Inc, Freedom Foods Group Ltd , Goya Foods, and Hain Celestial Group, Inc are among the top market players. These companies are expected to account for 50% to 60% of the overall market share in 2021.
The demand for plant based milk will increase at 8% year on year growth rate in 2021.
Japan will account for 2.2% of the global market, while South Korea will contribute towards 2.8% of global sales in 2021.
1. Executive Summary
1.1. Global Market Outlook
1.2. Demand Side Trends
1.3. Supply Side Trends
1.4. Technology Roadmap
1.5. Analysis and Recommendations
2. Market Overview
2.1. Market Coverage / Taxonomy
2.2. Market Definition / Scope / Limitations
3. Key Market Trends
3.1. Key Trends Impacting the Market
3.1.1. Transformed Packaging Format
3.1.2. Increased advertising spend
3.1.3. Brandishing Functional claims to acquire new customers
3.1.4. Increased retail shelves visibility
3.2. Product Innovation / Development Trends
4. Introduction to Flavor Profiles for Plant Based Milk
4.1. Manufacturers ensuring taste is the key
4.2. Flavors triggers interest
4.3. A movement towards more indulgent flavors in plant based dairy category
4.4. Going nuts about milk
4.5. Global Plant based Flavored Milk Market Outlook, 2020
4.6. Infant Formula- Plant based (% of Demand Assessment), 2021, 2031
4.6.1. Original/Unflavoured
4.6.2. Flavoured
4.6.2.1. Chocolate
4.6.2.2. Vanilla
4.6.2.3. Strawberry
4.6.2.4. Coconut
4.6.2.5. Mocha
4.6.2.6. Berry
4.6.2.7. Hazelnut
4.6.2.8. Other Flavours
5. Market Background
5.1. Macro-Economic Factors
5.1.1. Global GDP Growth Outlook
5.1.2. Global Food Industry Outlook
5.1.3. Rise in Consumption of Food Items across Globe
5.1.4. Global and Regional Per Capita Food Consumption (Kcal per capita per day)
5.1.5. Population Growth by Key Countries
5.1.6. Per Capita Plant-Based Protein Consumption
5.1.7. Dairy Health Impacts
5.1.8. Global Modern Trade Penetration and Grocery Market by Key Countries
5.1.9. Change in Consumer Price Indexes (Percentage Change) 2018 (Forecast)
5.1.10. Penetration of e commerce in F & B sector
5.1.11. Rise in Disposable Income
5.1.12. Others
5.2. Forecast Factors - Relevance & Impact
5.2.1. Adoption of public and private Safety Standards by manufactures
5.2.2. Transparency – the embracing trend
5.2.3. Foodborne Illness
5.2.4. Label Claims
5.2.5. Balance of Trade
5.2.6. Rising demand for safe and quality food products among consumers
5.2.7. Demand for ethical and sustainable products
5.2.8. Local Food Movement
5.2.9. Top 10 Players Historical Growth Rate
5.2.10. Continuous Consolidations
5.2.11. Others
5.3. Market Dynamics
5.3.1. Drivers
5.3.2. Restraints
5.3.3. Opportunity Analysis
5.4. Value Chain
5.4.1. List of Key Manufacturers
5.4.2. List of Key Brand Owners
5.4.3. List of Ingredient Suppliers
5.4.4. Operating Margins
5.4.5. Notes on Value Added at Each Node in the Value Chain
6. Survey Analysis
6.1. Consumer Sentimental Analysis
6.1.1. Factors influencing target market behaviour
6.1.2. Which specific brand is preferred by the consumers and why?
6.1.3. How consumers perceive the existing target market brands in terms of value for money and how important is brand for a customer?
6.1.4. Which factor would consumers like to change among the currently available target market products
6.1.5. Are consumers ready to pay premium price for target market product type?
6.1.6. Does social media influence customer’s decision making?
6.1.7. Which mode of advertisement does vendors prefer?
6.1.8. Which of the social media platforms does companies prefers for branding?
6.1.9. What are the key challenges associated with the target market suppliers?
6.1.10. Others
6.2. Social Media Sentimental Analysis
6.2.1. Consumer perception for products on social media platforms- Positive and Negative Mentions
6.2.2. Trending Brands
6.2.3. Social Media Platform Mentions (% of total mentions)
6.2.4. Region-wise Social Media Mentions (% total mentions)
6.2.5. Overall Sentiment on Social Media Platforms- By End Use Applications
6.2.6. Others
7. Key Success Factors
7.1. Product Adoption / Consumption Analysis
7.2. Product Attractiveness amongst Target Audience
7.3. Strategic Promotional Strategies
8. Scenario Assessment of the Impact of COVID-19 on Plant based Milk Markets
8.1. Current Scenario/ Immediate Actions
8.2. Customers will change some behaviors permanently- accelerating prior trends; bold action now can set you up for success through the downturn and beyond
8.3. Global Plant based Milk Market Forecast Scenario Comparison of Annual Growth Rates for short Term (2020-2023) and Long Term (2024-2030)
8.3.1. Optimistic Scenario
8.3.1.1. China
8.3.1.2. US
8.3.1.3. Euro Zone
8.3.1.4. Asia Pacific
8.3.1.5. Rest of the World
8.3.2. Likely Scenario
8.3.2.1. China
8.3.2.2. US
8.3.2.3. Euro Zone
8.3.2.4. Asia Pacific
8.3.2.5. Rest of the World
8.3.3. Pessimistic Scenario
8.3.3.1. China
8.3.3.2. US
8.3.3.3. Euro Zone
8.3.3.4. Asia Pacific
8.3.3.5. Rest of the World
8.4. Key Factors Impacting the Market
9. Global Plant-based Milk Market Demand Analysis 2016-2020 and Forecast, 2021-2031
9.1. Historical Market Volume (Mn Units) Analysis, 2016-2020
9.2. Current and Future Market Volume (Mn Units) Projections, 2021-2031
9.3. Y-o-Y Growth Trend Analysis
10. Global Plant-based Milk Market - Pricing Analysis
10.1. Regional Pricing Analysis By Product Type
10.2. Pricing Break-up
10.2.1. Manufacturer Level Pricing
10.2.2. Distributor Level Pricing
10.2.3. Retail Level Pricing
10.3. Global Average Pricing Analysis Benchmark
11. Global Plant-based Milk Market Demand (in Value or Size in US$ Mn) Analysis 2016-2020 and Forecast, 2021-2031
11.1. Historical Market Value (US$ Mn) Analysis, 2016-2020
11.2. Current and Future Market Value (US$ Mn) Projections, 2021-2031
11.2.1. Y-o-Y Growth Trend Analysis
11.2.2. Absolute $ Opportunity Analysis
12. Global Plant-based Milk Market Analysis 2016-2020 and Forecast, 2021-2031, by Product Type
12.1. Introduction / Key Findings
12.2. Historical Market Size (US$ Mn) and Volume Analysis By Product Type, 2016-2020
12.3. Current and Future Market Size (US$ Mn) and Volume Analysis and Forecast By Product Type, 2021-2031
12.3.1. Soy Milk
12.3.2. Almond Milk
12.3.3. Coconut milk
12.3.4. Cashew Milk
12.3.5. Hemp Seed Milk
12.3.6. Rice Milk
12.3.7. Oat Milk
12.3.8. Peanut Milk
12.3.9. Pea Milk
12.3.10. Hazelnut Milk
12.3.11. Macadamia Milk
12.3.12. Flax Milk
12.3.13. Walnut
12.3.14. Other Product Types (Spelt Milk, Banana, etc.)
12.4. Market Attractiveness Analysis By Product Type
13. Global Plant-based Milk Market Analysis 2016-2020 and Forecast, 2021-2031, by Flavor
13.1. Introduction / Key Findings
13.2. Historical Market Size (US$ Mn) and Volume Analysis By Flavor, 2016-2020
13.3. Current and Future Market Size (US$ Mn) and Volume Analysis and Forecast By Flavor, 2021-2031
13.3.1. Original/Unflavoured
13.3.2. Flavoured
13.3.2.1. Chocolate
13.3.2.2. Vanilla
13.3.2.3. Strawberry
13.3.2.4. Coconut
13.3.2.5. Mocha
13.3.2.6. Berry
13.3.2.7. Hazelnut
13.3.2.8. Other Flavours
13.4. Market Attractiveness Analysis By Flavor
14. Global Plant-based Milk Market Analysis 2016-2020 and Forecast, 2021-2031, by Form
14.1. Introduction / Key Findings
14.2. Historical Market Size (US$ Mn) and Volume Analysis By Form, 2016-2020
14.3. Current and Future Market Size (US$ Mn) and Volume Analysis and Forecast By Form, 2021-2031
14.3.1. Liquid
14.3.2. Powder
14.4. Market Attractiveness Analysis By Form
15. Global Plant-based Milk Market Analysis 2016-2020 and Forecast, 2021-2031, by Nature
15.1. Introduction / Key Findings
15.2. Historical Market Size (US$ Mn) and Volume Analysis By Nature, 2016-2020
15.3. Current and Future Market Size (US$ Mn) and Volume Analysis and Forecast By Nature, 2021-2031
15.3.1. Organic
15.3.2. Conventional
15.4. Market Attractiveness Analysis By Nature
16. Global Plant-based Milk Market Analysis 2016-2020 and Forecast, 2021-2031, by End-Use
16.1. Introduction / Key Findings
16.2. Historical Market Size (US$ Mn) and Volume Analysis By End-Use, 2016-2020
16.3. Current and Future Market Size (US$ Mn) and Volume Analysis and Forecast By End-Use, 2021-2031
16.3.1. Infant Formula
16.3.2. Dairy Products
16.3.2.1. Milk
16.3.2.2. Cheese
16.3.2.3. Yogurt
16.3.2.4. Butter
16.3.2.5. Spreads
16.3.2.6. Ice Cream
16.3.2.7. Frozen Dessert
16.3.3. Bakery & Confectionary
16.3.4. Milk & Milk-based Beverages
16.3.5. Retail Sales
16.4. Market Attractiveness Analysis By End-Use
17. Global Plant-based Milk Market Analysis 2016-2020 and Forecast, 2021-2031, by Sales Channel
17.1. Introduction / Key Findings
17.2. Historical Market Size (US$ Mn) and Volume Analysis By Sales Channel, 2016-2020
17.3. Current and Future Market Size (US$ Mn) and Volume Analysis and Forecast By Sales Channel, 2021-2031
17.3.1. Direct Sales
17.3.2. Indirect Sales
17.3.2.1. Modern Trade
17.3.2.2. Convenience Store
17.3.2.3. Departmental Store
17.3.2.4. Traditional Store
17.3.2.5. Specialty Store
17.3.2.6. Online Retailers
17.3.2.7. Other Sales Channel
17.4. Market Attractiveness Analysis By Sales Channel
18. Global Plant-based Milk Market Analysis 2016-2020 and Forecast, 2021-2031, by Region
18.1. Introduction
18.2. Historical Market Size (US$ Mn) and Volume Analysis By Region, 2016-2020
18.3. Current Market Size (US$ Mn) and Volume Analysis and Forecast By Region, 2021-2031
18.3.1. North America
18.3.2. Latin America
18.3.3. Europe
18.3.4. Middle East and Africa (MEA)
18.3.5. East Asia
18.3.6. South Asia
18.3.7. Oceania
18.4. Market Attractiveness Analysis By Region
19. North America Plant-based Milk Market Analysis 2016-2020 and Forecast, 2021-2031
19.1. Introduction
19.2. Pricing Analysis
19.3. Historical Market Size (US$ Mn) and Volume Trend Analysis By Market Taxonomy, 2016-2020
19.4. Market Size (US$ Mn) and Volume Forecast By Market Taxonomy, 2021-2031
19.4.1. By Country
19.4.1.1. U.S. (Market Share Analysis 2016, 2021)
19.4.1.1.1. By Product Type
19.4.1.1.2. By Flavor
19.4.1.1.3. By Form
19.4.1.1.4. By Nature
19.4.1.1.5. By End-Use
19.4.1.1.6. By Sales Channel
19.4.1.2. Canada (Market Share Analysis 2016, 2021)
19.4.1.2.1. By Product Type
19.4.1.2.2. By Flavor
19.4.1.2.3. By Form
19.4.1.2.4. By Nature
19.4.1.2.5. By End-Use
19.4.1.2.6. By Sales Channel
19.4.2. By Product Type
19.4.3. By Flavor
19.4.4. By Form
19.4.5. By Nature
19.4.6. By End-Use
19.4.7. By Sales Channel
19.5. Market Attractiveness Analysis
19.5.1. By Country
19.5.2. By Product Type
19.5.3. By Flavor
19.5.4. By Form
19.5.5. By Nature
19.5.6. By End-Use
19.5.7. By Sales Channel
19.6. Market Trends
19.7. Key Market Participants - Intensity Mapping
19.8. Drivers and Restraints - Impact Analysis
20. Latin America Plant-based Milk Market Analysis 2016-2020 and Forecast, 2021-2031
20.1. Introduction
20.2. Pricing Analysis
20.3. Historical Market Size (US$ Mn) and Volume Trend Analysis By Market Taxonomy, 2016-2020
20.4. Market Size (US$ Mn) and Volume Forecast By Market Taxonomy, 2021-2031
20.4.1. By Country
20.4.1.1. Brazil (Market Share Analysis 2016, 2021)
20.4.1.1.1. By Product Type
20.4.1.1.2. By Flavor
20.4.1.1.3. By Form
20.4.1.1.4. By Nature
20.4.1.1.5. By End-Use
20.4.1.1.6. By Sales Channel
20.4.1.2. Mexico (Market Share Analysis 2016, 2021)
20.4.1.2.1. By Product Type
20.4.1.2.2. By Flavor
20.4.1.2.3. By Form
20.4.1.2.4. By Nature
20.4.1.2.5. By End-Use
20.4.1.2.6. By Sales Channel
20.4.1.3. Chile (Market Share Analysis 2016, 2021)
20.4.1.3.1. By Product Type
20.4.1.3.2. By Flavor
20.4.1.3.3. By Form
20.4.1.3.4. By Nature
20.4.1.3.5. By End-Use
20.4.1.3.6. By Sales Channel
20.4.1.4. Peru (Market Share Analysis 2016, 2021)
20.4.1.4.1. By Product Type
20.4.1.4.2. By Flavor
20.4.1.4.3. By Form
20.4.1.4.4. By Nature
20.4.1.4.5. By End-Use
20.4.1.4.6. By Sales Channel
20.4.1.5. Argentina (Market Share Analysis 2016, 2021)
20.4.1.5.1. By Product Type
20.4.1.5.2. By Flavor
20.4.1.5.3. By Form
20.4.1.5.4. By Nature
20.4.1.5.5. By End-Use
20.4.1.5.6. By Sales Channel
20.4.1.6. Rest of Latin America
20.4.2. By Product Type
20.4.3. By Flavor
20.4.4. By Form
20.4.5. By Nature
20.4.6. By End-Use
20.4.7. By Sales Channel
20.5. Market Attractiveness Analysis
20.5.1. By Country
20.5.2. By Product Type
20.5.3. By Flavor
20.5.4. By Form
20.5.5. By Nature
20.5.6. By End-Use
20.5.7. By Sales Channel
20.6. Market Trends
20.7. Key Market Participants - Intensity Mapping
20.8. Drivers and Restraints - Impact Analysis
21. Europe Plant-based Milk Market Analysis 2016-2020 and Forecast, 2021-2031
21.1. Introduction
21.2. Pricing Analysis
21.3. Historical Market Size (US$ Mn) and Volume Trend Analysis By Market Taxonomy, 2016-2020
21.4. Market Size (US$ Mn) and Volume Forecast By Market Taxonomy, 2021-2031
21.4.1. By Country
21.4.1.1. Germany (Market Share Analysis 2016, 2021)
21.4.1.1.1. By Product Type
21.4.1.1.2. By Flavor
21.4.1.1.3. By Form
21.4.1.1.4. By Nature
21.4.1.1.5. By End-Use
21.4.1.1.6. By Sales Channel
21.4.1.2. Italy (Market Share Analysis 2016, 2021)
21.4.1.2.1. By Product Type
21.4.1.2.2. By Flavor
21.4.1.2.3. By Form
21.4.1.2.4. By Nature
21.4.1.2.5. By End-Use
21.4.1.2.6. By Sales Channel
21.4.1.3. France (Market Share Analysis 2016, 2021)
21.4.1.3.1. By Product Type
21.4.1.3.2. By Flavor
21.4.1.3.3. By Form
21.4.1.3.4. By Nature
21.4.1.3.5. By End-Use
21.4.1.3.6. By Sales Channel
21.4.1.4. U.K. (Market Share Analysis 2016, 2021)
21.4.1.4.1. By Product Type
21.4.1.4.2. By Flavor
21.4.1.4.3. By Form
21.4.1.4.4. By Nature
21.4.1.4.5. By End-Use
21.4.1.4.6. By Sales Channel
21.4.1.5. Spain (Market Share Analysis 2016, 2021)
21.4.1.5.1. By Product Type
21.4.1.5.2. By Flavor
21.4.1.5.3. By Form
21.4.1.5.4. By Nature
21.4.1.5.5. By End-Use
21.4.1.5.6. By Sales Channel
21.4.1.6. BENELUX (Market Share Analysis 2016, 2021)
21.4.1.6.1. By Product Type
21.4.1.6.2. By Flavor
21.4.1.6.3. By Form
21.4.1.6.4. By Nature
21.4.1.6.5. By End-Use
21.4.1.6.6. By Sales Channel
21.4.1.7. Russia (Market Share Analysis 2016, 2021)
21.4.1.7.1. By Product Type
21.4.1.7.2. By Flavor
21.4.1.7.3. By Form
21.4.1.7.4. By Nature
21.4.1.7.5. By End-Use
21.4.1.7.6. By Sales Channel
21.4.1.8. Poland (Market Share Analysis 2016, 2021)
21.4.1.8.1. By Product Type
21.4.1.8.2. By Flavor
21.4.1.8.3. By Form
21.4.1.8.4. By Nature
21.4.1.8.5. By End-Use
21.4.1.8.6. By Sales Channel
21.4.1.9. Nordic (Market Share Analysis 2016, 2021)
21.4.1.9.1. By Product Type
21.4.1.9.2. By Flavor
21.4.1.9.3. By Form
21.4.1.9.4. By Nature
21.4.1.9.5. By End-Use
21.4.1.9.6. By Sales Channel
21.4.1.10. Rest of Europe
21.4.2. By Product Type
21.4.3. By Flavor
21.4.4. By Form
21.4.5. By Nature
21.4.6. By End-Use
21.4.7. By Sales Channel
21.5. Market Attractiveness Analysis
21.5.1. By Country
21.5.2. By Product Type
21.5.3. By Flavor
21.5.4. By Form
21.5.5. By Nature
21.5.6. By End-Use
21.5.7. By Sales Channel
21.6. Market Trends
21.7. Key Market Participants - Intensity Mapping
21.8. Drivers and Restraints - Impact Analysis
22. South Asia Plant-based Milk Market Analysis 2016-2020 and Forecast, 2021-2031
22.1. Introduction
22.2. Pricing Analysis
22.3. Historical Market Size (US$ Mn) and Volume Trend Analysis By Market Taxonomy, 2016-2020
22.4. Market Size (US$ Mn) and Volume Forecast By Market Taxonomy, 2021-2031
22.4.1. By Country
22.4.1.1. India (Market Share Analysis 2016, 2021)
22.4.1.1.1. By Product Type
22.4.1.1.2. By Flavor
22.4.1.1.3. By Form
22.4.1.1.4. By Nature
22.4.1.1.5. By End-Use
22.4.1.1.6. By Sales Channel
22.4.1.2. Thailand (Market Share Analysis 2016, 2021)
22.4.1.2.1. By Product Type
22.4.1.2.2. By Flavor
22.4.1.2.3. By Form
22.4.1.2.4. By Nature
22.4.1.2.5. By End-Use
22.4.1.2.6. By Sales Channel
22.4.1.3. Indonesia (Market Share Analysis 2016, 2021)
22.4.1.3.1. By Product Type
22.4.1.3.2. By Flavor
22.4.1.3.3. By Form
22.4.1.3.4. By Nature
22.4.1.3.5. By End-Use
22.4.1.3.6. By Sales Channel
22.4.1.4. Malaysia (Market Share Analysis 2016, 2021)
22.4.1.4.1. By Product Type
22.4.1.4.2. By Flavor
22.4.1.4.3. By Form
22.4.1.4.4. By Nature
22.4.1.4.5. By End-Use
22.4.1.4.6. By Sales Channel
22.4.1.5. Rest of South Asia
22.4.2. By Product Type
22.4.3. By Flavor
22.4.4. By Form
22.4.5. By Nature
22.4.6. By End-Use
22.4.7. By Sales Channel
22.5. Market Attractiveness Analysis
22.5.1. By Country
22.5.2. By Product Type
22.5.3. By Flavor
22.5.4. By Form
22.5.5. By Nature
22.5.6. By End-Use
22.5.7. By Sales Channel
22.6. Market Trends
22.7. Key Market Participants - Intensity Mapping
22.8. Drivers and Restraints - Impact Analysis
23. East Asia Plant-based Milk Market Analysis 2016-2020 and Forecast, 2021-2031
23.1. Introduction
23.2. Pricing Analysis
23.3. Historical Market Size (US$ Mn) and Volume Trend Analysis By Market Taxonomy, 2016-2020
23.4. Market Size (US$ Mn) and Volume Forecast By Market Taxonomy, 2021-2031
23.4.1. By Country
23.4.1.1. China (Market Share Analysis 2016, 2021)
23.4.1.1.1. By Product Type
23.4.1.1.2. By Flavor
23.4.1.1.3. By Form
23.4.1.1.4. By Nature
23.4.1.1.5. By End-Use
23.4.1.1.6. By Sales Channel
23.4.1.2. Japan (Market Share Analysis 2016, 2021)
23.4.1.2.1. By Product Type
23.4.1.2.2. By Flavor
23.4.1.2.3. By Form
23.4.1.2.4. By Nature
23.4.1.2.5. By End-Use
23.4.1.2.6. By Sales Channel
23.4.1.3. South Korea (Market Share Analysis 2016, 2021)
23.4.1.3.1. By Product Type
23.4.1.3.2. By Flavor
23.4.1.3.3. By Form
23.4.1.3.4. By Nature
23.4.1.3.5. By End-Use
23.4.1.3.6. By Sales Channel
23.4.2. By Product Type
23.4.3. By Flavor
23.4.4. By Form
23.4.5. By Nature
23.4.6. By End-Use
23.4.7. By Sales Channel
23.5. Market Attractiveness Analysis
23.5.1. By Country
23.5.2. By Product Type
23.5.3. By Flavor
23.5.4. By Form
23.5.5. By Nature
23.5.6. By End-Use
23.5.7. By Sales Channel
23.6. Market Trends
23.7. Key Market Participants - Intensity Mapping
23.8. Drivers and Restraints - Impact Analysis
24. Oceania Plant-based Milk Market Analysis 2016-2020 and Forecast, 2021-2031
24.1. Introduction
24.2. Pricing Analysis
24.3. Historical Market Size (US$ Mn) and Volume Trend Analysis By Market Taxonomy, 2016-2020
24.4. Market Size (US$ Mn) and Volume Forecast By Market Taxonomy, 2021-2031
24.4.1. By Country
24.4.1.1. Australia (Market Share Analysis 2016, 2021)
24.4.1.1.1. By Product Type
24.4.1.1.2. By Flavor
24.4.1.1.3. By Form
24.4.1.1.4. By Nature
24.4.1.1.5. By End-Use
24.4.1.1.6. By Sales Channel
24.4.1.2. New Zealand (Market Share Analysis 2016, 2021)
24.4.1.2.1. By Product Type
24.4.1.2.2. By Flavor
24.4.1.2.3. By Form
24.4.1.2.4. By Nature
24.4.1.2.5. By End-Use
24.4.1.2.6. By Sales Channel
24.4.2. By Product Type
24.4.3. By Flavor
24.4.4. By Form
24.4.5. By Nature
24.4.6. By End-Use
24.4.7. By Sales Channel
24.5. Market Attractiveness Analysis
24.5.1. By Country
24.5.2. By Product Type
24.5.3. By Flavor
24.5.4. By Form
24.5.5. By Nature
24.5.6. By End-Use
24.5.7. By Sales Channel
24.6. Market Trends
24.7. Key Market Participants - Intensity Mapping
24.8. Drivers and Restraints - Impact Analysis
25. Middle East and Africa Plant-based Milk Market Analysis 2016-2020 and Forecast, 2021-2031
25.1. Introduction
25.2. Pricing Analysis
25.3. Historical Market Size (US$ Mn) and Volume Trend Analysis By Market Taxonomy, 2016-2020
25.4. Market Size (US$ Mn) and Volume Forecast By Market Taxonomy, 2021-2031
25.4.1. By Country
25.4.1.1. GCC Countries (Market Share Analysis 2016, 2021)
25.4.1.1.1. By Product Type
25.4.1.1.2. By Flavor
25.4.1.1.3. By Form
25.4.1.1.4. By Nature
25.4.1.1.5. By End-Use
25.4.1.1.6. By Sales Channel
25.4.1.2. Central Africa (Market Share Analysis 2016, 2021)
25.4.1.2.1. By Product Type
25.4.1.2.2. By Flavor
25.4.1.2.3. By Form
25.4.1.2.4. By Nature
25.4.1.2.5. By End-Use
25.4.1.2.6. By Sales Channel
25.4.1.3. Northern Africa (Market Share Analysis 2016, 2021)
25.4.1.3.1. By Product Type
25.4.1.3.2. By Flavor
25.4.1.3.3. By Form
25.4.1.3.4. By Nature
25.4.1.3.5. By End-Use
25.4.1.3.6. By Sales Channel
25.4.1.4. South Africa (Market Share Analysis 2016, 2021)
25.4.1.4.1. By Product Type
25.4.1.4.2. By Flavor
25.4.1.4.3. By Form
25.4.1.4.4. By Nature
25.4.1.4.5. By End-Use
25.4.1.4.6. By Sales Channel
25.4.2. By Product Type
25.4.3. By Flavor
25.4.4. By Form
25.4.5. By Nature
25.4.6. By End-Use
25.4.7. By Sales Channel
25.5. Market Attractiveness Analysis
25.5.1. By Country
25.5.2. By Product Type
25.5.3. By Flavor
25.5.4. By Form
25.5.5. By Nature
25.5.6. By End-Use
25.5.7. By Sales Channel
25.6. Market Trends
25.7. Key Market Participants - Intensity Mapping
25.8. Drivers and Restraints - Impact Analysis
26. Competitive Assessment
26.1. Global Plant-based Milk Market Competition - a Dashboard View
26.2. Global Plant-based Milk Market Structure Analysis
26.3. Global Plant-based Milk Market Company Share Analysis
26.3.1. Company Market Share Analysis of Top 10 Players, By Region
26.3.2. Company Market Share Analysis of Top 10 Players, By Product Type
26.4. Key Participants Market Presence (Intensity Mapping) by Region
27. Competition Analysis
27.1. Competition Dashboard
27.2. Competition Deep Dive
27.2.1. Groupe Danone
27.2.1.1. Overview
27.2.1.2. Product Portfolio
27.2.1.3. Profitability by Market Segments (Product/Channel/Region)
27.2.1.4. Sales Footprint
27.2.1.5. Strategy Overview
27.2.1.5.1. Marketing Strategy
27.2.1.5.2. Product Strategy
27.2.1.5.3. Channel Strategy
27.2.2. Alpina Foods
27.2.2.1. Overview
27.2.2.2. Product Portfolio
27.2.2.3. Profitability by Market Segments (Product/Channel/Region)
27.2.2.4. Sales Footprint
27.2.2.5. Strategy Overview
27.2.2.5.1. Marketing Strategy
27.2.2.5.2. Product Strategy
27.2.2.5.3. Channel Strategy
27.2.3. Blue Diamond Growers, Inc.
27.2.3.1. Overview
27.2.3.2. Product Portfolio
27.2.3.3. Profitability by Market Segments (Product/Channel/Region)
27.2.3.4. Sales Footprint
27.2.3.5. Strategy Overview
27.2.3.5.1. Marketing Strategy
27.2.3.5.2. Product Strategy
27.2.3.5.3. Channel Strategy
27.2.4. Döhler GmbH
27.2.4.1. Overview
27.2.4.2. Product Portfolio
27.2.4.3. Profitability by Market Segments (Product/Channel/Region)
27.2.4.4. Sales Footprint
27.2.4.5. Strategy Overview
27.2.4.5.1. Marketing Strategy
27.2.4.5.2. Product Strategy
27.2.4.5.3. Channel Strategy
27.2.5. Earth’s Own Food Company Inc
27.2.5.1. Overview
27.2.5.2. Product Portfolio
27.2.5.3. Profitability by Market Segments (Product/Channel/Region)
27.2.5.4. Sales Footprint
27.2.5.5. Strategy Overview
27.2.5.5.1. Marketing Strategy
27.2.5.5.2. Product Strategy
27.2.5.5.3. Channel Strategy
27.2.6. Elden Foods Inc
27.2.6.1. Overview
27.2.6.2. Product Portfolio
27.2.6.3. Profitability by Market Segments (Product/Channel/Region)
27.2.6.4. Sales Footprint
27.2.6.5. Strategy Overview
27.2.6.5.1. Marketing Strategy
27.2.6.5.2. Product Strategy
27.2.6.5.3. Channel Strategy
27.2.7. Freedom Foods Group Ltd
27.2.7.1. Overview
27.2.7.2. Product Portfolio
27.2.7.3. Profitability by Market Segments (Product/Channel/Region)
27.2.7.4. Sales Footprint
27.2.7.5. Strategy Overview
27.2.7.5.1. Marketing Strategy
27.2.7.5.2. Product Strategy
27.2.7.5.3. Channel Strategy
27.2.8. Goya Foods
27.2.8.1. Overview
27.2.8.2. Product Portfolio
27.2.8.3. Profitability by Market Segments (Product/Channel/Region)
27.2.8.4. Sales Footprint
27.2.8.5. Strategy Overview
27.2.8.5.1. Marketing Strategy
27.2.8.5.2. Product Strategy
27.2.8.5.3. Channel Strategy
27.2.9. Groupe Danone
27.2.9.1. Overview
27.2.9.2. Product Portfolio
27.2.9.3. Profitability by Market Segments (Product/Channel/Region)
27.2.9.4. Sales Footprint
27.2.9.5. Strategy Overview
27.2.9.5.1. Marketing Strategy
27.2.9.5.2. Product Strategy
27.2.9.5.3. Channel Strategy
27.2.10. Hain Celestial Group, Inc
27.2.10.1. Overview
27.2.10.2. Product Portfolio
27.2.10.3. Profitability by Market Segments (Product/Channel/Region)
27.2.10.4. Sales Footprint
27.2.10.5. Strategy Overview
27.2.10.5.1. Marketing Strategy
27.2.10.5.2. Product Strategy
27.2.10.5.3. Channel Strategy
27.2.11. Kaslink Foods Oy Ltd
27.2.11.1. Overview
27.2.11.2. Product Portfolio
27.2.11.3. Profitability by Market Segments (Product/Channel/Region)
27.2.11.4. Sales Footprint
27.2.11.5. Strategy Overview
27.2.11.5.1. Marketing Strategy
27.2.11.5.2. Product Strategy
27.2.11.5.3. Channel Strategy
27.2.12. Living Harvest Foods Inc
27.2.12.1. Overview
27.2.12.2. Product Portfolio
27.2.12.3. Profitability by Market Segments (Product/Channel/Region)
27.2.12.4. Sales Footprint
27.2.12.5. Strategy Overview
27.2.12.5.1. Marketing Strategy
27.2.12.5.2. Product Strategy
27.2.12.5.3. Channel Strategy
27.2.13. Liwayway Holdings Company Limited
27.2.13.1. Overview
27.2.13.2. Product Portfolio
27.2.13.3. Profitability by Market Segments (Product/Channel/Region)
27.2.13.4. Sales Footprint
27.2.13.5. Strategy Overview
27.2.13.5.1. Marketing Strategy
27.2.13.5.2. Product Strategy
27.2.13.5.3. Channel Strategy
27.2.14. Mc Cormick & Co.
27.2.14.1. Overview
27.2.14.2. Product Portfolio
27.2.14.3. Profitability by Market Segments (Product/Channel/Region)
27.2.14.4. Sales Footprint
27.2.14.5. Strategy Overview
27.2.14.5.1. Marketing Strategy
27.2.14.5.2. Product Strategy
27.2.14.5.3. Channel Strategy
27.2.15. Natura Foods
27.2.15.1. Overview
27.2.15.2. Product Portfolio
27.2.15.3. Profitability by Market Segments (Product/Channel/Region)
27.2.15.4. Sales Footprint
27.2.15.5. Strategy Overview
27.2.15.5.1. Marketing Strategy
27.2.15.5.2. Product Strategy
27.2.15.5.3. Channel Strategy
27.2.16. Nutriops SL
27.2.16.1. Overview
27.2.16.2. Product Portfolio
27.2.16.3. Profitability by Market Segments (Product/Channel/Region)
27.2.16.4. Sales Footprint
27.2.16.5. Strategy Overview
27.2.16.5.1. Marketing Strategy
27.2.16.5.2. Product Strategy
27.2.16.5.3. Channel Strategy
27.2.17. Organic Valley.
27.2.17.1. Overview
27.2.17.2. Product Portfolio
27.2.17.3. Profitability by Market Segments (Product/Channel/Region)
27.2.17.4. Sales Footprint
27.2.17.5. Strategy Overview
27.2.17.5.1. Marketing Strategy
27.2.17.5.2. Product Strategy
27.2.17.5.3. Channel Strategy
27.2.18. Pacific Foods of Oregon, Inc.
27.2.18.1. Overview
27.2.18.2. Product Portfolio
27.2.18.3. Profitability by Market Segments (Product/Channel/Region)
27.2.18.4. Sales Footprint
27.2.18.5. Strategy Overview
27.2.18.5.1. Marketing Strategy
27.2.18.5.2. Product Strategy
27.2.18.5.3. Channel Strategy
27.2.19. Other Key Players (On Additional Demand)
27.2.19.1. Overview
27.2.19.2. Product Portfolio
27.2.19.3. Profitability by Market Segments (Product/Channel/Region)
27.2.19.4. Sales Footprint
27.2.19.5. Strategy Overview
27.2.19.5.1. Marketing Strategy
27.2.19.5.2. Product Strategy
27.2.19.5.3. Channel Strategy
28. Assumptions and Acronyms Used
29. Research Methodology
Let us know your requirement to get
100% FREE customization
Table 1: Global Plant-based Milk Market Value (US$ Mn) and Forecast by Region, 2016–2020
Table 2: Global Plant-based Milk Market Value (US$ Mn) and Forecast by Region, 2021–2031
Table 3: Global Plant-based Milk Market Volume (Metric Tons) and Forecast by Region, 2016–2020
Table 4: Global Plant-based Milk Market Volume (Metric Tons) and Forecast by Region, 2021–2031
Table 5: Global Plant-based Milk Market Value (US$ Mn) and Forecast by Product Type, 2016–2020
Table 6: Global Plant-based Milk Market Value (US$ Mn) and Forecast by Product Type, 2021–2031
Table 7: Global Plant-based Milk Market Volume (Metric Tons) and Forecast by Product Type, 2016–2020
Table 8: Global Plant-based Milk Market Volume (Metric Tons) and Forecast by Product Type, 2021–2031
Table 9: Global Plant-based Milk Market Value (US$ Mn) and Forecast by Form, 2016–2020
Table 10: Global Plant-based Milk Market Value (US$ Mn) and Forecast by Form, 2021–2031
Table 11: Global Plant-based Milk Market Volume (Metric Tons) and Forecast by Form, 2016–2020
Table 12: Global Plant-based Milk Market Volume (Metric Tons) and Forecast by Form, 2021–2031
Table 13: Global Plant-based Milk Market Value (US$ Mn) and Forecast by Flavor, 2016–2020
Table 14: Global Plant-based Milk Market Value (US$ Mn) and Forecast by Flavor, 2021–2031
Table 15: Global Plant-based Milk Market Volume (Metric Tons) and Forecast by Flavor, 2016–2020
Table 16: Global Plant-based Milk Market Volume (Metric Tons) and Forecast by Flavor, 2021–2031
Table 17: Global Plant-based Milk Market Value (US$ Mn) and Forecast by Nature, 2016–2020
Table 18: Global Plant-based Milk Market Value (US$ Mn) and Forecast by Nature, 2021–2031
Table 19: Global Plant-based Milk Market Volume (Metric Tons) and Forecast by Nature, 2016–2020
Table 20: Global Plant-based Milk Market Volume (Metric Tons) and Forecast by Nature, 2021–2031
Table 21: Global Plant-based Milk Market Value (US$ Mn) and Forecast by End Use, 2016–2020
Table 22: Global Plant-based Milk Market Value (US$ Mn) and Forecast by End Use, 2021–2031
Table 23: Global Plant-based Milk Market Volume (Metric Tons) and Forecast by End Use, 2016–2020
Table 24: Global Plant-based Milk Market Volume (Metric Tons) and Forecast by End Use, 2021–2031
Table 25: Global Plant-based Milk Market Value (US$ Mn) and Forecast by Sales Channel, 2016–2020
Table 26: Global Plant-based Milk Market Value (US$ Mn) and Forecast by Sales Channel, 2021–2031
Table 27: Global Plant-based Milk Market Volume (Metric Tons) and Forecast by Sales Channel, 2016–2020
Table 28: Global Plant-based Milk Market Volume (Metric Tons) and Forecast by Sales Channel, 2021–2031
Table 29: North America Plant-based Milk Market Value (US$ Mn) and Forecast by Country, 2016–2020
Table 30: North America Plant-based Milk Market Value (US$ Mn) and Forecast by Country, 2021–2031
Table 31: North America Plant-based Milk Market Volume (Metric Tons) and Forecast by Country, 2016–2020
Table 32: North America Plant-based Milk Market Volume (Metric Tons) and Forecast by Country, 2021–2031
Table 33: North America Plant-based Milk Market Value (US$ Mn) and Forecast by Product Type, 2016–2020
Table 34: North America Plant-based Milk Market Value (US$ Mn) and Forecast by Product Type, 2021–2031
Table 35: North America Plant-based Milk Market Volume (Metric Tons) and Forecast by Product Type, 2016–2020
Table 36: North America Plant-based Milk Market Volume (Metric Tons) and Forecast by Product Type, 2021–2031
Table 37: North America Plant-based Milk Market Value (US$ Mn) and Forecast by Form, 2016–2020
Table 38: North America Plant-based Milk Market Value (US$ Mn) and Forecast by Form, 2021–2031
Table 39: North America Plant-based Milk Market Volume (Metric Tons) and Forecast by Form, 2016–2020
Table 40: North America Plant-based Milk Market Volume (Metric Tons) and Forecast by Form, 2021–2031
Table 41: North America Plant-based Milk Market Value (US$ Mn) and Forecast by Flavor, 2016–2020
Table 42: North America Plant-based Milk Market Value (US$ Mn) and Forecast by Flavor, 2021–2031
Table 43: North America Plant-based Milk Market Volume (Metric Tons) and Forecast by Flavor, 2016–2020
Table 44: North America Plant-based Milk Market Volume (Metric Tons) and Forecast by Flavor, 2021–2031
Table 45: North America Plant-based Milk Market Value (US$ Mn) and Forecast by Nature, 2016–2020
Table 46: North America Plant-based Milk Market Value (US$ Mn) and Forecast by Nature, 2021–2031
Table 47: North America Plant-based Milk Market Volume (Metric Tons) and Forecast by Nature, 2016–2020
Table 48: North America Plant-based Milk Market Volume (Metric Tons) and Forecast by Nature, 2021–2031
Table 49: North America Plant-based Milk Market Value (US$ Mn) and Forecast by End Use, 2016–2020
Table 50: North America Plant-based Milk Market Value (US$ Mn) and Forecast by End Use, 2021–2031
Table 51: North America Plant-based Milk Market Volume (Metric Tons) and Forecast by End Use, 2016–2020
Table 52: North America Plant-based Milk Market Volume (Metric Tons) and Forecast by End Use, 2021–2031
Table 53: North America Plant-based Milk Market Value (US$ Mn) and Forecast by Sales Channel, 2016–2020
Table 54: North America Plant-based Milk Market Value (US$ Mn) and Forecast by Sales Channel, 2021–2031
Table 55: North America Plant-based Milk Market Volume (Metric Tons) and Forecast by Sales Channel, 2016–2020
Table 56: North America Plant-based Milk Market Volume (Metric Tons) and Forecast by Sales Channel, 2021–2031
Table 57: Latin America Plant-based Milk Market Value (US$ Mn) and Forecast by Country, 2016–2020
Table 58: Latin America Plant-based Milk Market Value (US$ Mn) and Forecast by Country, 2021–2031
Table 59: Latin America Plant-based Milk Market Volume (Metric Tons) and Forecast by Country, 2016–2020
Table 60: Latin America Plant-based Milk Market Volume (Metric Tons) and Forecast by Country, 2021–2031
Table 61: Latin America Plant-based Milk Market Value (US$ Mn) and Forecast by Product Type, 2016–2020
Table 62: Latin America Plant-based Milk Market Value (US$ Mn) and Forecast by Product Type, 2021–2031
Table 63: Latin America Plant-based Milk Market Volume (Metric Tons) and Forecast by Product Type, 2016–2020
Table 64: Latin America Plant-based Milk Market Volume (Metric Tons) and Forecast by Product Type, 2021–2031
Table 65: Latin America Plant-based Milk Market Value (US$ Mn) and Forecast by Form, 2016–2020
Table 66: Latin America Plant-based Milk Market Value (US$ Mn) and Forecast by Form, 2021–2031
Table 67: Latin America Plant-based Milk Market Volume (Metric Tons) and Forecast by Form, 2016–2020
Table 68: Latin America Plant-based Milk Market Volume (Metric Tons) and Forecast by Form, 2021–2031
Table 69: Latin America Plant-based Milk Market Value (US$ Mn) and Forecast by Flavor, 2016–2020
Table 70: Latin America Plant-based Milk Market Value (US$ Mn) and Forecast by Flavor, 2021–2031
Table 71: Latin America Plant-based Milk Market Volume (Metric Tons) and Forecast by Flavor, 2016–2020
Table 72: Latin America Plant-based Milk Market Volume (Metric Tons) and Forecast by Flavor, 2021–2031
Table 73: Latin America Plant-based Milk Market Value (US$ Mn) and Forecast by Nature, 2016–2020
Table 74: Latin America Plant-based Milk Market Value (US$ Mn) and Forecast by Nature, 2021–2031
Table 75: Latin America Plant-based Milk Market Volume (Metric Tons) and Forecast by Nature, 2016–2020
Table 76: Latin America Plant-based Milk Market Volume (Metric Tons) and Forecast by Nature, 2021–2031
Table 77: Latin America Plant-based Milk Market Value (US$ Mn) and Forecast by End Use, 2016–2020
Table 78: Latin America Plant-based Milk Market Value (US$ Mn) and Forecast by End Use, 2021–2031
Table 79: Latin America Plant-based Milk Market Volume (Metric Tons) and Forecast by End Use, 2016–2020
Table 80: Latin America Plant-based Milk Market Volume (Metric Tons) and Forecast by End Use, 2021–2031
Table 81: Latin America Plant-based Milk Market Value (US$ Mn) and Forecast by Sales Channel, 2016–2020
Table 82: Latin America Plant-based Milk Market Value (US$ Mn) and Forecast by Sales Channel, 2021–2031
Table 83: Latin America Plant-based Milk Market Volume (Metric Tons) and Forecast by Sales Channel, 2016–2020
Table 84: Latin America Plant-based Milk Market Volume (Metric Tons) and Forecast by Sales Channel, 2021–2031
Table 85: Europe Plant-based Milk Market Value (US$ Mn) and Forecast by Country, 2016–2020
Table 86: Europe Plant-based Milk Market Value (US$ Mn) and Forecast by Country, 2021–2031
Table 87: Europe Plant-based Milk Market Volume (Metric Tons) and Forecast by Country, 2016–2020
Table 88: Europe Plant-based Milk Market Volume (Metric Tons) and Forecast by Country, 2021–2031
Table 89: Europe Plant-based Milk Market Value (US$ Mn) and Forecast by Product Type, 2016–2020
Table 90: Europe Plant-based Milk Market Value (US$ Mn) and Forecast by Product Type, 2021–2031
Table 91: Europe Plant-based Milk Market Volume (Metric Tons) and Forecast by Product Type, 2016–2020
Table 92: Europe Plant-based Milk Market Volume (Metric Tons) and Forecast by Product Type, 2021–2031
Table 93: Europe Plant-based Milk Market Value (US$ Mn) and Forecast by Form, 2016–2020
Table 94: Europe Plant-based Milk Market Value (US$ Mn) and Forecast by Form, 2021–2031
Table 95: Europe Plant-based Milk Market Volume (Metric Tons) and Forecast by Form, 2016–2020
Table 96: Europe Plant-based Milk Market Volume (Metric Tons) and Forecast by Form, 2021–2031
Table 97: Europe Plant-based Milk Market Value (US$ Mn) and Forecast by Flavor, 2016–2020
Table 98: Europe Plant-based Milk Market Value (US$ Mn) and Forecast by Flavor, 2021–2031
Table 99: Europe Plant-based Milk Market Volume (Metric Tons) and Forecast by Flavor, 2016–2020
Table 100: Europe Plant-based Milk Market Volume (Metric Tons) and Forecast by Flavor, 2021–2031
Table 101: Europe Plant-based Milk Market Value (US$ Mn) and Forecast by Nature, 2016–2020
Table 102: Europe Plant-based Milk Market Value (US$ Mn) and Forecast by Nature, 2021–2031
Table 103: Europe Plant-based Milk Market Volume (Metric Tons) and Forecast by Nature, 2016–2020
Table 104: Europe Plant-based Milk Market Volume (Metric Tons) and Forecast by Nature, 2021–2031
Table 105: Europe Plant-based Milk Market Value (US$ Mn) and Forecast by End Use, 2016–2020
Table 106: Europe Plant-based Milk Market Value (US$ Mn) and Forecast by End Use, 2021–2031
Table 107: Europe Plant-based Milk Market Volume (Metric Tons) and Forecast by End Use, 2016–2020
Table 108: Europe Plant-based Milk Market Volume (Metric Tons) and Forecast by End Use, 2021–2031
Table 109: Europe Plant-based Milk Market Value (US$ Mn) and Forecast by Sales Channel, 2016–2020
Table 110: Europe Plant-based Milk Market Value (US$ Mn) and Forecast by Sales Channel, 2021–2031
Table 111: Europe Plant-based Milk Market Volume (Metric Tons) and Forecast by Sales Channel, 2016–2020
Table 112: Europe Plant-based Milk Market Volume (Metric Tons) and Forecast by Sales Channel, 2021–2031
Table 113: South Asia Plant-based Milk Market Value (US$ Mn) and Forecast by Country, 2016–2020
Table 114: South Asia Plant-based Milk Market Value (US$ Mn) and Forecast by Country, 2021–2031
Table 115: South Asia Plant-based Milk Market Volume (Metric Tons) and Forecast by Country, 2016–2020
Table 116: South Asia Plant-based Milk Market Volume (Metric Tons) and Forecast by Country, 2021–2031
Table 117: South Asia Plant-based Milk Market Value (US$ Mn) and Forecast by Product Type, 2016–2020
Table 118: South Asia Plant-based Milk Market Value (US$ Mn) and Forecast by Product Type, 2021–2031
Table 119: South Asia Plant-based Milk Market Volume (Metric Tons) and Forecast by Product Type, 2016–2020
Table 120: South Asia Plant-based Milk Market Volume (Metric Tons) and Forecast by Product Type, 2021–2031
Table 121: South Asia Plant-based Milk Market Value (US$ Mn) and Forecast by Form, 2016–2020
Table 122: South Asia Plant-based Milk Market Value (US$ Mn) and Forecast by Form, 2021–2031
Table 123: South Asia Plant-based Milk Market Volume (Metric Tons) and Forecast by Form, 2016–2020
Table 124: South Asia Plant-based Milk Market Volume (Metric Tons) and Forecast by Form, 2021–2031
Table 125: South Asia Plant-based Milk Market Value (US$ Mn) and Forecast by Flavor, 2016–2020
Table 126: South Asia Plant-based Milk Market Value (US$ Mn) and Forecast by Flavor, 2021–2031
Table 127: South Asia Plant-based Milk Market Volume (Metric Tons) and Forecast by Flavor, 2016–2020
Table 128: South Asia Plant-based Milk Market Volume (Metric Tons) and Forecast by Flavor, 2021–2031
Table 129: South Asia Plant-based Milk Market Value (US$ Mn) and Forecast by Nature, 2016–2020
Table 130: South Asia Plant-based Milk Market Value (US$ Mn) and Forecast by Nature, 2021–2031
Table 131: South Asia Plant-based Milk Market Volume (Metric Tons) and Forecast by Nature, 2016–2020
Table 132: South Asia Plant-based Milk Market Volume (Metric Tons) and Forecast by Nature, 2021–2031
Table 133: South Asia Plant-based Milk Market Value (US$ Mn) and Forecast by End Use, 2016–2020
Table 134: South Asia Plant-based Milk Market Value (US$ Mn) and Forecast by End Use, 2021–2031
Table 135: South Asia Plant-based Milk Market Volume (Metric Tons) and Forecast by End Use, 2016–2020
Table 136: South Asia Plant-based Milk Market Volume (Metric Tons) and Forecast by End Use, 2021–2031
Table 137: South Asia Plant-based Milk Market Value (US$ Mn) and Forecast by Sales Channel, 2016–2020
Table 138: South Asia Plant-based Milk Market Value (US$ Mn) and Forecast by Sales Channel, 2021–2031
Table 139: South Asia Plant-based Milk Market Volume (Metric Tons) and Forecast by Sales Channel, 2016–2020
Table 140: South Asia Plant-based Milk Market Volume (Metric Tons) and Forecast by Sales Channel, 2021–2031
Table 141: East Asia Plant-based Milk Market Value (US$ Mn) and Forecast by Country, 2016–2020
Table 142: East Asia Plant-based Milk Market Value (US$ Mn) and Forecast by Country, 2021–2031
Table 143: East Asia Plant-based Milk Market Volume (Metric Tons) and Forecast by Country, 2016–2020
Table 144: East Asia Plant-based Milk Market Volume (Metric Tons) and Forecast by Country, 2021–2031
Table 145: East Asia Plant-based Milk Market Value (US$ Mn) and Forecast by Product Type, 2016–2020
Table 146: East Asia Plant-based Milk Market Value (US$ Mn) and Forecast by Product Type, 2021–2031
Table 147: East Asia Plant-based Milk Market Volume (Metric Tons) and Forecast by Product Type, 2016–2020
Table 148: East Asia Plant-based Milk Market Volume (Metric Tons) and Forecast by Product Type, 2021–2031
Table 149: East Asia Plant-based Milk Market Value (US$ Mn) and Forecast by Form, 2016–2020
Table 150: East Asia Plant-based Milk Market Value (US$ Mn) and Forecast by Form, 2021–2031
Table 151: East Asia Plant-based Milk Market Volume (Metric Tons) and Forecast by Form, 2016–2020
Table 152: East Asia Plant-based Milk Market Volume (Metric Tons) and Forecast by Form, 2021–2031
Table 153: East Asia Plant-based Milk Market Value (US$ Mn) and Forecast by Flavor, 2016–2020
Table 154: East Asia Plant-based Milk Market Value (US$ Mn) and Forecast by Flavor, 2021–2031
Table 155: East Asia Plant-based Milk Market Volume (Metric Tons) and Forecast by Flavor, 2016–2020
Table 156: East Asia Plant-based Milk Market Volume (Metric Tons) and Forecast by Flavor, 2021–2031
Table 157: East Asia Plant-based Milk Market Value (US$ Mn) and Forecast by Nature, 2016–2020
Table 158: East Asia Plant-based Milk Market Value (US$ Mn) and Forecast by Nature, 2021–2031
Table 159: East Asia Plant-based Milk Market Volume (Metric Tons) and Forecast by Nature, 2016–2020
Table 160: East Asia Plant-based Milk Market Volume (Metric Tons) and Forecast by Nature, 2021–2031
Table 161: East Asia Plant-based Milk Market Value (US$ Mn) and Forecast by End Use, 2016–2020
Table 162: East Asia Plant-based Milk Market Value (US$ Mn) and Forecast by End Use, 2021–2031
Table 163: East Asia Plant-based Milk Market Volume (Metric Tons) and Forecast by End Use, 2016–2020
Table 164: East Asia Plant-based Milk Market Volume (Metric Tons) and Forecast by End Use, 2021–2031
Table 165: East Asia Plant-based Milk Market Value (US$ Mn) and Forecast by Sales Channel, 2016–2020
Table 166: East Asia Plant-based Milk Market Value (US$ Mn) and Forecast by Sales Channel, 2021–2031
Table 167: East Asia Plant-based Milk Market Volume (Metric Tons) and Forecast by Sales Channel, 2016–2020
Table 168: East Asia Plant-based Milk Market Volume (Metric Tons) and Forecast by Sales Channel, 2021–2031
Table 169: Oceania Plant-based Milk Market Value (US$ Mn) and Forecast by Country, 2016–2020
Table 170: Oceania Plant-based Milk Market Value (US$ Mn) and Forecast by Country, 2021–2031
Table 171: Oceania Plant-based Milk Market Volume (Metric Tons) and Forecast by Country, 2016–2020
Table 172: Oceania Plant-based Milk Market Volume (Metric Tons) and Forecast by Country, 2021–2031
Table 173: Oceania Plant-based Milk Market Value (US$ Mn) and Forecast by Product Type, 2016–2020
Table 174: Oceania Plant-based Milk Market Value (US$ Mn) and Forecast by Product Type, 2021–2031
Table 175: Oceania Plant-based Milk Market Volume (Metric Tons) and Forecast by Product Type, 2016–2020
Table 176: Oceania Plant-based Milk Market Volume (Metric Tons) and Forecast by Product Type, 2021–2031
Table 177: Oceania Plant-based Milk Market Value (US$ Mn) and Forecast by Form, 2016–2020
Table 178: Oceania Plant-based Milk Market Value (US$ Mn) and Forecast by Form, 2021–2031
Table 179: Oceania Plant-based Milk Market Volume (Metric Tons) and Forecast by Form, 2016–2020
Table 180: Oceania Plant-based Milk Market Volume (Metric Tons) and Forecast by Form, 2021–2031
Table 181: Oceania Plant-based Milk Market Value (US$ Mn) and Forecast by Flavor, 2016–2020
Table 182: Oceania Plant-based Milk Market Value (US$ Mn) and Forecast by Flavor, 2021–2031
Table 183: Oceania Plant-based Milk Market Volume (Metric Tons) and Forecast by Flavor, 2016–2020
Table 184: Oceania Plant-based Milk Market Volume (Metric Tons) and Forecast by Flavor, 2021–2031
Table 185: Oceania Plant-based Milk Market Value (US$ Mn) and Forecast by Nature, 2016–2020
Table 186: Oceania Plant-based Milk Market Value (US$ Mn) and Forecast by Nature, 2021–2031
Table 187: Oceania Plant-based Milk Market Volume (Metric Tons) and Forecast by Nature, 2016–2020
Table 188: Oceania Plant-based Milk Market Volume (Metric Tons) and Forecast by Nature, 2021–2031
Table 189: Oceania Plant-based Milk Market Value (US$ Mn) and Forecast by End Use, 2016–2020
Table 190: Oceania Plant-based Milk Market Value (US$ Mn) and Forecast by End Use, 2021–2031
Table 191: Oceania Plant-based Milk Market Volume (Metric Tons) and Forecast by End Use, 2016–2020
Table 192: Oceania Plant-based Milk Market Volume (Metric Tons) and Forecast by End Use, 2021–2031
Table 193: Oceania Plant-based Milk Market Value (US$ Mn) and Forecast by Sales Channel, 2016–2020
Table 194: Oceania Plant-based Milk Market Value (US$ Mn) and Forecast by Sales Channel, 2021–2031
Table 195: Oceania Plant-based Milk Market Volume (Metric Tons) and Forecast by Sales Channel, 2016–2020
Table 196: Oceania Plant-based Milk Market Volume (Metric Tons) and Forecast by Sales Channel, 2021–2031
Table 197: MEA Plant-based Milk Market Value (US$ Mn) and Forecast by Country, 2016–2020
Table 198: MEA Plant-based Milk Market Value (US$ Mn) and Forecast by Country, 2021–2031
Table 199: MEA Plant-based Milk Market Volume (Metric Tons) and Forecast by Country, 2016–2020
Table 200: MEA Plant-based Milk Market Volume (Metric Tons) and Forecast by Country, 2021–2031
Table 201: MEA Plant-based Milk Market Value (US$ Mn) and Forecast by Product Type, 2016–2020
Table 202: MEA Plant-based Milk Market Value (US$ Mn) and Forecast by Product Type, 2021–2031
Table 203: MEA Plant-based Milk Market Volume (Metric Tons) and Forecast by Product Type, 2016–2020
Table 204: MEA Plant-based Milk Market Volume (Metric Tons) and Forecast by Product Type, 2021–2031
Table 205: MEA Plant-based Milk Market Value (US$ Mn) and Forecast by Form, 2016–2020
Table 206: MEA Plant-based Milk Market Value (US$ Mn) and Forecast by Form, 2021–2031
Table 207: MEA Plant-based Milk Market Volume (Metric Tons) and Forecast by Form, 2016–2020
Table 208: MEA Plant-based Milk Market Volume (Metric Tons) and Forecast by Form, 2021–2031
Table 209: MEA Plant-based Milk Market Value (US$ Mn) and Forecast by Flavor, 2016–2020
Table 210: MEA Plant-based Milk Market Value (US$ Mn) and Forecast by Flavor, 2021–2031
Table 211: MEA Plant-based Milk Market Volume (Metric Tons) and Forecast by Flavor, 2016–2020
Table 212: MEA Plant-based Milk Market Volume (Metric Tons) and Forecast by Flavor, 2021–2031
Table 213: MEA Plant-based Milk Market Value (US$ Mn) and Forecast by Nature, 2016–2020
Table 214: MEA Plant-based Milk Market Value (US$ Mn) and Forecast by Nature, 2021–2031
Table 215: MEA Plant-based Milk Market Volume (Metric Tons) and Forecast by Nature, 2016–2020
Table 216: MEA Plant-based Milk Market Volume (Metric Tons) and Forecast by Nature, 2021–2031
Table 217: MEA Plant-based Milk Market Value (US$ Mn) and Forecast by End Use, 2016–2020
Table 218: MEA Plant-based Milk Market Value (US$ Mn) and Forecast by End Use, 2021–2031
Table 219: MEA Plant-based Milk Market Volume (Metric Tons) and Forecast by End Use, 2016–2020
Table 220: MEA Plant-based Milk Market Volume (Metric Tons) and Forecast by End Use, 2021–2031
Table 221: MEA Plant-based Milk Market Value (US$ Mn) and Forecast by Sales Channel, 2016–2020
Table 222: MEA Plant-based Milk Market Value (US$ Mn) and Forecast by Sales Channel, 2021–2031
Table 223: MEA Plant-based Milk Market Volume (Metric Tons) and Forecast by Sales Channel, 2016–2020
Table 224: MEA Plant-based Milk Market Volume (Metric Tons) and Forecast by Sales Channel, 2021–2031
Find your sweet spots for generating winning opportunities in this market.
Talk to AnalystFigure 1: Global Plant-based Milk Market Value (US$ Mn) and Volume (MT) Forecast, 2021-2031
Figure 2: Global Plant-based Milk Market Absolute $ Opportunity (US$ Mn), 2021-2031
Figure 3: Global Plant-based Milk Market Value (US$ Mn) and % Growth by Region,2021 & 2031
Figure 4: Global Plant-based Milk Market Y-o-Y Growth Rate by Region, 2021-2031
Figure 5: Global Plant-based Milk Market Value (US$ Mn) and % Growth by Product Type,2021 & 2031
Figure 6: Global Plant-based Milk Market Y-o-Y Growth Rate by Product Type, 2021-2031
Figure 7: Global Plant-based Milk Market Value (US$ Mn) and % Growth by Nature,2021 & 2031
Figure 8: Global Plant-based Milk Market Y-o-Y Growth Rate by Nature, 2021-2031
Figure 9: Global Plant-based Milk Market Value (US$ Mn) and % Growth by Flavor,2021 & 2031
Figure 10: Global Plant-based Milk Market Y-o-Y Growth Rate by Flavor, 2021-2031
Figure 11: Global Plant-based Milk Market Value (US$ Mn) and % Growth by Form,2021 & 2031
Figure 12: Global Plant-based Milk Market Y-o-Y Growth Rate by Form, 2021-2031
Figure 13: Global Plant-based Milk Market Value (US$ Mn) and % Growth by End Use,2021 & 2031
Figure 14: Global Plant-based Milk Market Y-o-Y Growth Rate by End Use, 2021-2031
Figure 15: Global Plant-based Milk Market Value (US$ Mn) and % Growth by Sales Channel,2021 & 2031
Figure 16: Global Plant-based Milk Market Y-o-Y Growth Rate by Sales Channel, 2021-2031
Figure 17: Global Plant-based Milk Market Attractiveness Analysis by Region, 2021-2031
Figure 18: Global Plant-based Milk Market Attractiveness Analysis by Product Type, 2021-2031
Figure 19: Global Plant-based Milk Market Attractiveness Analysis by Nature, 2021-2031
Figure 20: Global Plant-based Milk Market Attractiveness Analysis by Flavor, 2021-2031
Figure 21: Global Plant-based Milk Market Attractiveness Analysis by Form, 2021-2031
Figure 22: Global Plant-based Milk Market Attractiveness Analysis by End Use, 2021-2031
Figure 23: Global Plant-based Milk Market Attractiveness Analysis by Sales Channel, 2021-2031
Figure 24: North America Plant-based Milk Market Value (US$ Mn) and Volume (MT) Forecast, 2021-2031
Figure 25: North America Plant-based Milk Market Absolute $ Opportunity (US$ Mn), 2021-2031
Figure 26: North America Plant-based Milk Market Value (US$ Mn) and % Growth by Country,2021 & 2031
Figure 27: North America Plant-based Milk Market Y-o-Y Growth Rate by Country, 2021-2031
Figure 28: North America Plant-based Milk Market Value (US$ Mn) and % Growth by Product Type,2021 & 2031
Figure 29: North America Plant-based Milk Market Y-o-Y Growth Rate by Product Type, 2021-2031
Figure 30: North America Plant-based Milk Market Value (US$ Mn) and % Growth by Nature,2021 & 2031
Figure 31: North America Plant-based Milk Market Y-o-Y Growth Rate by Nature, 2021-2031
Figure 32: North America Plant-based Milk Market Value (US$ Mn) and % Growth by Flavor,2021 & 2031
Figure 33: North America Plant-based Milk Market Y-o-Y Growth Rate by Flavor, 2021-2031
Figure 34: North America Plant-based Milk Market Value (US$ Mn) and % Growth by Form,2021 & 2031
Figure 35: North America Plant-based Milk Market Y-o-Y Growth Rate by Form, 2021-2031
Figure 36: North America Plant-based Milk Market Value (US$ Mn) and % Growth by End Use,2021 & 2031
Figure 37: North America Plant-based Milk Market Y-o-Y Growth Rate by End Use, 2021-2031
Figure 38: North America Plant-based Milk Market Value (US$ Mn) and % Growth by Sales Channel,2021 & 2031
Figure 39: North America Plant-based Milk Market Y-o-Y Growth Rate by Sales Channel, 2021-2031
Figure 40: North America Plant-based Milk Market Attractiveness Analysis by Country, 2021-2031
Figure 41: North America Plant-based Milk Market Attractiveness Analysis by Product Type, 2021-2031
Figure 42: North America Plant-based Milk Market Attractiveness Analysis by Nature, 2021-2031
Figure 43: North America Plant-based Milk Market Attractiveness Analysis by Flavor, 2021-2031
Figure 44: North America Plant-based Milk Market Attractiveness Analysis by Form, 2021-2031
Figure 45: North America Plant-based Milk Market Attractiveness Analysis by End Use, 2021-2031
Figure 46: North America Plant-based Milk Market Attractiveness Analysis by Sales Channel, 2021-2031
Figure 47: Latin America Plant-based Milk Market Value (US$ Mn) and Volume (MT) Forecast, 2021-2031
Figure 48: Latin America Plant-based Milk Market Absolute $ Opportunity (US$ Mn), 2021-2031
Figure 49: Latin America Plant-based Milk Market Value (US$ Mn) and % Growth by Country,2021 & 2031
Figure 50: Latin America Plant-based Milk Market Y-o-Y Growth Rate by Country, 2021-2031
Figure 51: Latin America Plant-based Milk Market Value (US$ Mn) and % Growth by Product Type,2021 & 2031
Figure 52: Latin America Plant-based Milk Market Y-o-Y Growth Rate by Product Type, 2021-2031
Figure 53: Latin America Plant-based Milk Market Value (US$ Mn) and % Growth by Nature,2021 & 2031
Figure 54: Latin America Plant-based Milk Market Y-o-Y Growth Rate by Nature, 2021-2031
Figure 55: Latin America Plant-based Milk Market Value (US$ Mn) and % Growth by Flavor,2021 & 2031
Figure 56: Latin America Plant-based Milk Market Y-o-Y Growth Rate by Flavor, 2021-2031
Figure 57: Latin America Plant-based Milk Market Value (US$ Mn) and % Growth by Form,2021 & 2031
Figure 58: Latin America Plant-based Milk Market Y-o-Y Growth Rate by Form, 2021-2031
Figure 59: Latin America Plant-based Milk Market Value (US$ Mn) and % Growth by End Use,2021 & 2031
Figure 60: Latin America Plant-based Milk Market Y-o-Y Growth Rate by End Use, 2021-2031
Figure 61: Latin America Plant-based Milk Market Value (US$ Mn) and % Growth by Sales Channel,2021 & 2031
Figure 62: Latin America Plant-based Milk Market Y-o-Y Growth Rate by Sales Channel, 2021-2031
Figure 63: Latin America Plant-based Milk Market Attractiveness Analysis by Country, 2021-2031
Figure 64: Latin America Plant-based Milk Market Attractiveness Analysis by Product Type, 2021-2031
Figure 65: Latin America Plant-based Milk Market Attractiveness Analysis by Nature, 2021-2031
Figure 66: Latin America Plant-based Milk Market Attractiveness Analysis by Flavor, 2021-2031
Figure 67: Latin America Plant-based Milk Market Attractiveness Analysis by Form, 2021-2031
Figure 68: Latin America Plant-based Milk Market Attractiveness Analysis by End Use, 2021-2031
Figure 69: Latin America Plant-based Milk Market Attractiveness Analysis by Sales Channel, 2021-2031
Figure 70: Europe Plant-based Milk Market Value (US$ Mn) and Volume (MT) Forecast, 2021-2031
Figure 71: Europe Plant-based Milk Market Absolute $ Opportunity (US$ Mn), 2021-2031
Figure 72: Europe Plant-based Milk Market Value (US$ Mn) and % Growth by Country,2021 & 2031
Figure 73: Europe Plant-based Milk Market Y-o-Y Growth Rate by Country, 2021-2031
Figure 74: Europe Plant-based Milk Market Value (US$ Mn) and % Growth by Product Type,2021 & 2031
Figure 75: Europe Plant-based Milk Market Y-o-Y Growth Rate by Product Type, 2021-2031
Figure 76: Europe Plant-based Milk Market Value (US$ Mn) and % Growth by Nature,2021 & 2031
Figure 77: Europe Plant-based Milk Market Y-o-Y Growth Rate by Nature, 2021-2031
Figure 78: Europe Plant-based Milk Market Value (US$ Mn) and % Growth by Flavor,2021 & 2031
Figure 79: Europe Plant-based Milk Market Y-o-Y Growth Rate by Flavor, 2021-2031
Figure 80: Europe Plant-based Milk Market Value (US$ Mn) and % Growth by Form,2021 & 2031
Figure 81: Europe Plant-based Milk Market Y-o-Y Growth Rate by Form, 2021-2031
Figure 82: Europe Plant-based Milk Market Value (US$ Mn) and % Growth by End Use,2021 & 2031
Figure 83: Europe Plant-based Milk Market Y-o-Y Growth Rate by End Use, 2021-2031
Figure 84: Europe Plant-based Milk Market Value (US$ Mn) and % Growth by Sales Channel,2021 & 2031
Figure 85: Europe Plant-based Milk Market Y-o-Y Growth Rate by Sales Channel, 2021-2031
Figure 86: Europe Plant-based Milk Market Attractiveness Analysis by Country, 2021-2031
Figure 87: Europe Plant-based Milk Market Attractiveness Analysis by Product Type, 2021-2031
Figure 88: Europe Plant-based Milk Market Attractiveness Analysis by Nature, 2021-2031
Figure 89: Europe Plant-based Milk Market Attractiveness Analysis by Flavor, 2021-2031
Figure 90: Europe Plant-based Milk Market Attractiveness Analysis by Form, 2021-2031
Figure 91: Europe Plant-based Milk Market Attractiveness Analysis by End Use, 2021-2031
Figure 92: Europe Plant-based Milk Market Attractiveness Analysis by Sales Channel, 2021-2031
Figure 93: South Asia Plant-based Milk Market Value (US$ Mn) and Volume (MT) Forecast, 2021-2031
Figure 94: South Asia Plant-based Milk Market Absolute $ Opportunity (US$ Mn), 2021-2031
Figure 95: South Asia Plant-based Milk Market Value (US$ Mn) and % Growth by Country,2021 & 2031
Figure 96: South Asia Plant-based Milk Market Y-o-Y Growth Rate by Country, 2021-2031
Figure 97: South Asia Plant-based Milk Market Value (US$ Mn) and % Growth by Product Type,2021 & 2031
Figure 98: South Asia Plant-based Milk Market Y-o-Y Growth Rate by Product Type, 2021-2031
Figure 99: South Asia Plant-based Milk Market Value (US$ Mn) and % Growth by Nature,2021 & 2031
Figure 100: South Asia Plant-based Milk Market Y-o-Y Growth Rate by Nature, 2021-2031
Figure 101: South Asia Plant-based Milk Market Value (US$ Mn) and % Growth by Flavor,2021 & 2031
Figure 102: South Asia Plant-based Milk Market Y-o-Y Growth Rate by Flavor, 2021-2031
Figure 103: South Asia Plant-based Milk Market Value (US$ Mn) and % Growth by Form,2021 & 2031
Figure 104: South Asia Plant-based Milk Market Y-o-Y Growth Rate by Form, 2021-2031
Figure 105: South Asia Plant-based Milk Market Value (US$ Mn) and % Growth by End Use,2021 & 2031
Figure 106: South Asia Plant-based Milk Market Y-o-Y Growth Rate by End Use, 2021-2031
Figure 107: South Asia Plant-based Milk Market Value (US$ Mn) and % Growth by Sales Channel,2021 & 2031
Figure 108: South Asia Plant-based Milk Market Y-o-Y Growth Rate by Sales Channel, 2021-2031
Figure 109: South Asia Plant-based Milk Market Attractiveness Analysis by Country, 2021-2031
Figure 110: South Asia Plant-based Milk Market Attractiveness Analysis by Product Type, 2021-2031
Figure 111: South Asia Plant-based Milk Market Attractiveness Analysis by Nature, 2021-2031
Figure 112: South Asia Plant-based Milk Market Attractiveness Analysis by Flavor, 2021-2031
Figure 113: South Asia Plant-based Milk Market Attractiveness Analysis by Form, 2021-2031
Figure 114: South Asia Plant-based Milk Market Attractiveness Analysis by End Use, 2021-2031
Figure 115: South Asia Plant-based Milk Market Attractiveness Analysis by Sales Channel, 2021-2031
Figure 116: East Asia Plant-based Milk Market Value (US$ Mn) and Volume (MT) Forecast, 2021-2031
Figure 117: East Asia Plant-based Milk Market Absolute $ Opportunity (US$ Mn), 2021-2031
Figure 118: East Asia Plant-based Milk Market Value (US$ Mn) and % Growth by Country,2021 & 2031
Figure 119: East Asia Plant-based Milk Market Y-o-Y Growth Rate by Country, 2021-2031
Figure 120: East Asia Plant-based Milk Market Value (US$ Mn) and % Growth by Product Type,2021 & 2031
Figure 121: East Asia Plant-based Milk Market Y-o-Y Growth Rate by Product Type, 2021-2031
Figure 122: East Asia Plant-based Milk Market Value (US$ Mn) and % Growth by Nature,2021 & 2031
Figure 123: East Asia Plant-based Milk Market Y-o-Y Growth Rate by Nature, 2021-2031
Figure 124: East Asia Plant-based Milk Market Value (US$ Mn) and % Growth by Flavor,2021 & 2031
Figure 125: East Asia Plant-based Milk Market Y-o-Y Growth Rate by Flavor, 2021-2031
Figure 126: East Asia Plant-based Milk Market Value (US$ Mn) and % Growth by Form,2021 & 2031
Figure 127: East Asia Plant-based Milk Market Y-o-Y Growth Rate by Form, 2021-2031
Figure 128: East Asia Plant-based Milk Market Value (US$ Mn) and % Growth by End Use,2021 & 2031
Figure 129: East Asia Plant-based Milk Market Y-o-Y Growth Rate by End Use, 2021-2031
Figure 130: East Asia Plant-based Milk Market Value (US$ Mn) and % Growth by Sales Channel,2021 & 2031
Figure 131: East Asia Plant-based Milk Market Y-o-Y Growth Rate by Sales Channel, 2021-2031
Figure 132: East Asia Plant-based Milk Market Attractiveness Analysis by Country, 2021-2031
Figure 133: East Asia Plant-based Milk Market Attractiveness Analysis by Product Type, 2021-2031
Figure 134: East Asia Plant-based Milk Market Attractiveness Analysis by Nature, 2021-2031
Figure 135: East Asia Plant-based Milk Market Attractiveness Analysis by Flavor, 2021-2031
Figure 136: East Asia Plant-based Milk Market Attractiveness Analysis by Form, 2021-2031
Figure 137: East Asia Plant-based Milk Market Attractiveness Analysis by End Use, 2021-2031
Figure 138: East Asia Plant-based Milk Market Attractiveness Analysis by Sales Channel, 2021-2031
Figure 139: Oceania Plant-based Milk Market Value (US$ Mn) and Volume (MT) Forecast, 2021-2031
Figure 140: Oceania Plant-based Milk Market Absolute $ Opportunity (US$ Mn), 2021-2031
Figure 141: Oceania Plant-based Milk Market Value (US$ Mn) and % Growth by Country,2021 & 2031
Figure 142: Oceania Plant-based Milk Market Y-o-Y Growth Rate by Country, 2021-2031
Figure 143: Oceania Plant-based Milk Market Value (US$ Mn) and % Growth by Product Type,2021 & 2031
Figure 144: Oceania Plant-based Milk Market Y-o-Y Growth Rate by Product Type, 2021-2031
Figure 145: Oceania Plant-based Milk Market Value (US$ Mn) and % Growth by Nature,2021 & 2031
Figure 146: Oceania Plant-based Milk Market Y-o-Y Growth Rate by Nature, 2021-2031
Figure 147: Oceania Plant-based Milk Market Value (US$ Mn) and % Growth by Flavor,2021 & 2031
Figure 148: Oceania Plant-based Milk Market Y-o-Y Growth Rate by Flavor, 2021-2031
Figure 149: Oceania Plant-based Milk Market Value (US$ Mn) and % Growth by Form,2021 & 2031
Figure 150: Oceania Plant-based Milk Market Y-o-Y Growth Rate by Form, 2021-2031
Figure 151: Oceania Plant-based Milk Market Value (US$ Mn) and % Growth by End Use,2021 & 2031
Figure 152: Oceania Plant-based Milk Market Y-o-Y Growth Rate by End Use, 2021-2031
Figure 153: Oceania Plant-based Milk Market Value (US$ Mn) and % Growth by Sales Channel,2021 & 2031
Figure 154: Oceania Plant-based Milk Market Y-o-Y Growth Rate by Sales Channel, 2021-2031
Figure 155: Oceania Plant-based Milk Market Attractiveness Analysis by Country, 2021-2031
Figure 156: Oceania Plant-based Milk Market Attractiveness Analysis by Product Type, 2021-2031
Figure 157: Oceania Plant-based Milk Market Attractiveness Analysis by Nature, 2021-2031
Figure 158: Oceania Plant-based Milk Market Attractiveness Analysis by Flavor, 2021-2031
Figure 159: Oceania Plant-based Milk Market Attractiveness Analysis by Form, 2021-2031
Figure 160: Oceania Plant-based Milk Market Attractiveness Analysis by End Use, 2021-2031
Figure 161: Oceania Plant-based Milk Market Attractiveness Analysis by Sales Channel, 2021-2031
Figure 162: MEA Plant-based Milk Market Value (US$ Mn) and Volume (MT) Forecast, 2021-2031
Figure 163: MEA Plant-based Milk Market Absolute $ Opportunity (US$ Mn), 2021-2031
Figure 164: MEA Plant-based Milk Market Value (US$ Mn) and % Growth by Country,2021 & 2031
Figure 165: MEA Plant-based Milk Market Y-o-Y Growth Rate by Country, 2021-2031
Figure 166: MEA Plant-based Milk Market Value (US$ Mn) and % Growth by Product Type,2021 & 2031
Figure 167: MEA Plant-based Milk Market Y-o-Y Growth Rate by Product Type, 2021-2031
Figure 168: MEA Plant-based Milk Market Value (US$ Mn) and % Growth by Nature,2021 & 2031
Figure 169: MEA Plant-based Milk Market Y-o-Y Growth Rate by Nature, 2021-2031
Figure 170: MEA Plant-based Milk Market Value (US$ Mn) and % Growth by Flavor,2021 & 2031
Figure 171: MEA Plant-based Milk Market Y-o-Y Growth Rate by Flavor, 2021-2031
Figure 172: MEA Plant-based Milk Market Value (US$ Mn) and % Growth by Form,2021 & 2031
Figure 173: MEA Plant-based Milk Market Y-o-Y Growth Rate by Form, 2021-2031
Figure 174: MEA Plant-based Milk Market Value (US$ Mn) and % Growth by End Use,2021 & 2031
Figure 175: MEA Plant-based Milk Market Y-o-Y Growth Rate by End Use, 2021-2031
Figure 176: MEA Plant-based Milk Market Value (US$ Mn) and % Growth by Sales Channel,2021 & 2031
Figure 177: MEA Plant-based Milk Market Y-o-Y Growth Rate by Sales Channel, 2021-2031
Figure 178: MEA Plant-based Milk Market Attractiveness Analysis by Country, 2021-2031
Figure 179: MEA Plant-based Milk Market Attractiveness Analysis by Product Type, 2021-2031
Figure 180: MEA Plant-based Milk Market Attractiveness Analysis by Nature, 2021-2031
Figure 181: MEA Plant-based Milk Market Attractiveness Analysis by Flavor, 2021-2031
Figure 182: MEA Plant-based Milk Market Attractiveness Analysis by Form, 2021-2031
Figure 183: MEA Plant-based Milk Market Attractiveness Analysis by End Use, 2021-2031
Figure 184: MEA Plant-based Milk Market Attractiveness Analysis by Sales Channel, 2021-2031
Need specific information?
Request CustomizationExplore Food and Beverage Insights
View Reports