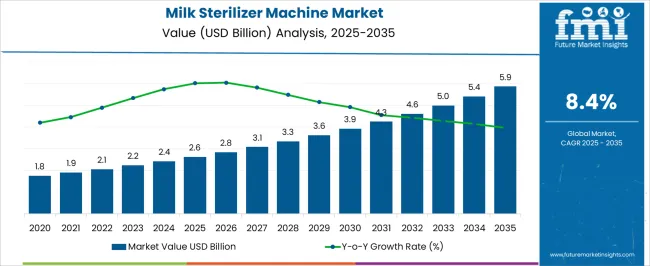
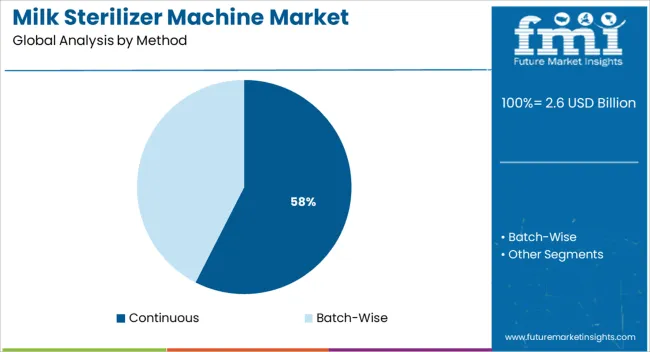
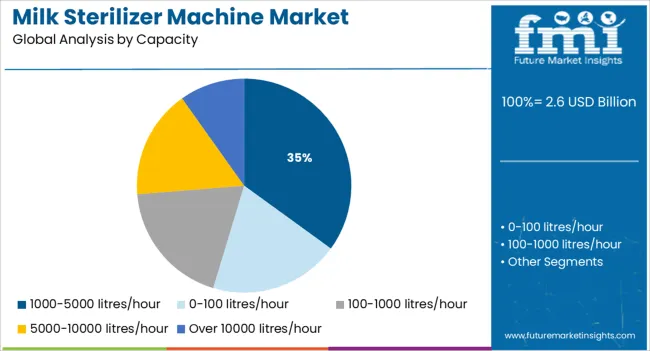
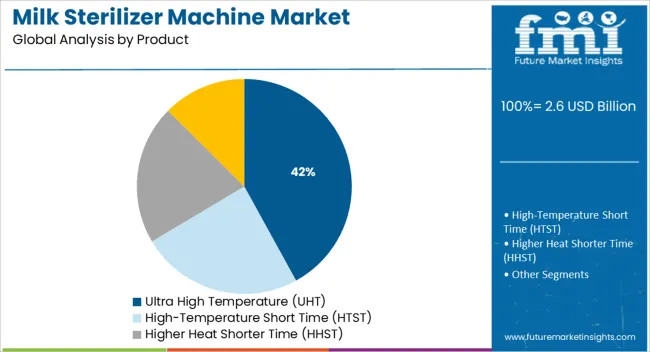
The global Milk Sterilizer Machine Market size is expected to reach a valuation of USD 2231 Million in 2023. Furthermore, with rising production and consumption of milk across the world, the overall demand for milk sterilizer machines is poised to increase at 8.4% CAGR between 2023 and 2033, surpassing a valuation of USD 4998 Million by 2033.
Milk sterilizer machines are equipment used to kill or deactivate harmful pathogens from raw milk to make it safe for consumption as well as to extend its shelf life. They are being increasingly used across manufacturing and processing plants to remove pathogenic organisms such as Coxiella burnetiid, staphylococcus, salmonella, mycobacterium bovis, listeria, yersinia, campylobacter, Escherichia coli, campylobacter, and others from liquid-based foods and beverages.
Rising incidence of foodborne diseases across the world along with growing demand for sterilized milk will therefore continue to boost the growth of the global milk sterilizer machine market during the forecast period.
Similarly, rising production and consumption of dairy-based products are expected to bolster the demand for milk sterilizer machines over the next ten years.
Regionally, with around 38% market share North America will continue to remain at the epicenter of the milk sterilizer machine market during the assessment period. The rising need for high-quality dairy products, high adoption of advanced technologies, and increasing government support are driving the North American milk sterilizer machine market.
Attribute | Key Statistics |
---|---|
Milk Sterilizer Machine Market Value (2023) | USD 2231 Million |
Projected Market Value (2033) | USD 4998 Million |
Value-based CAGR (2023 to 2033) | 8.4% |
Market Share of North America | 38% |
The global sales of milk sterilizer machines are projected to rise at 8.4% CAGR between 2023 and 2033, in comparison to the 6.2% CAGR registered during the historical period of 2017 to 2022.
Increasing the adoption of milk sterilizer machines for eliminating pathogens from raw milk to extend its shelf life is a key factor driving the global milk sterilizer machine market.
Similarly, the growing usage of sterilized milk across various industries such as bakeries, dietary supplements, and confectionery is expected to push the demand for milk sterilizer machines during the forecast period.
In addition to this, advancements in sterilization equipment and growing awareness about the benefits of consuming sterilized milk will create growth prospects within the global milk sterilizer machine market over the next ten years.
Rising Consumer Demand for Safe and Healthy Food Products to Boost Milk Sterilizer Machine Market
With the rising prevalence of foodborne disease across the world, demand for safe and healthy food products has skyrocketed during the last few years and the trend is likely to continue during the forecast period.
People are rapidly shifting their preference toward high-quality products that are free from pathogens. This is encouraging manufacturing companies to use advanced machinery like sterilization equipment which will eventually boost the global milk sterilizer machine market during the projected period.
Similarly, the introduction of various government initiatives aiming towards encouraging the consumption of safe and high-quality products will bode well for the market.
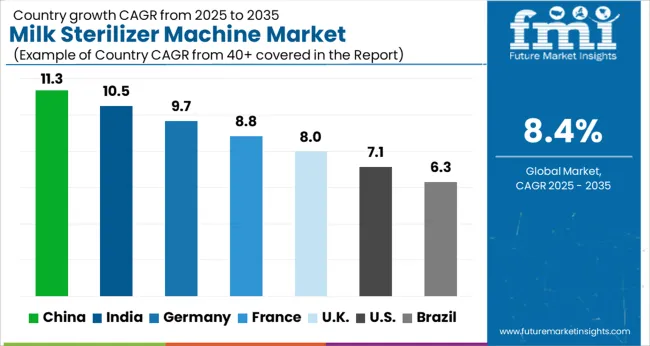
Rising Demand for Milk Products Driving Milk Sterilizer Machine Market in the USA
According to Future Market Insights, the USA milk sterilizer machine market is anticipated to reach a valuation of USD 793.8 Million in 2023 and it is poised to grow at a healthy pace during the next ten years.
Growth in the USA milk sterilizer machine market is driven by increased demand for milk products, high adoption of advanced technologies, and favorable government support.
Similarly, the rapid growth of industries like dietary supplements, bakeries, and confectionery is expected to push the demand for milk sterilizer machines in the USA during the forecast period.
Availability of Advanced Sterilization Equipment Pushing Demand in Germany
The milk sterilizer machine market size in Germany is expected to reach around USD 157 Million in 2023 owing to the increasing popularity of dairy products and the availability of advanced sterilization equipment.
In Europe, there are around 6000,000 dairy farms and over 12,000 processing plants. Most of these farms and processing plants are concentrated in countries like Germany and the UK Rising number of these dairy farms and processing plants will continue to propel the demand for milk sterilizer machines across Germany during the forecast period.
Cheese, ice cream products, and chocolate have long been a staple of the European diet, and the chocolate and cheese businesses are responding to this demand by increasing their production capacities. This is positively impacting the milk sterilizer machine market in the country.
Rising Need for Improving Shelf Life of Milk and Milk-based Products Propelling Sales in India
As per FMI, the milk sterilizer machine market in India is likely to surpass a valuation of USD 130 Million in 2023. Furthermore, due to manufacturers' increased concern about extending product shelf life through sterilization, the milk sterilizer machine market in India is predicted to grow at a robust pace during the projected period.
Similarly, increasing milk production, consumption, and processing along with the rapid expansion of milk-related sectors such as dietary supplements, cheese, chocolate, and other sweet confectionery is expected to generate demand for equipment like milk sterilizer machines across India.
Growing Focus Towards Reducing Human Intervention and Labor Costs Fuelling Demand for Fully Automatic Milk Sterilizer Machines
Based on automation grade, the global milk sterilizer machine market is segmented into semi-automatic and fully automatic. Among these, sales of fully automatic milk sterilizer machines are likely to outpace those of semi-automatic ones.
This can be attributed to the rising end-user preference for automatic machines to reduce human intervention, improve product safety and quality, and reduce labor costs. Moreover, advancements in automatic milk sterilizer machines will further boost the growth of the target segment during the forecast period.
Key players including GEA Group, SPX Flow Inc., Alfa Laval, and Krones AG are working on incorporating new technology into their product ranges as well as establishing new manufacturing facilities in developing countries.
SPX Flow Inc., for example, signed a deal with Primodan A/S in February 2020 to acquire equipment and technologies for yellow cheese production. Pressing and final bringing systems, as well as curd-making technologies, are among the new additions.
Similarly, with a large number of regional as well as local businesses, the market is highly fragmented and competitive. The market's major companies are distinguished by technical advancements that lower production costs while also articulating more established and high-quality products.
Additionally, leading players are adopting strategies such as strategic alliances, mergers, partnerships, and acquisitions to expand their global footprint. For instance,
Attribute | Details |
---|---|
Estimated Market Size (2023) | USD 2231 Million |
Projected Market Size (2033) | USD 4998 Million |
Anticipated Growth Rate (2023 to 2033) | 8.4% CAGR |
Forecast Period | 2023 to 2033 |
Historical Data Available for | 2017 to 2022 |
Market Analysis | USD Million for Value and Units for Volume |
Key Regions Covered | North America; Latin America; Europe; South Asia; East Asia; Oceania; Middle East and Africa (MEA) |
Key Countries Covered | USA, Canada, Mexico, Germany, UK, France, Italy, Spain, China, Japan, India, South Korea, Australia, Brazil, Argentina, South Africa, UAE |
Key Segments Covered | Product, Method, Automation Grade, Distribution channel, Region |
Key Companies Profiled | Dion Engineering; GEA Group; Krones; SPX Flow (APV); Tetra Pak International; ABL Technology; Della Toffola; INOXPA; HydroLock; SEPAK Industries.; REDA S.P.A.; Shanghai Jimei Food Machinery; TESSA I.E.C Group; Stephan Machinery Gmbh; GOMA Engineering |
Report Coverage | Market Forecast, Company Share Analysis, Competitive Landscape, Drivers, Restraints, Opportunities and Threats Analysis, Market Dynamics and Challenges, and Strategic Growth Initiatives |
Table 1: Global Market Value (US$ Million) Forecast by Region, 2017 to 2033
Table 2: Global Market Volume (MT) Forecast by Region, 2017 to 2033
Table 3: Global Market Value (US$ Million) Forecast by Method, 2017 to 2033
Table 4: Global Market Volume (MT) Forecast by Method, 2017 to 2033
Table 5: Global Market Value (US$ Million) Forecast by Capacity, 2017 to 2033
Table 6: Global Market Volume (MT) Forecast by Capacity, 2017 to 2033
Table 7: Global Market Value (US$ Million) Forecast by Product, 2017 to 2033
Table 8: Global Market Volume (MT) Forecast by Product, 2017 to 2033
Table 9: Global Market Value (US$ Million) Forecast by Automation Grade, 2017 to 2033
Table 10: Global Market Volume (MT) Forecast by Automation Grade, 2017 to 2033
Table 11: Global Market Value (US$ Million) Forecast by Distribution Channel, 2017 to 2033
Table 12: Global Market Volume (MT) Forecast by Distribution Channel, 2017 to 2033
Table 13: North America Market Value (US$ Million) Forecast by Country, 2017 to 2033
Table 14: North America Market Volume (MT) Forecast by Country, 2017 to 2033
Table 15: North America Market Value (US$ Million) Forecast by Method, 2017 to 2033
Table 16: North America Market Volume (MT) Forecast by Method, 2017 to 2033
Table 17: North America Market Value (US$ Million) Forecast by Capacity, 2017 to 2033
Table 18: North America Market Volume (MT) Forecast by Capacity, 2017 to 2033
Table 19: North America Market Value (US$ Million) Forecast by Product, 2017 to 2033
Table 20: North America Market Volume (MT) Forecast by Product, 2017 to 2033
Table 21: North America Market Value (US$ Million) Forecast by Automation Grade, 2017 to 2033
Table 22: North America Market Volume (MT) Forecast by Automation Grade, 2017 to 2033
Table 23: North America Market Value (US$ Million) Forecast by Distribution Channel, 2017 to 2033
Table 24: North America Market Volume (MT) Forecast by Distribution Channel, 2017 to 2033
Table 25: Latin America Market Value (US$ Million) Forecast by Country, 2017 to 2033
Table 26: Latin America Market Volume (MT) Forecast by Country, 2017 to 2033
Table 27: Latin America Market Value (US$ Million) Forecast by Method, 2017 to 2033
Table 28: Latin America Market Volume (MT) Forecast by Method, 2017 to 2033
Table 29: Latin America Market Value (US$ Million) Forecast by Capacity, 2017 to 2033
Table 30: Latin America Market Volume (MT) Forecast by Capacity, 2017 to 2033
Table 31: Latin America Market Value (US$ Million) Forecast by Product, 2017 to 2033
Table 32: Latin America Market Volume (MT) Forecast by Product, 2017 to 2033
Table 33: Latin America Market Value (US$ Million) Forecast by Automation Grade, 2017 to 2033
Table 34: Latin America Market Volume (MT) Forecast by Automation Grade, 2017 to 2033
Table 35: Latin America Market Value (US$ Million) Forecast by Distribution Channel, 2017 to 2033
Table 36: Latin America Market Volume (MT) Forecast by Distribution Channel, 2017 to 2033
Table 37: Europe Market Value (US$ Million) Forecast by Country, 2017 to 2033
Table 38: Europe Market Volume (MT) Forecast by Country, 2017 to 2033
Table 39: Europe Market Value (US$ Million) Forecast by Method, 2017 to 2033
Table 40: Europe Market Volume (MT) Forecast by Method, 2017 to 2033
Table 41: Europe Market Value (US$ Million) Forecast by Capacity, 2017 to 2033
Table 42: Europe Market Volume (MT) Forecast by Capacity, 2017 to 2033
Table 43: Europe Market Value (US$ Million) Forecast by Product, 2017 to 2033
Table 44: Europe Market Volume (MT) Forecast by Product, 2017 to 2033
Table 45: Europe Market Value (US$ Million) Forecast by Automation Grade, 2017 to 2033
Table 46: Europe Market Volume (MT) Forecast by Automation Grade, 2017 to 2033
Table 47: Europe Market Value (US$ Million) Forecast by Distribution Channel, 2017 to 2033
Table 48: Europe Market Volume (MT) Forecast by Distribution Channel, 2017 to 2033
Table 49: East Asia Market Value (US$ Million) Forecast by Country, 2017 to 2033
Table 50: East Asia Market Volume (MT) Forecast by Country, 2017 to 2033
Table 51: East Asia Market Value (US$ Million) Forecast by Method, 2017 to 2033
Table 52: East Asia Market Volume (MT) Forecast by Method, 2017 to 2033
Table 53: East Asia Market Value (US$ Million) Forecast by Capacity, 2017 to 2033
Table 54: East Asia Market Volume (MT) Forecast by Capacity, 2017 to 2033
Table 55: East Asia Market Value (US$ Million) Forecast by Product, 2017 to 2033
Table 56: East Asia Market Volume (MT) Forecast by Product, 2017 to 2033
Table 57: East Asia Market Value (US$ Million) Forecast by Automation Grade, 2017 to 2033
Table 58: East Asia Market Volume (MT) Forecast by Automation Grade, 2017 to 2033
Table 59: East Asia Market Value (US$ Million) Forecast by Distribution Channel, 2017 to 2033
Table 60: East Asia Market Volume (MT) Forecast by Distribution Channel, 2017 to 2033
Table 61: South Asia Market Value (US$ Million) Forecast by Country, 2017 to 2033
Table 62: South Asia Market Volume (MT) Forecast by Country, 2017 to 2033
Table 63: South Asia Market Value (US$ Million) Forecast by Method, 2017 to 2033
Table 64: South Asia Market Volume (MT) Forecast by Method, 2017 to 2033
Table 65: South Asia Market Value (US$ Million) Forecast by Capacity, 2017 to 2033
Table 66: South Asia Market Volume (MT) Forecast by Capacity, 2017 to 2033
Table 67: South Asia Market Value (US$ Million) Forecast by Product, 2017 to 2033
Table 68: South Asia Market Volume (MT) Forecast by Product, 2017 to 2033
Table 69: South Asia Market Value (US$ Million) Forecast by Automation Grade, 2017 to 2033
Table 70: South Asia Market Volume (MT) Forecast by Automation Grade, 2017 to 2033
Table 71: South Asia Market Value (US$ Million) Forecast by Distribution Channel, 2017 to 2033
Table 72: South Asia Market Volume (MT) Forecast by Distribution Channel, 2017 to 2033
Table 73: Oceania Market Value (US$ Million) Forecast by Country, 2017 to 2033
Table 74: Oceania Market Volume (MT) Forecast by Country, 2017 to 2033
Table 75: Oceania Market Value (US$ Million) Forecast by Method, 2017 to 2033
Table 76: Oceania Market Volume (MT) Forecast by Method, 2017 to 2033
Table 77: Oceania Market Value (US$ Million) Forecast by Capacity, 2017 to 2033
Table 78: Oceania Market Volume (MT) Forecast by Capacity, 2017 to 2033
Table 79: Oceania Market Value (US$ Million) Forecast by Product, 2017 to 2033
Table 80: Oceania Market Volume (MT) Forecast by Product, 2017 to 2033
Table 81: Oceania Market Value (US$ Million) Forecast by Automation Grade, 2017 to 2033
Table 82: Oceania Market Volume (MT) Forecast by Automation Grade, 2017 to 2033
Table 83: Oceania Market Value (US$ Million) Forecast by Distribution Channel, 2017 to 2033
Table 84: Oceania Market Volume (MT) Forecast by Distribution Channel, 2017 to 2033
Table 85: MEA Market Value (US$ Million) Forecast by Country, 2017 to 2033
Table 86: MEA Market Volume (MT) Forecast by Country, 2017 to 2033
Table 87: MEA Market Value (US$ Million) Forecast by Method, 2017 to 2033
Table 88: MEA Market Volume (MT) Forecast by Method, 2017 to 2033
Table 89: MEA Market Value (US$ Million) Forecast by Capacity, 2017 to 2033
Table 90: MEA Market Volume (MT) Forecast by Capacity, 2017 to 2033
Table 91: MEA Market Value (US$ Million) Forecast by Product, 2017 to 2033
Table 92: MEA Market Volume (MT) Forecast by Product, 2017 to 2033
Table 93: MEA Market Value (US$ Million) Forecast by Automation Grade, 2017 to 2033
Table 94: MEA Market Volume (MT) Forecast by Automation Grade, 2017 to 2033
Table 95: MEA Market Value (US$ Million) Forecast by Distribution Channel, 2017 to 2033
Table 96: MEA Market Volume (MT) Forecast by Distribution Channel, 2017 to 2033
Figure 1: Global Market Value (US$ Million) by Method, 2023 to 2033
Figure 2: Global Market Value (US$ Million) by Capacity, 2023 to 2033
Figure 3: Global Market Value (US$ Million) by Product, 2023 to 2033
Figure 4: Global Market Value (US$ Million) by Automation Grade, 2023 to 2033
Figure 5: Global Market Value (US$ Million) by Distribution Channel, 2023 to 2033
Figure 6: Global Market Value (US$ Million) by Region, 2023 to 2033
Figure 7: Global Market Value (US$ Million) Analysis by Region, 2017 to 2033
Figure 8: Global Market Volume (MT) Analysis by Region, 2017 to 2033
Figure 9: Global Market Value Share (%) and BPS Analysis by Region, 2023 to 2033
Figure 10: Global Market Y-o-Y Growth (%) Projections by Region, 2023 to 2033
Figure 11: Global Market Value (US$ Million) Analysis by Method, 2017 to 2033
Figure 12: Global Market Volume (MT) Analysis by Method, 2017 to 2033
Figure 13: Global Market Value Share (%) and BPS Analysis by Method, 2023 to 2033
Figure 14: Global Market Y-o-Y Growth (%) Projections by Method, 2023 to 2033
Figure 15: Global Market Value (US$ Million) Analysis by Capacity, 2017 to 2033
Figure 16: Global Market Volume (MT) Analysis by Capacity, 2017 to 2033
Figure 17: Global Market Value Share (%) and BPS Analysis by Capacity, 2023 to 2033
Figure 18: Global Market Y-o-Y Growth (%) Projections by Capacity, 2023 to 2033
Figure 19: Global Market Value (US$ Million) Analysis by Product, 2017 to 2033
Figure 20: Global Market Volume (MT) Analysis by Product, 2017 to 2033
Figure 21: Global Market Value Share (%) and BPS Analysis by Product, 2023 to 2033
Figure 22: Global Market Y-o-Y Growth (%) Projections by Product, 2023 to 2033
Figure 23: Global Market Value (US$ Million) Analysis by Automation Grade, 2017 to 2033
Figure 24: Global Market Volume (MT) Analysis by Automation Grade, 2017 to 2033
Figure 25: Global Market Value Share (%) and BPS Analysis by Automation Grade, 2023 to 2033
Figure 26: Global Market Y-o-Y Growth (%) Projections by Automation Grade, 2023 to 2033
Figure 27: Global Market Value (US$ Million) Analysis by Distribution Channel, 2017 to 2033
Figure 28: Global Market Volume (MT) Analysis by Distribution Channel, 2017 to 2033
Figure 29: Global Market Value Share (%) and BPS Analysis by Distribution Channel, 2023 to 2033
Figure 30: Global Market Y-o-Y Growth (%) Projections by Distribution Channel, 2023 to 2033
Figure 31: Global Market Attractiveness by Method, 2023 to 2033
Figure 32: Global Market Attractiveness by Capacity, 2023 to 2033
Figure 33: Global Market Attractiveness by Product, 2023 to 2033
Figure 34: Global Market Attractiveness by Automation Grade, 2023 to 2033
Figure 35: Global Market Attractiveness by Distribution Channel, 2023 to 2033
Figure 36: Global Market Attractiveness by Region, 2023 to 2033
Figure 37: North America Market Value (US$ Million) by Method, 2023 to 2033
Figure 38: North America Market Value (US$ Million) by Capacity, 2023 to 2033
Figure 39: North America Market Value (US$ Million) by Product, 2023 to 2033
Figure 40: North America Market Value (US$ Million) by Automation Grade, 2023 to 2033
Figure 41: North America Market Value (US$ Million) by Distribution Channel, 2023 to 2033
Figure 42: North America Market Value (US$ Million) by Country, 2023 to 2033
Figure 43: North America Market Value (US$ Million) Analysis by Country, 2017 to 2033
Figure 44: North America Market Volume (MT) Analysis by Country, 2017 to 2033
Figure 45: North America Market Value Share (%) and BPS Analysis by Country, 2023 to 2033
Figure 46: North America Market Y-o-Y Growth (%) Projections by Country, 2023 to 2033
Figure 47: North America Market Value (US$ Million) Analysis by Method, 2017 to 2033
Figure 48: North America Market Volume (MT) Analysis by Method, 2017 to 2033
Figure 49: North America Market Value Share (%) and BPS Analysis by Method, 2023 to 2033
Figure 50: North America Market Y-o-Y Growth (%) Projections by Method, 2023 to 2033
Figure 51: North America Market Value (US$ Million) Analysis by Capacity, 2017 to 2033
Figure 52: North America Market Volume (MT) Analysis by Capacity, 2017 to 2033
Figure 53: North America Market Value Share (%) and BPS Analysis by Capacity, 2023 to 2033
Figure 54: North America Market Y-o-Y Growth (%) Projections by Capacity, 2023 to 2033
Figure 55: North America Market Value (US$ Million) Analysis by Product, 2017 to 2033
Figure 56: North America Market Volume (MT) Analysis by Product, 2017 to 2033
Figure 57: North America Market Value Share (%) and BPS Analysis by Product, 2023 to 2033
Figure 58: North America Market Y-o-Y Growth (%) Projections by Product, 2023 to 2033
Figure 59: North America Market Value (US$ Million) Analysis by Automation Grade, 2017 to 2033
Figure 60: North America Market Volume (MT) Analysis by Automation Grade, 2017 to 2033
Figure 61: North America Market Value Share (%) and BPS Analysis by Automation Grade, 2023 to 2033
Figure 62: North America Market Y-o-Y Growth (%) Projections by Automation Grade, 2023 to 2033
Figure 63: North America Market Value (US$ Million) Analysis by Distribution Channel, 2017 to 2033
Figure 64: North America Market Volume (MT) Analysis by Distribution Channel, 2017 to 2033
Figure 65: North America Market Value Share (%) and BPS Analysis by Distribution Channel, 2023 to 2033
Figure 66: North America Market Y-o-Y Growth (%) Projections by Distribution Channel, 2023 to 2033
Figure 67: North America Market Attractiveness by Method, 2023 to 2033
Figure 68: North America Market Attractiveness by Capacity, 2023 to 2033
Figure 69: North America Market Attractiveness by Product, 2023 to 2033
Figure 70: North America Market Attractiveness by Automation Grade, 2023 to 2033
Figure 71: North America Market Attractiveness by Distribution Channel, 2023 to 2033
Figure 72: North America Market Attractiveness by Country, 2023 to 2033
Figure 73: Latin America Market Value (US$ Million) by Method, 2023 to 2033
Figure 74: Latin America Market Value (US$ Million) by Capacity, 2023 to 2033
Figure 75: Latin America Market Value (US$ Million) by Product, 2023 to 2033
Figure 76: Latin America Market Value (US$ Million) by Automation Grade, 2023 to 2033
Figure 77: Latin America Market Value (US$ Million) by Distribution Channel, 2023 to 2033
Figure 78: Latin America Market Value (US$ Million) by Country, 2023 to 2033
Figure 79: Latin America Market Value (US$ Million) Analysis by Country, 2017 to 2033
Figure 80: Latin America Market Volume (MT) Analysis by Country, 2017 to 2033
Figure 81: Latin America Market Value Share (%) and BPS Analysis by Country, 2023 to 2033
Figure 82: Latin America Market Y-o-Y Growth (%) Projections by Country, 2023 to 2033
Figure 83: Latin America Market Value (US$ Million) Analysis by Method, 2017 to 2033
Figure 84: Latin America Market Volume (MT) Analysis by Method, 2017 to 2033
Figure 85: Latin America Market Value Share (%) and BPS Analysis by Method, 2023 to 2033
Figure 86: Latin America Market Y-o-Y Growth (%) Projections by Method, 2023 to 2033
Figure 87: Latin America Market Value (US$ Million) Analysis by Capacity, 2017 to 2033
Figure 88: Latin America Market Volume (MT) Analysis by Capacity, 2017 to 2033
Figure 89: Latin America Market Value Share (%) and BPS Analysis by Capacity, 2023 to 2033
Figure 90: Latin America Market Y-o-Y Growth (%) Projections by Capacity, 2023 to 2033
Figure 91: Latin America Market Value (US$ Million) Analysis by Product, 2017 to 2033
Figure 92: Latin America Market Volume (MT) Analysis by Product, 2017 to 2033
Figure 93: Latin America Market Value Share (%) and BPS Analysis by Product, 2023 to 2033
Figure 94: Latin America Market Y-o-Y Growth (%) Projections by Product, 2023 to 2033
Figure 95: Latin America Market Value (US$ Million) Analysis by Automation Grade, 2017 to 2033
Figure 96: Latin America Market Volume (MT) Analysis by Automation Grade, 2017 to 2033
Figure 97: Latin America Market Value Share (%) and BPS Analysis by Automation Grade, 2023 to 2033
Figure 98: Latin America Market Y-o-Y Growth (%) Projections by Automation Grade, 2023 to 2033
Figure 99: Latin America Market Value (US$ Million) Analysis by Distribution Channel, 2017 to 2033
Figure 100: Latin America Market Volume (MT) Analysis by Distribution Channel, 2017 to 2033
Figure 101: Latin America Market Value Share (%) and BPS Analysis by Distribution Channel, 2023 to 2033
Figure 102: Latin America Market Y-o-Y Growth (%) Projections by Distribution Channel, 2023 to 2033
Figure 103: Latin America Market Attractiveness by Method, 2023 to 2033
Figure 104: Latin America Market Attractiveness by Capacity, 2023 to 2033
Figure 105: Latin America Market Attractiveness by Product, 2023 to 2033
Figure 106: Latin America Market Attractiveness by Automation Grade, 2023 to 2033
Figure 107: Latin America Market Attractiveness by Distribution Channel, 2023 to 2033
Figure 108: Latin America Market Attractiveness by Country, 2023 to 2033
Figure 109: Europe Market Value (US$ Million) by Method, 2023 to 2033
Figure 110: Europe Market Value (US$ Million) by Capacity, 2023 to 2033
Figure 111: Europe Market Value (US$ Million) by Product, 2023 to 2033
Figure 112: Europe Market Value (US$ Million) by Automation Grade, 2023 to 2033
Figure 113: Europe Market Value (US$ Million) by Distribution Channel, 2023 to 2033
Figure 114: Europe Market Value (US$ Million) by Country, 2023 to 2033
Figure 115: Europe Market Value (US$ Million) Analysis by Country, 2017 to 2033
Figure 116: Europe Market Volume (MT) Analysis by Country, 2017 to 2033
Figure 117: Europe Market Value Share (%) and BPS Analysis by Country, 2023 to 2033
Figure 118: Europe Market Y-o-Y Growth (%) Projections by Country, 2023 to 2033
Figure 119: Europe Market Value (US$ Million) Analysis by Method, 2017 to 2033
Figure 120: Europe Market Volume (MT) Analysis by Method, 2017 to 2033
Figure 121: Europe Market Value Share (%) and BPS Analysis by Method, 2023 to 2033
Figure 122: Europe Market Y-o-Y Growth (%) Projections by Method, 2023 to 2033
Figure 123: Europe Market Value (US$ Million) Analysis by Capacity, 2017 to 2033
Figure 124: Europe Market Volume (MT) Analysis by Capacity, 2017 to 2033
Figure 125: Europe Market Value Share (%) and BPS Analysis by Capacity, 2023 to 2033
Figure 126: Europe Market Y-o-Y Growth (%) Projections by Capacity, 2023 to 2033
Figure 127: Europe Market Value (US$ Million) Analysis by Product, 2017 to 2033
Figure 128: Europe Market Volume (MT) Analysis by Product, 2017 to 2033
Figure 129: Europe Market Value Share (%) and BPS Analysis by Product, 2023 to 2033
Figure 130: Europe Market Y-o-Y Growth (%) Projections by Product, 2023 to 2033
Figure 131: Europe Market Value (US$ Million) Analysis by Automation Grade, 2017 to 2033
Figure 132: Europe Market Volume (MT) Analysis by Automation Grade, 2017 to 2033
Figure 133: Europe Market Value Share (%) and BPS Analysis by Automation Grade, 2023 to 2033
Figure 134: Europe Market Y-o-Y Growth (%) Projections by Automation Grade, 2023 to 2033
Figure 135: Europe Market Value (US$ Million) Analysis by Distribution Channel, 2017 to 2033
Figure 136: Europe Market Volume (MT) Analysis by Distribution Channel, 2017 to 2033
Figure 137: Europe Market Value Share (%) and BPS Analysis by Distribution Channel, 2023 to 2033
Figure 138: Europe Market Y-o-Y Growth (%) Projections by Distribution Channel, 2023 to 2033
Figure 139: Europe Market Attractiveness by Method, 2023 to 2033
Figure 140: Europe Market Attractiveness by Capacity, 2023 to 2033
Figure 141: Europe Market Attractiveness by Product, 2023 to 2033
Figure 142: Europe Market Attractiveness by Automation Grade, 2023 to 2033
Figure 143: Europe Market Attractiveness by Distribution Channel, 2023 to 2033
Figure 144: Europe Market Attractiveness by Country, 2023 to 2033
Figure 145: East Asia Market Value (US$ Million) by Method, 2023 to 2033
Figure 146: East Asia Market Value (US$ Million) by Capacity, 2023 to 2033
Figure 147: East Asia Market Value (US$ Million) by Product, 2023 to 2033
Figure 148: East Asia Market Value (US$ Million) by Automation Grade, 2023 to 2033
Figure 149: East Asia Market Value (US$ Million) by Distribution Channel, 2023 to 2033
Figure 150: East Asia Market Value (US$ Million) by Country, 2023 to 2033
Figure 151: East Asia Market Value (US$ Million) Analysis by Country, 2017 to 2033
Figure 152: East Asia Market Volume (MT) Analysis by Country, 2017 to 2033
Figure 153: East Asia Market Value Share (%) and BPS Analysis by Country, 2023 to 2033
Figure 154: East Asia Market Y-o-Y Growth (%) Projections by Country, 2023 to 2033
Figure 155: East Asia Market Value (US$ Million) Analysis by Method, 2017 to 2033
Figure 156: East Asia Market Volume (MT) Analysis by Method, 2017 to 2033
Figure 157: East Asia Market Value Share (%) and BPS Analysis by Method, 2023 to 2033
Figure 158: East Asia Market Y-o-Y Growth (%) Projections by Method, 2023 to 2033
Figure 159: East Asia Market Value (US$ Million) Analysis by Capacity, 2017 to 2033
Figure 160: East Asia Market Volume (MT) Analysis by Capacity, 2017 to 2033
Figure 161: East Asia Market Value Share (%) and BPS Analysis by Capacity, 2023 to 2033
Figure 162: East Asia Market Y-o-Y Growth (%) Projections by Capacity, 2023 to 2033
Figure 163: East Asia Market Value (US$ Million) Analysis by Product, 2017 to 2033
Figure 164: East Asia Market Volume (MT) Analysis by Product, 2017 to 2033
Figure 165: East Asia Market Value Share (%) and BPS Analysis by Product, 2023 to 2033
Figure 166: East Asia Market Y-o-Y Growth (%) Projections by Product, 2023 to 2033
Figure 167: East Asia Market Value (US$ Million) Analysis by Automation Grade, 2017 to 2033
Figure 168: East Asia Market Volume (MT) Analysis by Automation Grade, 2017 to 2033
Figure 169: East Asia Market Value Share (%) and BPS Analysis by Automation Grade, 2023 to 2033
Figure 170: East Asia Market Y-o-Y Growth (%) Projections by Automation Grade, 2023 to 2033
Figure 171: East Asia Market Value (US$ Million) Analysis by Distribution Channel, 2017 to 2033
Figure 172: East Asia Market Volume (MT) Analysis by Distribution Channel, 2017 to 2033
Figure 173: East Asia Market Value Share (%) and BPS Analysis by Distribution Channel, 2023 to 2033
Figure 174: East Asia Market Y-o-Y Growth (%) Projections by Distribution Channel, 2023 to 2033
Figure 175: East Asia Market Attractiveness by Method, 2023 to 2033
Figure 176: East Asia Market Attractiveness by Capacity, 2023 to 2033
Figure 177: East Asia Market Attractiveness by Product, 2023 to 2033
Figure 178: East Asia Market Attractiveness by Automation Grade, 2023 to 2033
Figure 179: East Asia Market Attractiveness by Distribution Channel, 2023 to 2033
Figure 180: East Asia Market Attractiveness by Country, 2023 to 2033
Figure 181: South Asia Market Value (US$ Million) by Method, 2023 to 2033
Figure 182: South Asia Market Value (US$ Million) by Capacity, 2023 to 2033
Figure 183: South Asia Market Value (US$ Million) by Product, 2023 to 2033
Figure 184: South Asia Market Value (US$ Million) by Automation Grade, 2023 to 2033
Figure 185: South Asia Market Value (US$ Million) by Distribution Channel, 2023 to 2033
Figure 186: South Asia Market Value (US$ Million) by Country, 2023 to 2033
Figure 187: South Asia Market Value (US$ Million) Analysis by Country, 2017 to 2033
Figure 188: South Asia Market Volume (MT) Analysis by Country, 2017 to 2033
Figure 189: South Asia Market Value Share (%) and BPS Analysis by Country, 2023 to 2033
Figure 190: South Asia Market Y-o-Y Growth (%) Projections by Country, 2023 to 2033
Figure 191: South Asia Market Value (US$ Million) Analysis by Method, 2017 to 2033
Figure 192: South Asia Market Volume (MT) Analysis by Method, 2017 to 2033
Figure 193: South Asia Market Value Share (%) and BPS Analysis by Method, 2023 to 2033
Figure 194: South Asia Market Y-o-Y Growth (%) Projections by Method, 2023 to 2033
Figure 195: South Asia Market Value (US$ Million) Analysis by Capacity, 2017 to 2033
Figure 196: South Asia Market Volume (MT) Analysis by Capacity, 2017 to 2033
Figure 197: South Asia Market Value Share (%) and BPS Analysis by Capacity, 2023 to 2033
Figure 198: South Asia Market Y-o-Y Growth (%) Projections by Capacity, 2023 to 2033
Figure 199: South Asia Market Value (US$ Million) Analysis by Product, 2017 to 2033
Figure 200: South Asia Market Volume (MT) Analysis by Product, 2017 to 2033
Figure 201: South Asia Market Value Share (%) and BPS Analysis by Product, 2023 to 2033
Figure 202: South Asia Market Y-o-Y Growth (%) Projections by Product, 2023 to 2033
Figure 203: South Asia Market Value (US$ Million) Analysis by Automation Grade, 2017 to 2033
Figure 204: South Asia Market Volume (MT) Analysis by Automation Grade, 2017 to 2033
Figure 205: South Asia Market Value Share (%) and BPS Analysis by Automation Grade, 2023 to 2033
Figure 206: South Asia Market Y-o-Y Growth (%) Projections by Automation Grade, 2023 to 2033
Figure 207: South Asia Market Value (US$ Million) Analysis by Distribution Channel, 2017 to 2033
Figure 208: South Asia Market Volume (MT) Analysis by Distribution Channel, 2017 to 2033
Figure 209: South Asia Market Value Share (%) and BPS Analysis by Distribution Channel, 2023 to 2033
Figure 210: South Asia Market Y-o-Y Growth (%) Projections by Distribution Channel, 2023 to 2033
Figure 211: South Asia Market Attractiveness by Method, 2023 to 2033
Figure 212: South Asia Market Attractiveness by Capacity, 2023 to 2033
Figure 213: South Asia Market Attractiveness by Product, 2023 to 2033
Figure 214: South Asia Market Attractiveness by Automation Grade, 2023 to 2033
Figure 215: South Asia Market Attractiveness by Distribution Channel, 2023 to 2033
Figure 216: South Asia Market Attractiveness by Country, 2023 to 2033
Figure 217: Oceania Market Value (US$ Million) by Method, 2023 to 2033
Figure 218: Oceania Market Value (US$ Million) by Capacity, 2023 to 2033
Figure 219: Oceania Market Value (US$ Million) by Product, 2023 to 2033
Figure 220: Oceania Market Value (US$ Million) by Automation Grade, 2023 to 2033
Figure 221: Oceania Market Value (US$ Million) by Distribution Channel, 2023 to 2033
Figure 222: Oceania Market Value (US$ Million) by Country, 2023 to 2033
Figure 223: Oceania Market Value (US$ Million) Analysis by Country, 2017 to 2033
Figure 224: Oceania Market Volume (MT) Analysis by Country, 2017 to 2033
Figure 225: Oceania Market Value Share (%) and BPS Analysis by Country, 2023 to 2033
Figure 226: Oceania Market Y-o-Y Growth (%) Projections by Country, 2023 to 2033
Figure 227: Oceania Market Value (US$ Million) Analysis by Method, 2017 to 2033
Figure 228: Oceania Market Volume (MT) Analysis by Method, 2017 to 2033
Figure 229: Oceania Market Value Share (%) and BPS Analysis by Method, 2023 to 2033
Figure 230: Oceania Market Y-o-Y Growth (%) Projections by Method, 2023 to 2033
Figure 231: Oceania Market Value (US$ Million) Analysis by Capacity, 2017 to 2033
Figure 232: Oceania Market Volume (MT) Analysis by Capacity, 2017 to 2033
Figure 233: Oceania Market Value Share (%) and BPS Analysis by Capacity, 2023 to 2033
Figure 234: Oceania Market Y-o-Y Growth (%) Projections by Capacity, 2023 to 2033
Figure 235: Oceania Market Value (US$ Million) Analysis by Product, 2017 to 2033
Figure 236: Oceania Market Volume (MT) Analysis by Product, 2017 to 2033
Figure 237: Oceania Market Value Share (%) and BPS Analysis by Product, 2023 to 2033
Figure 238: Oceania Market Y-o-Y Growth (%) Projections by Product, 2023 to 2033
Figure 239: Oceania Market Value (US$ Million) Analysis by Automation Grade, 2017 to 2033
Figure 240: Oceania Market Volume (MT) Analysis by Automation Grade, 2017 to 2033
Figure 241: Oceania Market Value Share (%) and BPS Analysis by Automation Grade, 2023 to 2033
Figure 242: Oceania Market Y-o-Y Growth (%) Projections by Automation Grade, 2023 to 2033
Figure 243: Oceania Market Value (US$ Million) Analysis by Distribution Channel, 2017 to 2033
Figure 244: Oceania Market Volume (MT) Analysis by Distribution Channel, 2017 to 2033
Figure 245: Oceania Market Value Share (%) and BPS Analysis by Distribution Channel, 2023 to 2033
Figure 246: Oceania Market Y-o-Y Growth (%) Projections by Distribution Channel, 2023 to 2033
Figure 247: Oceania Market Attractiveness by Method, 2023 to 2033
Figure 248: Oceania Market Attractiveness by Capacity, 2023 to 2033
Figure 249: Oceania Market Attractiveness by Product, 2023 to 2033
Figure 250: Oceania Market Attractiveness by Automation Grade, 2023 to 2033
Figure 251: Oceania Market Attractiveness by Distribution Channel, 2023 to 2033
Figure 252: Oceania Market Attractiveness by Country, 2023 to 2033
Figure 253: MEA Market Value (US$ Million) by Method, 2023 to 2033
Figure 254: MEA Market Value (US$ Million) by Capacity, 2023 to 2033
Figure 255: MEA Market Value (US$ Million) by Product, 2023 to 2033
Figure 256: MEA Market Value (US$ Million) by Automation Grade, 2023 to 2033
Figure 257: MEA Market Value (US$ Million) by Distribution Channel, 2023 to 2033
Figure 258: MEA Market Value (US$ Million) by Country, 2023 to 2033
Figure 259: MEA Market Value (US$ Million) Analysis by Country, 2017 to 2033
Figure 260: MEA Market Volume (MT) Analysis by Country, 2017 to 2033
Figure 261: MEA Market Value Share (%) and BPS Analysis by Country, 2023 to 2033
Figure 262: MEA Market Y-o-Y Growth (%) Projections by Country, 2023 to 2033
Figure 263: MEA Market Value (US$ Million) Analysis by Method, 2017 to 2033
Figure 264: MEA Market Volume (MT) Analysis by Method, 2017 to 2033
Figure 265: MEA Market Value Share (%) and BPS Analysis by Method, 2023 to 2033
Figure 266: MEA Market Y-o-Y Growth (%) Projections by Method, 2023 to 2033
Figure 267: MEA Market Value (US$ Million) Analysis by Capacity, 2017 to 2033
Figure 268: MEA Market Volume (MT) Analysis by Capacity, 2017 to 2033
Figure 269: MEA Market Value Share (%) and BPS Analysis by Capacity, 2023 to 2033
Figure 270: MEA Market Y-o-Y Growth (%) Projections by Capacity, 2023 to 2033
Figure 271: MEA Market Value (US$ Million) Analysis by Product, 2017 to 2033
Figure 272: MEA Market Volume (MT) Analysis by Product, 2017 to 2033
Figure 273: MEA Market Value Share (%) and BPS Analysis by Product, 2023 to 2033
Figure 274: MEA Market Y-o-Y Growth (%) Projections by Product, 2023 to 2033
Figure 275: MEA Market Value (US$ Million) Analysis by Automation Grade, 2017 to 2033
Figure 276: MEA Market Volume (MT) Analysis by Automation Grade, 2017 to 2033
Figure 277: MEA Market Value Share (%) and BPS Analysis by Automation Grade, 2023 to 2033
Figure 278: MEA Market Y-o-Y Growth (%) Projections by Automation Grade, 2023 to 2033
Figure 279: MEA Market Value (US$ Million) Analysis by Distribution Channel, 2017 to 2033
Figure 280: MEA Market Volume (MT) Analysis by Distribution Channel, 2017 to 2033
Figure 281: MEA Market Value Share (%) and BPS Analysis by Distribution Channel, 2023 to 2033
Figure 282: MEA Market Y-o-Y Growth (%) Projections by Distribution Channel, 2023 to 2033
Figure 283: MEA Market Attractiveness by Method, 2023 to 2033
Figure 284: MEA Market Attractiveness by Capacity, 2023 to 2033
Figure 285: MEA Market Attractiveness by Product, 2023 to 2033
Figure 286: MEA Market Attractiveness by Automation Grade, 2023 to 2033
Figure 287: MEA Market Attractiveness by Distribution Channel, 2023 to 2033
Figure 288: MEA Market Attractiveness by Country, 2023 to 2033
The global milk sterilizer machine market size is expected to reach USD 2231 Million in 2023.
As per FMI, the milk sterilizer machine market is likely to expand at 8.4% through 2033.
The global milk sterilizer machine market is projected to surpass a valuation of USD 4998 Million by the end of 2033.
North America holds around 38% share of the global milk sterilizer machine market.
The USA, India, China, Canada, Germany, and Mexico are the major countries driving demand for milk sterilizer machines.
China’s milk sterilizer machine market is projected to grow at a CAGR of around 8.7% over the next ten years.
Dion Engineering, GEA Group, Krones, SPX Flow (APV), and Tetra Pak International are the top players operating in the global milk sterilizer market.
Explore Similar Insights
Thank you!
You will receive an email from our Business Development Manager. Please be sure to check your SPAM/JUNK folder too.