Milk Pasteurization Machines Market Outlook (2023 to 2033)

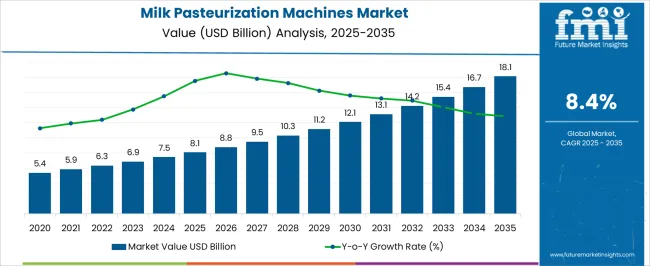
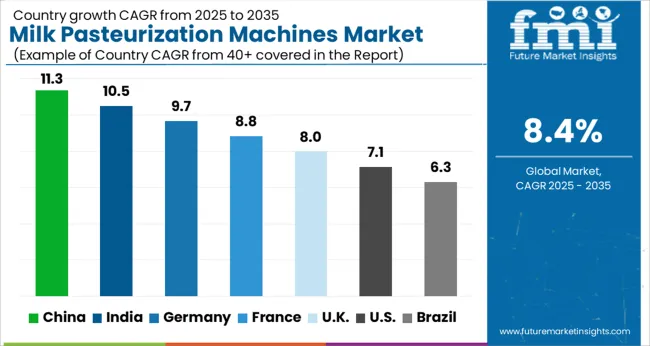
The global milk pasteurization machines market size reached US$ 2,300 Million in 2021 and is likely to touch a valuation of US$ 3,072 Million by the end of 2023. Furthermore, with rising demand for diary-based products worldwide, the overall sales of milk pasteurization machines are projected to grow at 8.4% CAGR between 2023 and 2033, totaling a market valuation of US$ 6,882 Million by 2033.

Milk pasteurization machines are equipment used for pasteurizing raw milk to eliminate pathogens and extend shelf life. They have gained immense traction during the last few decades and the trend is expected to further escalate during the next ten years, owing to the rising popularity of pasteurized milk.

These machines are designed to destroy or deactivate organisms and enzymes that contribute to the spoilage of milk products. The adoption of these machines reduces human intervention and improves the quality of products. Besides this, they help milk processing companies to increase their productivity.

It has been observed that the consumption of unpasteurized dairy products can cause several foodborne illnesses due to the presence of pathogens. As a result, consumers are showing a keen inclination toward using pasteurized milk. This is playing a crucial role in boosting the growth of the milk pasteurization machines market.

Similarly, growing consumption of dairy-based products due to their high nutritional value along with growing health awareness among consumers is expected to boost sales of milk pasteurization machines during the forecast period.

The growing preference for custom-built milk pasteurization machines and advancements in pasteurization technology will generate lucrative growth opportunities for leading milk pasteurization machine manufacturers over the next ten years.

Attribute Key Statistics
Milk Pasteurization Machines Market Estimated Value (2023) US$ 3,072 Million
Projected Market Value (2033) US$ 6,882 Million
Value-based CAGR (2023 to 2033) 8.4%
Market Share of India in the South Asia Market 28.6%

Don't pay for what you don't need

Customize your report by selecting specific countries or regions and save 30%!

2017 to 2022 Milk Pasteurization Machines Market Outlook Compared to 2023 to 2033 Forecast

The global milk pasteurization machines market is anticipated to grow at 8.4% CAGR between 2023 and 2033 in comparison to the 6.2% CAGR registered during the historical period of 2017 to 2022.

The rapid growth of the dairy industry across the world and the increasing need for extending the shelf life of milk and milk-based products are some of the key factors driving the growth of the global milk pasteurization machines market.

Similarly, due to several variables, including increasing milk production, consumption, and manufacturing automation in the dairy industry, the milk pasteurization machines market has promising development potential.

Milk processing companies use pasteurization processes to eliminate pathogens from raw milk and extend its shelf life. For this purpose, they employ various automatic and semi-automatic milk pasteurization machines. This will continue to boost the market during the forecast period.

Regionally, North America holds the largest market share, and it is expected to continue to expand during the projection period. This can be attributed to the rising consumption of dairy-based products, growing adoption of automation in milk processing industries, and favorable legal and regulatory environment.

Brief Assessment of Roadblocks Faced by the Manufacturers

Rising Production and Consumption of Dairy-based Items Boosting Market

Over the years, there has been a rapid surge in the consumption of dairy-based products, especially across developed and developing nations like the USA, the UK, Japan, India, and China.

People across these regions are spending large amounts on milk-based products such as cheese, yogurt, butter, and ice-creams due to their high nutritional content. This is playing a crucial role in expanding the milk pasteurization machines market.

Similarly, the growing popularity of pasteurized milk across industries like bakeries, confectionery, and dietary supplements is likely to propel the demand for milk pasteurization machines during the forecast period.
Nandini Roy Choudhury

Principal Consultant

Talk to Analyst

Find your sweet spots for generating winning opportunities in this market.

Country-wise Insights

How is the USA Milk Pasteurization Machine Market Shaping?

Increasing Consumption of Dairy-based Products Pushing Demand in the USA

According to FMI, the USA milk pasteurization machines market is estimated at around US$ 793.8 Million in 2023 and it holds the largest share of 68% in the North American market. Furthermore, with rising support from the federal and state government and huge investments in innovation and automation, the USA is likely to lead the global milk pasteurization machines market.

Rising consumption of dairy-based products, growing adoption of automation, and the heavy presence of leading manufacturers are some of the key factors driving growth in the USA milk pasteurization machines market.

Over the years, there has been a sharp rise in the consumption of milk-based products like cheese and yogurt across the USA For instance, as per the International Dairy Foods Association, American dairy per capita consumption across products consistently has been increasing each year, with 2019 up 6% over the past five years, 10% over the past 15 years, and 16% over the past 30 years. This will continue to boost the milk pasteurization machines market in the country over the next ten years.

Similarly, with the rapid expansion of industries like the dietary supplement industry, baking industry, and confectionary industry, demand for milk pasteurization machines is likely to grow at a robust pace across the USA through 2033.

How Will Growth Unfold in the UK Milk Pasteurization Machines Market?

Increasing Adoption of Automation Pushing Demand in Germany

The UK milk pasteurization machines market is estimated to be worth roughly US$ 216.3 Million in 2023 and it is poised to expand at a healthy pace during the next ten years. Increasing dairy product consumption, the surge in the number of new start-ups, and the availability of advanced machinery are expected to drive the UK milk pasteurization machines market.

Similarly, the rapid growth of the dairy equipment industry in the UK and the ease of exporting dairy equipment to various countries with the help of free trade agreements between the UK and other countries are contributing to the expansion of the milk pasteurization machines market in the country.

In addition to this, the rising adoption of automation by milk processing companies to improve product quality and reduce errors is expected to propel sales of milk pasteurization machines in Germany during the forecast period.

Why is Germany Emerging as a Lucrative Milk Pasteurization Machines Market?

Rising Export of Advanced Machinery Boosting Milk Pasteurization Machines Market in Germany

As per FMI, demand for milk pasteurization machines across Germany is expected to grow at a strong pace during the forecast period, owing to the rise in the export of advanced machinery, favorable government support, and the strong presence of leading manufacturers such as GEA Engineering and Krones AG.

The machinery and equipment sector contribute significantly to Germany’s GDP. The majority of the world's exports of machinery and equipment come from Germany. The milk pasteurization machine industry in Germany is thriving thanks to automation in machine manufacture and the flexibility of export law.

Category-wise Insights

Why is Demand for Automatic Milk Pasteurization Machines Rising?

Growing Need for Reducing Human Intervention Fuelling Adoption of Automatic Machines

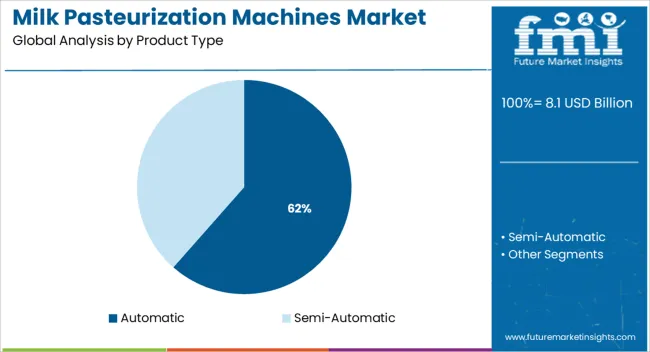
Based on product type, the global milk pasteurization machines market is segmented into automatic and semi-automatic. Among these, the automatic milk pasteurization machines segment is likely to grow at the fastest pace during the forecast period.

This can be attributed to the rising adoption of automatic machines by milk processing companies to reduce human intervention, improve overall productivity, and reduce labor costs. Besides this, the growing need for improving product quality and safety is expected to further push the demand for automatic milk pasteurization machines during the forecast period.

Why is Ultra High-Temperature Pasteurization Gaining Wider Popularity?

The ability of Ultra High-Temperature Technique to Significantly Increase Shelf Life of Milk Products

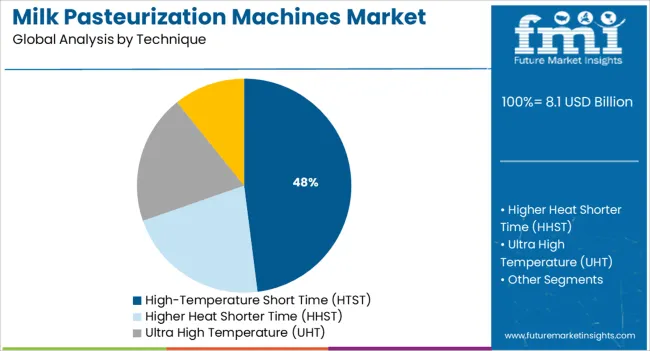
As per FMI, the ultra-high temperature segment is expected to generate the largest revenue share in the global milk pasteurization machines market during the forecast period. This can be attributed to the rising adoption of ultra-high-temperature pasteurization techniques for milk production.

Ultra-high-temperature (UHT) technique involves heating milk or cream to 138-150 °C for one or two seconds. It has gained immense popularity among users on account of its ability to convert highly perishable milk into a product with a shelf life extended from days to a month and can be stored and transported without refrigeration conditions.

Get the data you need at a Fraction of the cost

Personalize your report by choosing insights you need
and save 40%!

Competitive Landscape

Leading players in the milk pasteurization machines market are adopting strategies such as new product launches, partnerships, mergers, acquisitions, and collaborations to gain a competitive edge in the market. For instance,

  • In May 2022, GEA unveiled its milk Pasteurizer Skid, a new compact, pre-assembled milk pasteurizer with a skimming separator and state-of-art automation.
  • Recently Krones launched a new LinaFLex tunnel pasteurizer by which pasteurization may be accomplished with fine PU control and effective resource management.

Milk Pasteurization Machines Market Report Scope

Attribute Details
Estimated Market Size (2023) US$ 3,072 Million
Projected Market Size (2033) 8.4% CAGR
Anticipated Growth Rate (2023 to 2033) US$ 6,882 Million
Forecast Period 2023 to 2033
Historical Data Available for 2017 to 2022
Market Analysis US$ Million for Value and Units for Volume
Key Regions Covered
  • North America
  • Latin America
  • Europe
  • Asia Pacific
  • Oceania
  • Middle East and Africa (MEA)
Key Countries Covered
  • USA
  • Canada
  • Mexico
  • Germany
  • UK
  • France
  • Italy
  • Spain
  • China
  • Japan
  • India
  • South Korea
  • Malaysia
  • Thailand
  • Indonesia
  • Australia
  • Brazil
  • Argentina
  • South Africa
  • UAE
Key Segments Covered
  • Product Type
  • Method
  • Technique
  • Capacity
  • Region
Key Companies Profiled
  • Dion Engineering
  • GEA Group
  • Krones
  • SPX Flow (APV)
  • Tetra Pak International
  • ABL Technology
  • Della Toffola
  • INOXPA
  • KHS
  • SEPAK Industries.
  • REDA S.P.A.
  • Shanghai Jimei Food Machinery
  • TESSA I.E.C Group
  • Stephan Machinery Gmbh
  • GOMA Engineering
  • Nanjing Prosky Food Machinery Manufacturing Co. Ltd
  • JBT
  • Neologic Engineers Private Ltd.
  • M&E Trading Gmbh & Co KG
  • Iwai Kikai Kogyo Co. Ltd
  • Machine Point Group
  • Paul Mueller Company
  • IMA Group
  • Alfa Laval
  • Elecster Oyj
  • Shanghai Triowin Intelligent Machinery
  • Microthermics
  • Feldmeier Equipment Inc
  • Scherjon Dairy Equipment Holland B.V.
  • Highland Equipment Inc.
  • Repute Engineers Private Limited
  • Midland (ADM)
  • Wilmar International (Singapore)
Report Coverage Market Forecast, Company Share Analysis, Competitive Landscape, Drivers, Restraints, Opportunities and Threats Analysis, Market Dynamics and Challenges, and Strategic Growth Initiatives

Milk Pasteurization Machines Market Segmentation

By Product Type:

  • Automatic
  • Semi-automatic

By Technique:

  • High-Temperature Short Time (HTST)
  • Higher Heat Shorter Time (HHST)
  • Ultra High Temperature (UHT)
  • Ultra Pasteurized (UP)

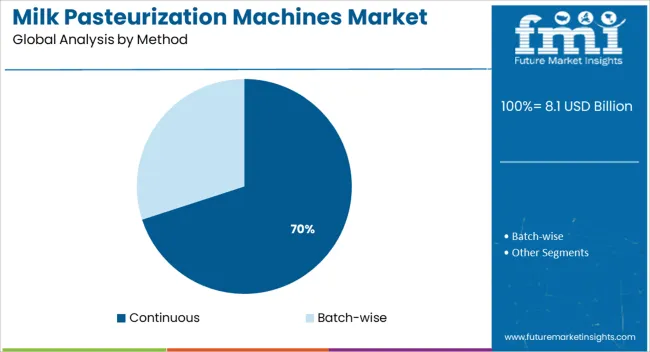
By Method:

  • Batch-wise
  • Continuous

By Capacity:

  • Less than 10,000 liters per hour
  • 10,000 liters per hour to 40,000 liters per hour
  • Over 40,000 liters per hour

By Region:

  • North America
  • Latin America
  • Europe
  • Asia Pacific
  • Oceania
  • Middle East and Africa (MEA)

Frequently Asked Questions

How big is the milk pasteurization machines market?

The global milk pasteurization machines market size is expected to reach US$ 3,072 Million in 2023.

At what rate is milk pasteurization machines market expected to grow during the forecast period?

As per FMI, the overall milk pasteurization machines market is expected to grow at a CAGR of 8.4% during the forecast period (2023 to 2033).

What is the projected valuation for the milk pasteurization machines market?

The global milk pasteurization machines market is projected to surpass a valuation of US$ 6,882 Million by the end of 2033.

Which are the major countries driving demand for the milk pasteurization machines?

The USA, China, Canada, Germany, and Mexico are the major countries driving demand for milk pasteurization machines.

How big is the India milk pasteurization machines market?

Currently, India holds around 28.6% share of the South Asia milk pasteurization machines market.

Who are the top 5 players operating in the milk pasteurization machines market?

GEA Group, Dion Engineering, Krones, SPX Flow(APV), and Tetra Pak International are some of the top players operating in the global milk pasteurization machines market.

Table of Content
1. Executive Summary | Milk Pasteurization Machines Market

    1.1. Global Market Outlook

    1.2. Demand-side Trends

    1.3. Supply-side Trends

    1.4. Technology Roadmap Analysis

    1.5. Analysis and Recommendations

2. Market Overview

    2.1. Market Coverage / Taxonomy

    2.2. Market Definition / Scope / Limitations

3. Market Background

    3.1. Market Dynamics

        3.1.1. Drivers

        3.1.2. Restraints

        3.1.3. Opportunity

        3.1.4. Trends

    3.2. Scenario Forecast

        3.2.1. Demand in Optimistic Scenario

        3.2.2. Demand in Likely Scenario

        3.2.3. Demand in Conservative Scenario

    3.3. Product launches & Recent Developments

    3.4. Product Life Cycle Analysis

    3.5. Value Chain Analysis

        3.5.1. Supply Side Participants and their Roles

            3.5.1.1. Producers

            3.5.1.2. Mid-Level Participants (Traders/ Agents/ Brokers)

            3.5.1.3. Wholesalers and Distributors

        3.5.2. % of Operating Margin Analysis

        3.5.3. List of Raw Material Suppliers

        3.5.4. List of Existing and Potential Buyers

    3.6. Market- Pricing Analysis

        3.6.1. Price Point Assessment by Region

        3.6.2. Price Point Assessment by Product Type

        3.6.3. Price Forecast till 2033

        3.6.4. Factors affecting Pricing

    3.7. Forecast Factors - Relevance & Impact

    3.8. Regulatory Landscape

        3.8.1. Packaging & Labelling Regulations

        3.8.2. Certifications and Certifying Agency Overview

        3.8.3. Import/Export Policies

    3.9. Regional Parent Market Outlook

    3.10. Consumers Survey Analysis

    3.11. Macro-Economic Factors

    3.12. Product Claims & Nutritional Information scanned by Buyers

4. Global Market Analysis 2017 to 2022 and Forecast, 2023 to 2033

    4.1. Historical Market Size Value (US$ Million) & Volume (MT) Analysis, 2017 to 2022

    4.2. Current and Future Market Size Value (US$ Million) & Volume (MT) Projections, 2023 to 2033

        4.2.1. Y-o-Y Growth Trend Analysis

        4.2.2. Absolute $ Opportunity Analysis

5. Global Market Analysis 2017 to 2022 and Forecast 2023 to 2033, By Product Type

    5.1. Introduction / Key Findings

    5.2. Historical Market Size Value (US$ Million) & Volume (MT) Analysis By Product Type, 2017 to 2022

    5.3. Current and Future Market Size Value (US$ Million) & Volume (MT) Analysis and Forecast By Product Type, 2023 to 2033

        5.3.1. Automatic

        5.3.2. Semi-Automatic

    5.4. Y-o-Y Growth Trend Analysis By Product Type, 2017 to 2022

    5.5. Absolute $ Opportunity Analysis By Product Type, 2023 to 2033

6. Global Market Analysis 2017 to 2022 and Forecast 2023 to 2033, By Technique

    6.1. Introduction / Key Findings

    6.2. Historical Market Size Value (US$ Million) & Volume (MT) Analysis By Technique, 2017 to 2022

    6.3. Current and Future Market Size Value (US$ Million) & Volume (MT) Analysis and Forecast By Technique, 2023 to 2033

        6.3.1. High-Temperature Short Time (HTST)

        6.3.2. Higher Heat Shorter Time (HHST)

        6.3.3. Ultra High Temperature (UHT)

        6.3.4. Ultra-Pasteurized (UP)

    6.4. Y-o-Y Growth Trend Analysis By Technique, 2017 to 2022

    6.5. Absolute $ Opportunity Analysis By Technique, 2023 to 2033

7. Global Market Analysis 2017 to 2022 and Forecast 2023 to 2033, By Method

    7.1. Introduction / Key Findings

    7.2. Historical Market Size Value (US$ Million) & Volume (MT) Analysis By Method, 2017 to 2022

    7.3. Current and Future Market Size Value (US$ Million) & Volume (MT) Analysis and Forecast By Method, 2023 to 2033

        7.3.1. Batch-wise

        7.3.2. Continuous

    7.4. Y-o-Y Growth Trend Analysis By Method, 2017 to 2022

    7.5. Absolute $ Opportunity Analysis By Method, 2023 to 2033

8. Global Market Analysis 2017 to 2022 and Forecast 2023 to 2033, By Capacity

    8.1. Introduction / Key Findings

    8.2. Historical Market Size Value (US$ Million) & Volume (MT) Analysis By Capacity, 2017 to 2022

    8.3. Current and Future Market Size Value (US$ Million) & Volume (MT) Analysis and Forecast By Capacity, 2023 to 2033

        8.3.1. Less than 10,000 l/h

        8.3.2. Between 10,000-40,000 l/h

        8.3.3. More than 40,000 l/h

    8.4. Y-o-Y Growth Trend Analysis By Capacity, 2017 to 2022

    8.5. Absolute $ Opportunity Analysis By Capacity, 2023 to 2033

9. Global Market Analysis 2017 to 2022 and Forecast 2023 to 2033, By Region

    9.1. Introduction

    9.2. Historical Market Size Value (US$ Million) & Volume (MT) Analysis By Region, 2017 to 2022

    9.3. Current Market Size Value (US$ Million) & Volume (MT) Analysis and Forecast By Region, 2023 to 2033

        9.3.1. North America

        9.3.2. Latin America

        9.3.3. Europe

        9.3.4. East Asia

        9.3.5. South Asia

        9.3.6. Oceania

        9.3.7. Middle East and Africa (MEA)

    9.4. Market Attractiveness Analysis By Region

10. North America Market Analysis 2017 to 2022 and Forecast 2023 to 2033, By Country

    10.1. Historical Market Size Value (US$ Million) & Volume (MT) Trend Analysis By Market Taxonomy, 2017 to 2022

    10.2. Market Size Value (US$ Million) & Volume (MT) Forecast By Market Taxonomy, 2023 to 2033

        10.2.1. By Country

            10.2.1.1. United States of America

            10.2.1.2. Canada

        10.2.2. By Product Type

        10.2.3. By Technique

        10.2.4. By Method

        10.2.5. By Capacity

    10.3. Market Attractiveness Analysis

        10.3.1. By Country

        10.3.2. By Product Type

        10.3.3. By Technique

        10.3.4. By Method

        10.3.5. By Capacity

    10.4. Key Takeaways

11. Latin America Market Analysis 2017 to 2022 and Forecast 2023 to 2033, By Country

    11.1. Historical Market Size Value (US$ Million) & Volume (MT) Trend Analysis By Market Taxonomy, 2017 to 2022

    11.2. Market Size Value (US$ Million) & Volume (MT) Forecast By Market Taxonomy, 2023 to 2033

        11.2.1. By Country

            11.2.1.1. Brazil

            11.2.1.2. Mexico

            11.2.1.3. Argentina

            11.2.1.4. Chile

            11.2.1.5. Peru

            11.2.1.6. Rest of Latin America

        11.2.2. By Product Type

        11.2.3. By Technique

        11.2.4. By Method

        11.2.5. By Capacity

    11.3. Market Attractiveness Analysis

        11.3.1. By Country

        11.3.2. By Product Type

        11.3.3. By Technique

        11.3.4. By Method

        11.3.5. By Capacity

    11.4. Key Takeaways

12. Europe Market Analysis 2017 to 2022 and Forecast 2023 to 2033, By Country

    12.1. Historical Market Size Value (US$ Million) & Volume (MT) Trend Analysis By Market Taxonomy, 2017 to 2022

    12.2. Market Size Value (US$ Million) & Volume (MT) Forecast By Market Taxonomy, 2023 to 2033

        12.2.1. By Country

            12.2.1.1. Germany

            12.2.1.2. Italy

            12.2.1.3. France

            12.2.1.4. United Kingdom

            12.2.1.5. Spain

            12.2.1.6. Russia

            12.2.1.7. BENELUX

            12.2.1.8. Poland

            12.2.1.9. Nordic Countries

            12.2.1.10. Rest of Europe

        12.2.2. By Product Type

        12.2.3. By Technique

        12.2.4. By Method

        12.2.5. By Capacity

    12.3. Market Attractiveness Analysis

        12.3.1. By Country

        12.3.2. By Product Type

        12.3.3. By Technique

        12.3.4. By Method

        12.3.5. By Capacity

    12.4. Key Takeaways

13. East Asia Market Analysis 2017 to 2022 and Forecast 2023 to 2033, By Country

    13.1. Historical Market Size Value (US$ Million) & Volume (MT) Trend Analysis By Market Taxonomy, 2017 to 2022

    13.2. Market Size Value (US$ Million) & Volume (MT) Forecast By Market Taxonomy, 2023 to 2033

        13.2.1. By Country

            13.2.1.1. China

            13.2.1.2. Japan

            13.2.1.3. South Korea

        13.2.2. By Product Type

        13.2.3. By Technique

        13.2.4. By Method

        13.2.5. By Capacity

    13.3. Market Attractiveness Analysis

        13.3.1. By Country

        13.3.2. By Product Type

        13.3.3. By Technique

        13.3.4. By Method

        13.3.5. By Capacity

    13.4. Key Takeaways

14. South Asia Market Analysis 2017 to 2022 and Forecast 2023 to 2033, By Country

    14.1. Historical Market Size Value (US$ Million) & Volume (MT) Trend Analysis By Market Taxonomy, 2017 to 2022

    14.2. Market Size Value (US$ Million) & Volume (MT) Forecast By Market Taxonomy, 2023 to 2033

        14.2.1. By Country

            14.2.1.1. India

            14.2.1.2. Thailand

            14.2.1.3. Malaysia

            14.2.1.4. Indonesia

            14.2.1.5. Rest of South Asia

        14.2.2. By Product Type

        14.2.3. By Technique

        14.2.4. By Method

        14.2.5. By Capacity

    14.3. Market Attractiveness Analysis

        14.3.1. By Country

        14.3.2. By Product Type

        14.3.3. By Technique

        14.3.4. By Method

        14.3.5. By Capacity

    14.4. Key Takeaways

15. Oceania Market Analysis 2017 to 2022 and Forecast 2023 to 2033, By Country

    15.1. Historical Market Size Value (US$ Million) & Volume (MT) Trend Analysis By Market Taxonomy, 2017 to 2022

    15.2. Market Size Value (US$ Million) & Volume (MT) Forecast By Market Taxonomy, 2023 to 2033

        15.2.1. By Country

            15.2.1.1. Australia

            15.2.1.2. New Zealand

        15.2.2. By Product Type

        15.2.3. By Technique

        15.2.4. By Method

        15.2.5. By Capacity

    15.3. Market Attractiveness Analysis

        15.3.1. By Country

        15.3.2. By Product Type

        15.3.3. By Technique

        15.3.4. By Method

        15.3.5. By Capacity

    15.4. Key Takeaways

16. MEA Market Analysis 2017 to 2022 and Forecast 2023 to 2033, By Country

    16.1. Historical Market Size Value (US$ Million) & Volume (MT) Trend Analysis By Market Taxonomy, 2017 to 2022

    16.2. Market Size Value (US$ Million) & Volume (MT) Forecast By Market Taxonomy, 2023 to 2033

        16.2.1. By Country

            16.2.1.1. GCC Countries

            16.2.1.2. South Africa

            16.2.1.3. Central Africa

            16.2.1.4. North Africa

        16.2.2. By Product Type

        16.2.3. By Technique

        16.2.4. By Method

        16.2.5. By Capacity

    16.3. Market Attractiveness Analysis

        16.3.1. By Country

        16.3.2. By Product Type

        16.3.3. By Technique

        16.3.4. By Method

        16.3.5. By Capacity

    16.4. Key Takeaways

17. Key Countries Market Analysis

    17.1. United States of America

        17.1.1. Pricing Analysis

        17.1.2. Market Share Analysis, 2022

            17.1.2.1. By Product Type

            17.1.2.2. By Technique

            17.1.2.3. By Method

            17.1.2.4. By Capacity

    17.2. Canada

        17.2.1. Pricing Analysis

        17.2.2. Market Share Analysis, 2022

            17.2.2.1. By Product Type

            17.2.2.2. By Technique

            17.2.2.3. By Method

            17.2.2.4. By Capacity

    17.3. Brazil

        17.3.1. Pricing Analysis

        17.3.2. Market Share Analysis, 2022

            17.3.2.1. By Product Type

            17.3.2.2. By Technique

            17.3.2.3. By Method

            17.3.2.4. By Capacity

    17.4. Mexico

        17.4.1. Pricing Analysis

        17.4.2. Market Share Analysis, 2022

            17.4.2.1. By Product Type

            17.4.2.2. By Technique

            17.4.2.3. By Method

            17.4.2.4. By Capacity

    17.5. Argentina

        17.5.1. Pricing Analysis

        17.5.2. Market Share Analysis, 2022

            17.5.2.1. By Product Type

            17.5.2.2. By Technique

            17.5.2.3. By Method

            17.5.2.4. By Capacity

    17.6. Chile

        17.6.1. Pricing Analysis

        17.6.2. Market Share Analysis, 2022

            17.6.2.1. By Product Type

            17.6.2.2. By Technique

            17.6.2.3. By Method

            17.6.2.4. By Capacity

    17.7. Peru

        17.7.1. Pricing Analysis

        17.7.2. Market Share Analysis, 2022

            17.7.2.1. By Product Type

            17.7.2.2. By Technique

            17.7.2.3. By Method

            17.7.2.4. By Capacity

    17.8. Germany

        17.8.1. Pricing Analysis

        17.8.2. Market Share Analysis, 2022

            17.8.2.1. By Product Type

            17.8.2.2. By Technique

            17.8.2.3. By Method

            17.8.2.4. By Capacity

    17.9. Italy

        17.9.1. Pricing Analysis

        17.9.2. Market Share Analysis, 2022

            17.9.2.1. By Product Type

            17.9.2.2. By Technique

            17.9.2.3. By Method

            17.9.2.4. By Capacity

    17.10. France

        17.10.1. Pricing Analysis

        17.10.2. Market Share Analysis, 2022

            17.10.2.1. By Product Type

            17.10.2.2. By Technique

            17.10.2.3. By Method

            17.10.2.4. By Capacity

    17.11. Spain

        17.11.1. Pricing Analysis

        17.11.2. Market Share Analysis, 2022

            17.11.2.1. By Product Type

            17.11.2.2. By Technique

            17.11.2.3. By Method

            17.11.2.4. By Capacity

    17.12.United Kingdom

        17.12.1. Pricing Analysis

        17.12.2. Market Share Analysis, 2022

            17.12.2.1. By Product Type

            17.12.2.2. By Technique

            17.12.2.3. By Method

            17.12.2.4. By Capacity

    17.13. Russia

        17.13.1. Pricing Analysis

        17.13.2. Market Share Analysis, 2022

            17.13.2.1. By Product Type

            17.13.2.2. By Technique

            17.13.2.3. By Method

            17.13.2.4. By Capacity

    17.14. Poland

        17.14.1. Pricing Analysis

        17.14.2. Market Share Analysis, 2022

            17.14.2.1. By Product Type

            17.14.2.2. By Technique

            17.14.2.3. By Method

            17.14.2.4. By Capacity

    17.15. BENELUX

        17.15.1. Pricing Analysis

        17.15.2. Market Share Analysis, 2022

            17.15.2.1. By Product Type

            17.15.2.2. By Technique

            17.15.2.3. By Method

            17.15.2.4. By Capacity

    17.16. Nordic Countries

        17.16.1. Pricing Analysis

        17.16.2. Market Share Analysis, 2022

            17.16.2.1. By Product Type

            17.16.2.2. By Technique

            17.16.2.3. By Method

            17.16.2.4. By Capacity

    17.17. China

        17.17.1. Pricing Analysis

        17.17.2. Market Share Analysis, 2022

            17.17.2.1. By Product Type

            17.17.2.2. By Technique

            17.17.2.3. By Method

            17.17.2.4. By Capacity

    17.18. Japan

        17.18.1. Pricing Analysis

        17.18.2. Market Share Analysis, 2022

            17.18.2.1. By Product Type

            17.18.2.2. By Technique

            17.18.2.3. By Method

            17.18.2.4. By Capacity

    17.19. South Korea

        17.19.1. Pricing Analysis

        17.19.2. Market Share Analysis, 2022

            17.19.2.1. By Product Type

            17.19.2.2. By Technique

            17.19.2.3. By Method

            17.19.2.4. By Capacity

    17.20. India

        17.20.1. Pricing Analysis

        17.20.2. Market Share Analysis, 2022

            17.20.2.1. By Product Type

            17.20.2.2. By Technique

            17.20.2.3. By Method

            17.20.2.4. By Capacity

    17.21. Thailand

        17.21.1. Pricing Analysis

        17.21.2. Market Share Analysis, 2022

            17.21.2.1. By Product Type

            17.21.2.2. By Technique

            17.21.2.3. By Method

            17.21.2.4. By Capacity

    17.22. Indonesia

        17.22.1. Pricing Analysis

        17.22.2. Market Share Analysis, 2022

            17.22.2.1. By Product Type

            17.22.2.2. By Technique

            17.22.2.3. By Method

            17.22.2.4. By Capacity

    17.23. Malaysia

        17.23.1. Pricing Analysis

        17.23.2. Market Share Analysis, 2022

            17.23.2.1. By Product Type

            17.23.2.2. By Technique

            17.23.2.3. By Method

            17.23.2.4. By Capacity

    17.24. Singapore

        17.24.1. Pricing Analysis

        17.24.2. Market Share Analysis, 2022

            17.24.2.1. By Product Type

            17.24.2.2. By Technique

            17.24.2.3. By Method

            17.24.2.4. By Capacity

    17.25. GCC Countries

        17.25.1. Pricing Analysis

        17.25.2. Market Share Analysis, 2022

            17.25.2.1. By Product Type

            17.25.2.2. By Technique

            17.25.2.3. By Method

            17.25.2.4. By Capacity

    17.26. South Africa

        17.26.1. Pricing Analysis

        17.26.2. Market Share Analysis, 2022

            17.26.2.1. By Product Type

            17.26.2.2. By Technique

            17.26.2.3. By Method

            17.26.2.4. By Capacity

    17.27. Central Africa

        17.27.1. Pricing Analysis

        17.27.2. Market Share Analysis, 2022

            17.27.2.1. By Product Type

            17.27.2.2. By Technique

            17.27.2.3. By Method

            17.27.2.4. By Capacity

    17.28. North Africa

        17.28.1. Pricing Analysis

        17.28.2. Market Share Analysis, 2022

            17.28.2.1. By Product Type

            17.28.2.2. By Technique

            17.28.2.3. By Method

            17.28.2.4. By Capacity

18. Market Structure Analysis

    18.1. Competition Dashboard

    18.2. Competition Benchmarking

    18.3. Market Share Analysis of Top Players

        18.3.1. By Regional

        18.3.2. By Product Type

        18.3.3. By Technique

        18.3.4. By Method

        18.3.5. By Capacity

19. Competition Analysis

    19.1. Competition Deep Dive

        19.1.1. Dion Engineering

            19.1.1.1. Overview

            19.1.1.2. Product Portfolio

            19.1.1.3. Profitability by Market Segments

            19.1.1.4. Sales Footprint

            19.1.1.5. Strategy Overview

                19.1.1.5.1. Marketing Strategy

                19.1.1.5.2. Product Strategy

                19.1.1.5.3. Channel Strategy

        19.1.2. GEA Group

            19.1.2.1. Overview

            19.1.2.2. Product Portfolio

            19.1.2.3. Profitability by Market Segments

            19.1.2.4. Sales Footprint

            19.1.2.5. Strategy Overview

                19.1.2.5.1. Marketing Strategy

                19.1.2.5.2. Product Strategy

                19.1.2.5.3. Channel Strategy

        19.1.3. Krones

            19.1.3.1. Overview

            19.1.3.2. Product Portfolio

            19.1.3.3. Profitability by Market Segments

            19.1.3.4. Sales Footprint

            19.1.3.5. Strategy Overview

                19.1.3.5.1. Marketing Strategy

                19.1.3.5.2. Product Strategy

                19.1.3.5.3. Channel Strategy

        19.1.4. SPX Flow (APV)

            19.1.4.1. Overview

            19.1.4.2. Product Portfolio

            19.1.4.3. Profitability by Market Segments

            19.1.4.4. Sales Footprint

            19.1.4.5. Strategy Overview

                19.1.4.5.1. Marketing Strategy

                19.1.4.5.2. Product Strategy

                19.1.4.5.3. Channel Strategy

        19.1.5. Tetra Pak International

            19.1.5.1. Overview

            19.1.5.2. Product Portfolio

            19.1.5.3. Profitability by Market Segments

            19.1.5.4. Sales Footprint

            19.1.5.5. Strategy Overview

                19.1.5.5.1. Marketing Strategy

                19.1.5.5.2. Product Strategy

                19.1.5.5.3. Channel Strategy

        19.1.6. ABL Technology

            19.1.6.1. Overview

            19.1.6.2. Product Portfolio

            19.1.6.3. Profitability by Market Segments

            19.1.6.4. Sales Footprint

            19.1.6.5. Strategy Overview

                19.1.6.5.1. Marketing Strategy

                19.1.6.5.2. Product Strategy

                19.1.6.5.3. Channel Strategy

        19.1.7. Della Toffola

            19.1.7.1. Overview

            19.1.7.2. Product Portfolio

            19.1.7.3. Profitability by Market Segments

            19.1.7.4. Sales Footprint

            19.1.7.5. Strategy Overview

                19.1.7.5.1. Marketing Strategy

                19.1.7.5.2. Product Strategy

                19.1.7.5.3. Channel Strategy

        19.1.8. INOXPA

            19.1.8.1. Overview

            19.1.8.2. Product Portfolio

            19.1.8.3. Profitability by Market Segments

            19.1.8.4. Sales Footprint

            19.1.8.5. Strategy Overview

                19.1.8.5.1. Marketing Strategy

                19.1.8.5.2. Product Strategy

                19.1.8.5.3. Channel Strategy

        19.1.9. KHS

            19.1.9.1. Overview

            19.1.9.2. Product Portfolio

            19.1.9.3. Profitability by Market Segments

            19.1.9.4. Sales Footprint

            19.1.9.5. Strategy Overview

                19.1.9.5.1. Marketing Strategy

                19.1.9.5.2. Product Strategy

                19.1.9.5.3. Channel Strategy

        19.1.10. SEPAK Industries.

            19.1.10.1. Overview

            19.1.10.2. Product Portfolio

            19.1.10.3. Profitability by Market Segments

            19.1.10.4. Sales Footprint

            19.1.10.5. Strategy Overview

                19.1.10.5.1. Marketing Strategy

                19.1.10.5.2. Product Strategy

                19.1.10.5.3. Channel Strategy

        19.1.11. REDA S.P.A.

            19.1.11.1. Overview

            19.1.11.2. Product Portfolio

            19.1.11.3. Profitability by Market Segments

            19.1.11.4. Sales Footprint

            19.1.11.5. Strategy Overview

                19.1.11.5.1. Marketing Strategy

                19.1.11.5.2. Product Strategy

                19.1.11.5.3. Channel Strategy

        19.1.12. Shanghai Jimei Food Machinery

            19.1.12.1. Overview

            19.1.12.2. Product Portfolio

            19.1.12.3. Profitability by Market Segments

            19.1.12.4. Sales Footprint

            19.1.12.5. Strategy Overview

                19.1.12.5.1. Marketing Strategy

                19.1.12.5.2. Product Strategy

                19.1.12.5.3. Channel Strategy

        19.1.13. TESSA I.E.C Group

            19.1.13.1. Overview

            19.1.13.2. Product Portfolio

            19.1.13.3. Profitability by Market Segments

            19.1.13.4. Sales Footprint

            19.1.13.5. Strategy Overview

                19.1.13.5.1. Marketing Strategy

                19.1.13.5.2. Product Strategy

                19.1.13.5.3. Channel Strategy

        19.1.14. Stephan Machinery Gmbh

            19.1.14.1. Overview

            19.1.14.2. Product Portfolio

            19.1.14.3. Profitability by Market Segments

            19.1.14.4. Sales Footprint

            19.1.14.5. Strategy Overview

                19.1.14.5.1. Marketing Strategy

                19.1.14.5.2. Product Strategy

                19.1.14.5.3. Channel Strategy

        19.1.15. GOMA Engineering

            19.1.15.1. Overview

            19.1.15.2. Product Portfolio

            19.1.15.3. Profitability by Market Segments

            19.1.15.4. Sales Footprint

            19.1.15.5. Strategy Overview

                19.1.15.5.1. Marketing Strategy

                19.1.15.5.2. Product Strategy

                19.1.15.5.3. Channel Strategy

        19.1.16. Nanjing Prosky Food Machinery Manufacturing Co. Ltd

            19.1.16.1. Overview

            19.1.16.2. Product Portfolio

            19.1.16.3. Profitability by Market Segments

            19.1.16.4. Sales Footprint

            19.1.16.5. Strategy Overview

                19.1.16.5.1. Marketing Strategy

                19.1.16.5.2. Product Strategy

                19.1.16.5.3. Channel Strategy

        19.1.17. JBT 

            19.1.17.1. Overview

            19.1.17.2. Product Portfolio

            19.1.17.3. Profitability by Market Segments

            19.1.17.4. Sales Footprint

            19.1.17.5. Strategy Overview

                19.1.17.5.1. Marketing Strategy

                19.1.17.5.2. Product Strategy

                19.1.17.5.3. Channel Strategy

        19.1.18. Neologic Engineers Private Ltd.

            19.1.18.1. Overview

            19.1.18.2. Product Portfolio

            19.1.18.3. Profitability by Market Segments

            19.1.18.4. Sales Footprint

            19.1.18.5. Strategy Overview

                19.1.18.5.1. Marketing Strategy

                19.1.18.5.2. Product Strategy

                19.1.18.5.3. Channel Strategy

        19.1.19. M&E Trading Gmbh & Co KG

            19.1.19.1. Overview

            19.1.19.2. Product Portfolio

            19.1.19.3. Profitability by Market Segments

            19.1.19.4. Sales Footprint

            19.1.19.5. Strategy Overview

                19.1.19.5.1. Marketing Strategy

                19.1.19.5.2. Product Strategy

                19.1.19.5.3. Channel Strategy

        19.1.20. Iwai Kikai Kogyo Co. Ltd

            19.1.20.1. Overview

            19.1.20.2. Product Portfolio

            19.1.20.3. Profitability by Market Segments

            19.1.20.4. Sales Footprint

            19.1.20.5. Strategy Overview

                19.1.20.5.1. Marketing Strategy

                19.1.20.5.2. Product Strategy

                19.1.20.5.3. Channel Strategy

        19.1.21. Others ( On Additional Request)

20. Assumptions & Acronyms Used

21. Research Methodology

Explore Process Automation Insights

View Reports
Future Market Insights

Milk Pasteurization Machines Market