Reports

- Global Locations -

Headquarters

Future Market Insights, Inc.

Christiana Corporate, 200
Continental Drive, Suite 401,
Newark, Delaware - 19713,
United States

T: +1-845-579-5705

Americas

Future Market Insights, Inc.

616 Corporate Way, Suite 2-9018,
Valley Cottage, NY 10989, United States

T: +1-347-918-3531

MEA

Future Market Insights

1602-6 Jumeirah Bay X2 Tower, Plot No: JLT-PH2-X2A,
Jumeirah Lakes Towers, Dubai,
United Arab Emirates

Europe

Future Market Insights

3rd Floor, 207 Regent Street,
W1B 3HH London
United Kingdom

T: + 44 (0) 20 8123 9659
D: +44 (0) 20 3287 4268

Asia Pacific

Future Market Insights

IndiaLand Global Tech Park, Unit UG-1, Behind Grand HighStreet, Phase 1, Hinjawadi, MH, Pune – 411057, India

Milking Automation Market Outlook

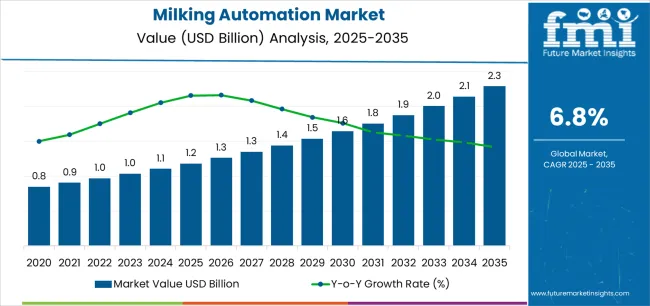
The global milking automation market is projected to be valued at US$ 1.1 billion by 2024 and rise to US$ 2.2 billion by 2034. It is expected to grow at a CAGR of 7.2 % during the forecast period.

Key Market Drivers

  • Agriculture is facing a shortage of skilled labor, driving the adoption of milking automation technologies to reduce dependency on manual labor and improve operational efficiency.
  • Continuous advancements in robotics, sensors, and data analytics, milking automation systems have become more sophisticated, enhancing milking efficiency, cow health monitoring, and data management.
  • Increasing global demand for dairy products is fueling the expansion of dairy farms.
  • Milking automation enables dairy farmers to scale production to meet growing demand efficiently.
  • Milking automation systems prioritize animal welfare by providing gentle and consistent milking procedures, which is becoming increasingly important as consumers and regulators prioritize animal welfare standards.
  • Milking automation offers cost-saving benefits in the long run by reducing labor expenses, minimizing milk wastage, optimizing milking processes, and driving the adoption of automation technologies.
  • Automated milking systems collect and analyze data on milk production, cow health, and milking efficiency in real-time, empowering farmers to make informed decisions regarding herd management, breeding programs, and milk quality.
  • Government initiatives, subsidies, and grants encourage dairy farmers to adopt milking automation technologies to modernize agriculture and improve productivity.
  • Milking automation systems are also helping farms align with sustainability goals and mitigate environmental impact by optimizing resource usage, reducing carbon footprint, and minimizing waste generation.
Attributes Key Statistics
Expected Base Year Value (2024) US$ 1.1 billion
Anticipated Forecast Value (2034) US$ 2.2 billion
Estimated Growth (2024 to 2034) 7.2 % CAGR

Don't pay for what you don't need

Customize your report by selecting specific countries or regions and save 30%!

Consumption Analysis of the Milking Automation Market

  • Global demand for dairy products is rising; dairy farmers are seeking ways to increase productivity and efficiency in milk production. Milking automation systems can address this challenge by simplifying the milking process, reducing labor needs, and increasing milk yield per cow.
  • Milking automation systems with advanced robotics, sensors, and data analytics align with this preference by providing precise and gentle milking procedures.
  • The sales of milking automation equipment are steadily rising as dairy farmers recognize the long-term benefits of automating their operations.
  • Milking automation technologies are being adopted at an accelerated rate worldwide as dairy farms embrace automation to stay competitive and meet consumer demand. Farms of all sizes, from small-scale operations to large commercial dairies, invest in automation solutions to improve efficiency, profitability, and herd management.
  • Milking automation systems are gaining popularity among dairy farmers due to their ability to streamline operations, improve milk quality, and enhance animal welfare. These systems' convenience, reliability, and performance contribute to their widespread adoption in the dairy industry.
  • Milking automation systems can also address environmental concerns by reducing greenhouse gas emissions and improving energy efficiency. This makes automation an attractive option for dairy farmers looking to reduce their carbon footprint and operate more sustainably.

Restraining Factors Adversely Affecting the Milking Automation Market

  • High initial investment can prevent smaller dairy farms from adopting automation technology.
  • Integrating milking automation systems can be complex and time-consuming.
  • Technical challenges such as equipment malfunctions and software glitches can reduce the system's reliability.
  • Regular maintenance and technical support are required for optimal performance and reliability.
  • Concerns about data security can hinder the adoption of automation technology.
  • Compliance with food safety, animal welfare, and environmental protection regulations can pose challenges.
  • Resistance to change and addressing farmer skepticism can hinder widespread adoption.
  • Modifications to infrastructure may be required, such as barn layouts and milking parlors.
  • Access to skilled technicians and spare parts can be challenging in rural areas or regions with limited infrastructure.
Nandini Roy Choudhury

Principal Consultant

Talk to Analyst

Find your sweet spots for generating winning opportunities in this market.

Comparative View of Adjacent Industries

Future Market Insights has comprehensively studied the global milking industry and developed two markets that have the potential to compete rigorously with it- the cow milking machine market and the milking equipment market. The growth rates and current market valuation are mentioned in the table below. The respective markets' growth factors and critical challenges are also discussed below.

Milking Automation Market:

Attributes Milking Automation Market
CAGR (2024 to 2034) 7.2%
Market Value (2034) US$ 2.2 billion
Growth Factor Demand for enhanced efficiency, productivity, and animal welfare in dairy farming operations
Key Challenges Complexity of integration, high initial investment costs, and technical reliability concerns

Cow Milking Machine Market:

Attributes Cow Milking Machine Market
CAGR (2023 to 2033) 8.4 %
Market Value (2022) US$ 1,989 million
Growth Factor Need for automation
Key Challenges
  • Greater initial cost of the cow milking machine
  • Dearth of competent labor to operate the devices

Milking Equipment Market:

Attributes Milking Equipment Market
CAGR (2023 to 2033) 8.0%
Market Value (2033) US$ 7 billion
Growth Factor Rising rural dairy production facilities
Key Challenges High maintenance cost of milking equipment

Category-wise Insights

Hardware is a Top Global Milking Automation Market Offering Reliability and Efficiency

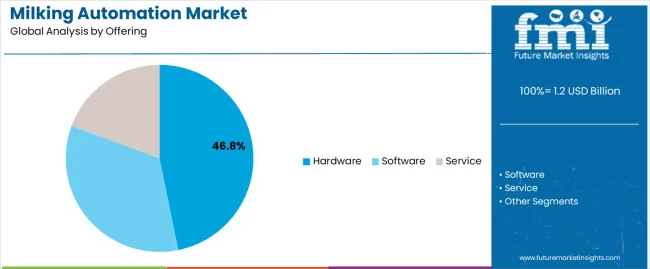
Hardware drives the global market with a robust CAGR of 7.0% through 2034.

Attributes Details
Offering Hardware
CAGR ( 2024 to 2034) 7.0%

This rising popularity is attributed to:

  • Hardware, including robotic milking systems, sensors, actuators, and parlors, is critical in automating milking operations within dairy farms.
  • Hardware solutions are designed to optimize milking efficiency, monitor milk yield and quality, and maintain cow comfort.
  • Rising need for reliable hardware solutions that can streamline milking operations and enhance overall farm profitability with increasing demand for dairy products and the growing emphasis on efficiency and productivity in dairy farming.
  • Manufacturers invest in research and development to develop innovative hardware solutions that address the specific needs and challenges dairy farmers face worldwide.
  • Hardware offerings in the milking automation market continuously evolve to incorporate advanced technologies and features that improve performance, reliability, and user experience.

Small Farms Dominate due to Affordability, Scalability, and Ease of Integration of Automation

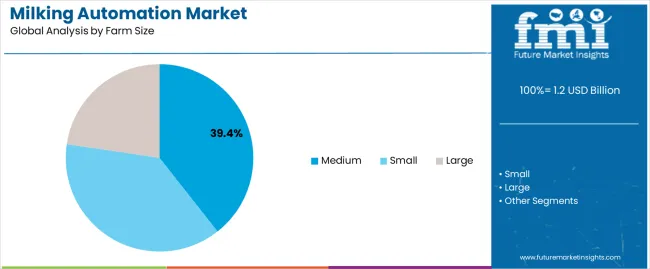
Based on farm size, small farms are subject to the global milking automation market, with a 6.8% CAGR from 2024 to 2034.

Attributes Details
Farm Size Small
CAGR ( 2024 to 2034) 6.8%

This rising popularity is attributed to:

  • Milking automation technology has become more accessible and affordable for small dairy farms due to advancements in the field.
  • Automated milking systems are now available in modular and scalable configurations, which allow farmers to customize solutions according to the size of their herds and budget constraints.
  • Small farms are more agile and adaptable to change than larger commercial operations, making them well-positioned to take advantage of the benefits of milking automation.
  • Milking automation offers increased efficiency, improved milk quality, and better herd management, which is particularly attractive to small farms facing labor shortages and rising labor costs.
  • Milking automation is a cost-effective solution for small farms looking to maintain their competitiveness in the market.

Get the data you need at a Fraction of the cost

Personalize your report by choosing insights you need
and save 40%!

Country-wise Insights

The section analyzes the global milking automation market by country, including the United Kingdom, the United States, China, South Korea, and Japan. The table presents the CAGR for each country, indicating the expected market growth through 2034.

Countries CAGR
South Korea 9.7%
The United Kingdom 8.1%
China 8.0%
Japan 7.7%
The United States 7.5%

South Korea's Advanced Agriculture and Labor Efficiency Needs Drive Milking Automation Growth

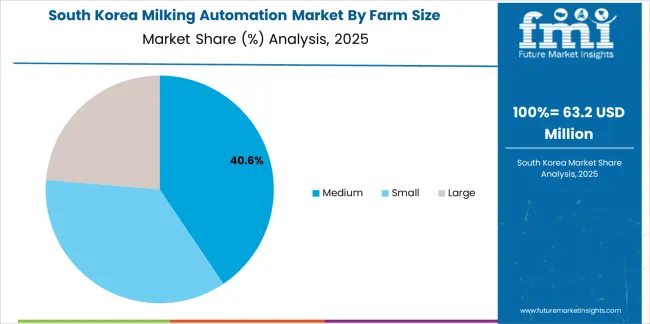
South Korea is emerging as a global player and maintains its top position in the milking automation market, with a CAGR of 9.7% from 2024 to 2034.

South Korea's advanced agricultural sector and high-tech farming practices drive growth in the Milking Automation Market. Focusing on precision farming and sustainable agriculture, South Korean dairy farmers are embracing milking automation technologies to optimize milk production, enhance animal welfare, and reduce labor dependency. Government support for agricultural innovation and technology adoption further incentivizes the deployment of milking robots across the country.

The United Kingdom Milking Automation Market Grows Due to Efficiency Focus and Government Support

The United Kingdom is becoming a prominent global milking automation market player. With a CAGR of 8.1% projected through 2034, it is maintaining a steady pace of growth.

Efficiency and productivity are the buzzwords in the United Kingdom's dairy farming sector, and the milking automation market is experiencing growth as dairy farmers adopt technological innovation and precision agriculture.

The focus is on streamlining operations and optimizing milk production, and milking automation systems are helping farmers achieve these goals. The United Kingdom government's support for modernizing agricultural practices and improving farm profitability further incentivizes the nationwide adoption of milking automation technologies.

Increasing Urbanization, Dietary Shifts, and Dairy Sector Expansion Drive Growth

China is emerging as a global player in the milking automation market with a CAGR of 8.0% from 2024 to 2034.

As China's dairy industry seeks to modernize and scale up production to meet rising consumer demand, the Milking Automation Market is experiencing a surge in demand in China. Chinese dairy farmers are investing in milking automation systems to boost efficiency, milk yield, and product quality. Government initiatives promoting agricultural mechanization and improving food safety standards are driving the adoption of milking robots across China.
In Japan, Aging Farming Population and Labor Shortages Drive Milking Automation Market Growth

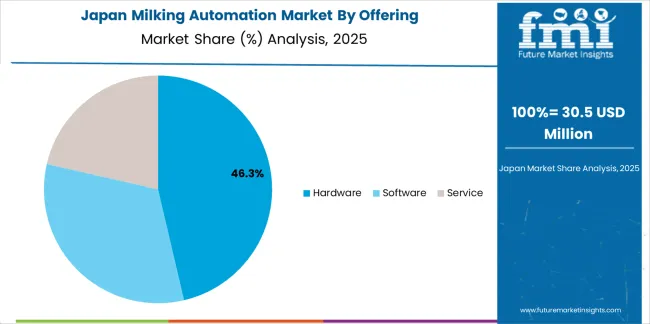
Japan maintains its position in the global milking automation market, projecting a steady growth rate with a CAGR of 7.7%, which is expected to continue through 2034.

The Milking Automation Market is gaining traction in Japan as dairy farmers seek to address labor shortages and improve farm productivity. Japanese dairy farms use milking automation systems to streamline operations, minimize labor requirements, and ensure consistent milk quality. Initiatives to revitalize rural economies and promote the adoption of advanced agricultural technologies are driving the uptake of milking robots across Japan.

Rising Demand for Dairy Drives Milking Automation Growth in the United States

The United States is steadily emerging as a significant contender in the worldwide milking automation market, with a projected CAGR of 7.5% expected to persist until 2034.

Driven by the country's large-scale dairy farming industry and a growing demand for operational efficiency and labor savings, the milking automation market in the United States is witnessing significant growth. With a focus on farm mechanization and digitalization, United States dairy farmers are turning to milking automation solutions to enhance milk quality, reduce labor costs, and improve overall farm management.

Factors such as rising labor shortages, stricter regulations on labor practices, and a desire for greater flexibility in farm operations are accelerating the adoption of milking robots.
Competitive Landscape

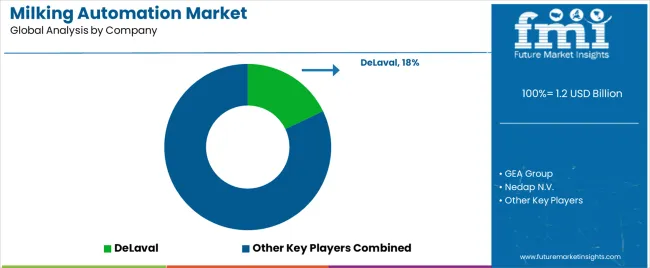
Major companies are investing in research and development, technological innovation, and market expansion initiatives to enhance their product offerings and meet the evolving needs of dairy farmers worldwide. For example, they are developing advanced milking robots with cutting-edge sensors, artificial intelligence, and data analytics capabilities to improve milk quality, increase milking efficiency, and enhance animal welfare.

Manufacturers are focusing on expanding their presence in key geographic regions with significant growth potential, such as emerging markets in Asia-Pacific and Latin America, through partnerships, acquisitions, and distribution agreements.

Major players collaborate with industry stakeholders, including dairy associations, research institutions, and government agencies, to promote the benefits of milking automation and address regulatory and technical challenges.

They are participating in industry forums, workshops, and conferences to raise awareness about the advantages of automation in dairy farming and provide training and support to dairy farmers for the successful implementation of milking automation systems. They are investing in customer service, technical support, and after-sales maintenance to ensure the reliability and performance of their milking automation solutions.

Recent Developments

  • On December 8, 2021, Dutch-based startup Connecterra, known for utilizing artificial intelligence to provide insights to farmers. Lely, a robotics and management systems supplier for dairy farming, announced a strategic partnership focused on co-development and commercial collaboration.
  • On June 7, 2021, MSD Animal Health, a division of Merck & Co., Inc., Kenilworth, N.J., USA (NYSE: MRK), announced its acquisition of the assets of LIC Automation Ltd. (“LICA”) from New Zealand-based, farmer-owned cooperative Livestock Improvement Corporation Ltd. (“LIC”). LICA, a dairy industry automation and technology leader, was acquired with undisclosed terms.
  • According to a recent study, North America represented 26% of the milking automation market in 2021. The study analyzed the milking automation market in the US, Canada, and Mexico, where numerous farms have already installed milking automation systems to enhance milk production.

Key Companies in the Market

  • DeLaval
  • GEA Group
  • Nedap N.V.
  • Allflex Livestock Intelligence
  • Afimilk Ltd.
  • Beco Dairy Automation Inc.
  • Boumatic
  • Dairymaster
  • Waikato Milking Systems

Key Coverage in the Milking Automation Market Report

  • How big is the robotic milking market
  • Top 7 Trends In Dairy Automation
  • Market Analysis of the Milking automation market in India and Colombia Milking Automation Market
  • Insights into the Agricultural Milking Robots Market
  • Marketing Strategies in Advanced Milking Solutions
  • Assessing the Pros and Cons of Implementing Dairy Automation
  • Key Acquisitions and Mergers In The Milking Automation Market

Market Segmentation

By Offering:

  • Hardware
    • Milk meters
    • Milking clusters
    • Milk point controllers
    • Pulsators
    • Smart feeding robots (TMR/PMR-based feeding robots)
    • Smart camera-based facial recognition systems (biometric IDs)
  • Software
    • Cloud-based
    • PC-based
  • Service
    • Maintenance and Support
    • Data Management and Analytic

By Farm Size:

  • Small
  • Medium
  • Large

By Species:

  • Dairy Cattle
  • Goat
  • Sheep

By Region:

  • North America
  • Latin America
  • Asia Pacific
  • Middle East and Africa (MEA)
  • Europe

Frequently Asked Questions

What is the Milking Automation Market Currently Worth?

The global milking automation market is predicted to be worth US$ 1.1 billion by 2024.

What is the Sales Forecast for the Milking Automation Market Through 2034?

The milking automation market is expected to reach US$ 2.2 billion by 2034.

At What Rate Is the Milking Automation Market Growing Globally?

The milking automation market is growing at a CAGR of 7.2% from 2024 to 2034.

Who are the Key Manufacturers of the Milking Automation?

DeLaval, GEA Group, Nedap N.V., Allflex Livestock Intelligence, and Afimilk Ltd. are among the major companies actively contributing to the growth of the global milking automation market.

What is the Top Farm Size in the Milking Automation Market?

The dominance of small-scale farms is projected to continue driving market growth, with an anticipated CAGR of 6.8% until 2034.

Table of Content

1. Executive Summary

    1.1. Global Market Outlook

    1.2. Demand-side Trends

    1.3. Supply-side Trends

    1.4. Technology Roadmap Analysis

    1.5. Analysis and Recommendations

2. Market Overview

    2.1. Market Coverage / Taxonomy

    2.2. Market Definition / Scope / Limitations

3. Market Background

    3.1. Market Dynamics

        3.1.1. Drivers

        3.1.2. Restraints

        3.1.3. Opportunity

        3.1.4. Trends

    3.2. Scenario Forecast

        3.2.1. Demand in Optimistic Scenario

        3.2.2. Demand in Likely Scenario

        3.2.3. Demand in Conservative Scenario

    3.3. Opportunity Map Analysis

    3.4. Product Life Cycle Analysis

    3.5. Supply Chain Analysis

        3.5.1. Supply Side Participants and their Roles

            3.5.1.1. Producers

            3.5.1.2. Mid-Level Participants (Traders/ Agents/ Brokers)

            3.5.1.3. Wholesalers and Distributors

        3.5.2. Value Added and Value Created at Node in the Supply Chain

        3.5.3. List of Raw Material Suppliers

        3.5.4. List of Existing and Potential Buyer’s

    3.6. Investment Feasibility Matrix

    3.7. Value Chain Analysis

        3.7.1. Profit Margin Analysis

        3.7.2. Wholesalers and Distributors

        3.7.3. Retailers

    3.8. PESTLE and Porter’s Analysis

    3.9. Regulatory Landscape

        3.9.1. By Key Regions

        3.9.2. By Key Countries

    3.10. Regional Parent Market Outlook

    3.11. Production and Consumption Statistics

    3.12. Import and Export Statistics

4. Global Market Analysis 2019 to 2023 and Forecast, 2024 to 2034

    4.1. Historical Market Size Value (US$ Million) & Volume (Units) Analysis, 2019 to 2023

    4.2. Current and Future Market Size Value (US$ Million) & Volume (Units) Projections, 2024 to 2034

        4.2.1. Y-o-Y Growth Trend Analysis

        4.2.2. Absolute $ Opportunity Analysis

5. Global Market Analysis 2019 to 2023 and Forecast 2024 to 2034, By Offering

    5.1. Introduction / Key Findings

    5.2. Historical Market Size Value (US$ Million) & Volume (Units) Analysis By Offering, 2019 to 2023

    5.3. Current and Future Market Size Value (US$ Million) & Volume (Units) Analysis and Forecast By Offering, 2024 to 2034

        5.3.1. Hardware

            5.3.1.1. Milk meters

            5.3.1.2. Milking clusters

            5.3.1.3. Milk point controllers

            5.3.1.4. Pulsators

            5.3.1.5. Smart feeding robots (TMR/PMR-based feeding robots)

            5.3.1.6. Smart camera-based facial recognition systems (biometric IDs)

        5.3.2. Software

            5.3.2.1. Cloud-based

            5.3.2.2. PC-based

        5.3.3. Services

            5.3.3.1. Maintenance and Suppor

            5.3.3.2. Data Management and Analytic

    5.4. Y-o-Y Growth Trend Analysis By Offering, 2019 to 2023

    5.5. Absolute $ Opportunity Analysis By Offering, 2024 to 2034

6. Global Market Analysis 2019 to 2023 and Forecast 2024 to 2034, By Farm Size

    6.1. Introduction / Key Findings

    6.2. Historical Market Size Value (US$ Million) & Volume (Units) Analysis By Farm Size, 2019 to 2023

    6.3. Current and Future Market Size Value (US$ Million) & Volume (Units) Analysis and Forecast By Farm Size, 2024 to 2034

        6.3.1. Small

        6.3.2. Medium

        6.3.3. Large

    6.4. Y-o-Y Growth Trend Analysis By Farm Size, 2019 to 2023

    6.5. Absolute $ Opportunity Analysis By Farm Size, 2024 to 2034

7. Global Market Analysis 2019 to 2023 and Forecast 2024 to 2034, By Species

    7.1. Introduction / Key Findings

    7.2. Historical Market Size Value (US$ Million) & Volume (Units) Analysis By Species, 2019 to 2023

    7.3. Current and Future Market Size Value (US$ Million) & Volume (Units) Analysis and Forecast By Species, 2024 to 2034

        7.3.1. Dairy Cattle

        7.3.2. Goat

        7.3.3. Sheep

    7.4. Y-o-Y Growth Trend Analysis By Species, 2019 to 2023

    7.5. Absolute $ Opportunity Analysis By Species, 2024 to 2034

8. Global Market Analysis 2019 to 2023 and Forecast 2024 to 2034, By Region

    8.1. Introduction

    8.2. Historical Market Size Value (US$ Million) & Volume (Units) Analysis By Region, 2019 to 2023

    8.3. Current Market Size Value (US$ Million) & Volume (Units) Analysis and Forecast By Region, 2024 to 2034

        8.3.1. North America

        8.3.2. Latin America

        8.3.3. Western Europe

        8.3.4. Eastern Europe

        8.3.5. South Asia and Pacific

        8.3.6. East Asia

        8.3.7. Middle East and Africa

    8.4. Market Attractiveness Analysis By Region

9. North America Market Analysis 2019 to 2023 and Forecast 2024 to 2034, By Country

    9.1. Historical Market Size Value (US$ Million) & Volume (Units) Trend Analysis By Market Taxonomy, 2019 to 2023

    9.2. Market Size Value (US$ Million) & Volume (Units) Forecast By Market Taxonomy, 2024 to 2034

        9.2.1. By Country

            9.2.1.1. USA

            9.2.1.2. Canada

        9.2.2. By Offering

        9.2.3. By Farm Size

        9.2.4. By Species

    9.3. Market Attractiveness Analysis

        9.3.1. By Country

        9.3.2. By Offering

        9.3.3. By Farm Size

        9.3.4. By Species

    9.4. Key Takeaways

10. Latin America Market Analysis 2019 to 2023 and Forecast 2024 to 2034, By Country

    10.1. Historical Market Size Value (US$ Million) & Volume (Units) Trend Analysis By Market Taxonomy, 2019 to 2023

    10.2. Market Size Value (US$ Million) & Volume (Units) Forecast By Market Taxonomy, 2024 to 2034

        10.2.1. By Country

            10.2.1.1. Brazil

            10.2.1.2. Mexico

            10.2.1.3. Rest of Latin America

        10.2.2. By Offering

        10.2.3. By Farm Size

        10.2.4. By Species

    10.3. Market Attractiveness Analysis

        10.3.1. By Country

        10.3.2. By Offering

        10.3.3. By Farm Size

        10.3.4. By Species

    10.4. Key Takeaways

11. Western Europe Market Analysis 2019 to 2023 and Forecast 2024 to 2034, By Country

    11.1. Historical Market Size Value (US$ Million) & Volume (Units) Trend Analysis By Market Taxonomy, 2019 to 2023

    11.2. Market Size Value (US$ Million) & Volume (Units) Forecast By Market Taxonomy, 2024 to 2034

        11.2.1. By Country

            11.2.1.1. Germany

            11.2.1.2. UK

            11.2.1.3. France

            11.2.1.4. Spain

            11.2.1.5. Italy

            11.2.1.6. Rest of Western Europe

        11.2.2. By Offering

        11.2.3. By Farm Size

        11.2.4. By Species

    11.3. Market Attractiveness Analysis

        11.3.1. By Country

        11.3.2. By Offering

        11.3.3. By Farm Size

        11.3.4. By Species

    11.4. Key Takeaways

12. Eastern Europe Market Analysis 2019 to 2023 and Forecast 2024 to 2034, By Country

    12.1. Historical Market Size Value (US$ Million) & Volume (Units) Trend Analysis By Market Taxonomy, 2019 to 2023

    12.2. Market Size Value (US$ Million) & Volume (Units) Forecast By Market Taxonomy, 2024 to 2034

        12.2.1. By Country

            12.2.1.1. Poland

            12.2.1.2. Russia

            12.2.1.3. Czech Republic

            12.2.1.4. Romania

            12.2.1.5. Rest of Eastern Europe

        12.2.2. By Offering

        12.2.3. By Farm Size

        12.2.4. By Species

    12.3. Market Attractiveness Analysis

        12.3.1. By Country

        12.3.2. By Offering

        12.3.3. By Farm Size

        12.3.4. By Species

    12.4. Key Takeaways

13. South Asia and Pacific Market Analysis 2019 to 2023 and Forecast 2024 to 2034, By Country

    13.1. Historical Market Size Value (US$ Million) & Volume (Units) Trend Analysis By Market Taxonomy, 2019 to 2023

    13.2. Market Size Value (US$ Million) & Volume (Units) Forecast By Market Taxonomy, 2024 to 2034

        13.2.1. By Country

            13.2.1.1. India

            13.2.1.2. Bangladesh

            13.2.1.3. Australia

            13.2.1.4. New Zealand

            13.2.1.5. Rest of South Asia and Pacific

        13.2.2. By Offering

        13.2.3. By Farm Size

        13.2.4. By Species

    13.3. Market Attractiveness Analysis

        13.3.1. By Country

        13.3.2. By Offering

        13.3.3. By Farm Size

        13.3.4. By Species

    13.4. Key Takeaways

14. East Asia Market Analysis 2019 to 2023 and Forecast 2024 to 2034, By Country

    14.1. Historical Market Size Value (US$ Million) & Volume (Units) Trend Analysis By Market Taxonomy, 2019 to 2023

    14.2. Market Size Value (US$ Million) & Volume (Units) Forecast By Market Taxonomy, 2024 to 2034

        14.2.1. By Country

            14.2.1.1. China

            14.2.1.2. Japan

            14.2.1.3. South Korea

        14.2.2. By Offering

        14.2.3. By Farm Size

        14.2.4. By Species

    14.3. Market Attractiveness Analysis

        14.3.1. By Country

        14.3.2. By Offering

        14.3.3. By Farm Size

        14.3.4. By Species

    14.4. Key Takeaways

15. Middle East and Africa Market Analysis 2019 to 2023 and Forecast 2024 to 2034, By Country

    15.1. Historical Market Size Value (US$ Million) & Volume (Units) Trend Analysis By Market Taxonomy, 2019 to 2023

    15.2. Market Size Value (US$ Million) & Volume (Units) Forecast By Market Taxonomy, 2024 to 2034

        15.2.1. By Country

            15.2.1.1. GCC Countries

            15.2.1.2. South Africa

            15.2.1.3. Israel

            15.2.1.4. Rest of MEA

        15.2.2. By Offering

        15.2.3. By Farm Size

        15.2.4. By Species

    15.3. Market Attractiveness Analysis

        15.3.1. By Country

        15.3.2. By Offering

        15.3.3. By Farm Size

        15.3.4. By Species

    15.4. Key Takeaways

16. Key Countries Market Analysis

    16.1. USA

        16.1.1. Pricing Analysis

        16.1.2. Market Share Analysis, 2023

            16.1.2.1. By Offering

            16.1.2.2. By Farm Size

            16.1.2.3. By Species

    16.2. Canada

        16.2.1. Pricing Analysis

        16.2.2. Market Share Analysis, 2023

            16.2.2.1. By Offering

            16.2.2.2. By Farm Size

            16.2.2.3. By Species

    16.3. Brazil

        16.3.1. Pricing Analysis

        16.3.2. Market Share Analysis, 2023

            16.3.2.1. By Offering

            16.3.2.2. By Farm Size

            16.3.2.3. By Species

    16.4. Mexico

        16.4.1. Pricing Analysis

        16.4.2. Market Share Analysis, 2023

            16.4.2.1. By Offering

            16.4.2.2. By Farm Size

            16.4.2.3. By Species

    16.5. Germany

        16.5.1. Pricing Analysis

        16.5.2. Market Share Analysis, 2023

            16.5.2.1. By Offering

            16.5.2.2. By Farm Size

            16.5.2.3. By Species

    16.6. UK

        16.6.1. Pricing Analysis

        16.6.2. Market Share Analysis, 2023

            16.6.2.1. By Offering

            16.6.2.2. By Farm Size

            16.6.2.3. By Species

    16.7. France

        16.7.1. Pricing Analysis

        16.7.2. Market Share Analysis, 2023

            16.7.2.1. By Offering

            16.7.2.2. By Farm Size

            16.7.2.3. By Species

    16.8. Spain

        16.8.1. Pricing Analysis

        16.8.2. Market Share Analysis, 2023

            16.8.2.1. By Offering

            16.8.2.2. By Farm Size

            16.8.2.3. By Species

    16.9. Italy

        16.9.1. Pricing Analysis

        16.9.2. Market Share Analysis, 2023

            16.9.2.1. By Offering

            16.9.2.2. By Farm Size

            16.9.2.3. By Species

    16.10. Poland

        16.10.1. Pricing Analysis

        16.10.2. Market Share Analysis, 2023

            16.10.2.1. By Offering

            16.10.2.2. By Farm Size

            16.10.2.3. By Species

    16.11. Russia

        16.11.1. Pricing Analysis

        16.11.2. Market Share Analysis, 2023

            16.11.2.1. By Offering

            16.11.2.2. By Farm Size

            16.11.2.3. By Species

    16.12. Czech Republic

        16.12.1. Pricing Analysis

        16.12.2. Market Share Analysis, 2023

            16.12.2.1. By Offering

            16.12.2.2. By Farm Size

            16.12.2.3. By Species

    16.13. Romania

        16.13.1. Pricing Analysis

        16.13.2. Market Share Analysis, 2023

            16.13.2.1. By Offering

            16.13.2.2. By Farm Size

            16.13.2.3. By Species

    16.14. India

        16.14.1. Pricing Analysis

        16.14.2. Market Share Analysis, 2023

            16.14.2.1. By Offering

            16.14.2.2. By Farm Size

            16.14.2.3. By Species

    16.15. Bangladesh

        16.15.1. Pricing Analysis

        16.15.2. Market Share Analysis, 2023

            16.15.2.1. By Offering

            16.15.2.2. By Farm Size

            16.15.2.3. By Species

    16.16. Australia

        16.16.1. Pricing Analysis

        16.16.2. Market Share Analysis, 2023

            16.16.2.1. By Offering

            16.16.2.2. By Farm Size

            16.16.2.3. By Species

    16.17. New Zealand

        16.17.1. Pricing Analysis

        16.17.2. Market Share Analysis, 2023

            16.17.2.1. By Offering

            16.17.2.2. By Farm Size

            16.17.2.3. By Species

    16.18. China

        16.18.1. Pricing Analysis

        16.18.2. Market Share Analysis, 2023

            16.18.2.1. By Offering

            16.18.2.2. By Farm Size

            16.18.2.3. By Species

    16.19. Japan

        16.19.1. Pricing Analysis

        16.19.2. Market Share Analysis, 2023

            16.19.2.1. By Offering

            16.19.2.2. By Farm Size

            16.19.2.3. By Species

    16.20. South Korea

        16.20.1. Pricing Analysis

        16.20.2. Market Share Analysis, 2023

            16.20.2.1. By Offering

            16.20.2.2. By Farm Size

            16.20.2.3. By Species

    16.21. GCC Countries

        16.21.1. Pricing Analysis

        16.21.2. Market Share Analysis, 2023

            16.21.2.1. By Offering

            16.21.2.2. By Farm Size

            16.21.2.3. By Species

    16.22. South Africa

        16.22.1. Pricing Analysis

        16.22.2. Market Share Analysis, 2023

            16.22.2.1. By Offering

            16.22.2.2. By Farm Size

            16.22.2.3. By Species

    16.23. Israel

        16.23.1. Pricing Analysis

        16.23.2. Market Share Analysis, 2023

            16.23.2.1. By Offering

            16.23.2.2. By Farm Size

            16.23.2.3. By Species

17. Market Structure Analysis

    17.1. Competition Dashboard

    17.2. Competition Benchmarking

    17.3. Market Share Analysis of Top Players

        17.3.1. By Regional

        17.3.2. By Offering

        17.3.3. By Farm Size

        17.3.4. By Species

18. Competition Analysis

    18.1. Competition Deep Dive

        18.1.1. DeLaval

            18.1.1.1. Overview

            18.1.1.2. Product Portfolio

            18.1.1.3. Profitability by Market Segments

            18.1.1.4. Sales Footprint

            18.1.1.5. Strategy Overview

                18.1.1.5.1. Marketing Strategy

                18.1.1.5.2. Product Strategy

                18.1.1.5.3. Channel Strategy

        18.1.2. GEA Group

            18.1.2.1. Overview

            18.1.2.2. Product Portfolio

            18.1.2.3. Profitability by Market Segments

            18.1.2.4. Sales Footprint

            18.1.2.5. Strategy Overview

                18.1.2.5.1. Marketing Strategy

                18.1.2.5.2. Product Strategy

                18.1.2.5.3. Channel Strategy

        18.1.3. Nedap N.V.

            18.1.3.1. Overview

            18.1.3.2. Product Portfolio

            18.1.3.3. Profitability by Market Segments

            18.1.3.4. Sales Footprint

            18.1.3.5. Strategy Overview

                18.1.3.5.1. Marketing Strategy

                18.1.3.5.2. Product Strategy

                18.1.3.5.3. Channel Strategy

        18.1.4. Allflex Livestock Intelligence

            18.1.4.1. Overview

            18.1.4.2. Product Portfolio

            18.1.4.3. Profitability by Market Segments

            18.1.4.4. Sales Footprint

            18.1.4.5. Strategy Overview

                18.1.4.5.1. Marketing Strategy

                18.1.4.5.2. Product Strategy

                18.1.4.5.3. Channel Strategy

        18.1.5. Afimilk Ltd.

            18.1.5.1. Overview

            18.1.5.2. Product Portfolio

            18.1.5.3. Profitability by Market Segments

            18.1.5.4. Sales Footprint

            18.1.5.5. Strategy Overview

                18.1.5.5.1. Marketing Strategy

                18.1.5.5.2. Product Strategy

                18.1.5.5.3. Channel Strategy

        18.1.6. Beco Dairy Automation Inc.

            18.1.6.1. Overview

            18.1.6.2. Product Portfolio

            18.1.6.3. Profitability by Market Segments

            18.1.6.4. Sales Footprint

            18.1.6.5. Strategy Overview

                18.1.6.5.1. Marketing Strategy

                18.1.6.5.2. Product Strategy

                18.1.6.5.3. Channel Strategy

        18.1.7. Boumatic

            18.1.7.1. Overview

            18.1.7.2. Product Portfolio

            18.1.7.3. Profitability by Market Segments

            18.1.7.4. Sales Footprint

            18.1.7.5. Strategy Overview

                18.1.7.5.1. Marketing Strategy

                18.1.7.5.2. Product Strategy

                18.1.7.5.3. Channel Strategy

        18.1.8. Dairymaster

            18.1.8.1. Overview

            18.1.8.2. Product Portfolio

            18.1.8.3. Profitability by Market Segments

            18.1.8.4. Sales Footprint

            18.1.8.5. Strategy Overview

                18.1.8.5.1. Marketing Strategy

                18.1.8.5.2. Product Strategy

                18.1.8.5.3. Channel Strategy

        18.1.9. Waikato Milking Systems

            18.1.9.1. Overview

            18.1.9.2. Product Portfolio

            18.1.9.3. Profitability by Market Segments

            18.1.9.4. Sales Footprint

            18.1.9.5. Strategy Overview

                18.1.9.5.1. Marketing Strategy

                18.1.9.5.2. Product Strategy

                18.1.9.5.3. Channel Strategy

        18.1.10. Milkwell Milking Systems

            18.1.10.1. Overview

            18.1.10.2. Product Portfolio

            18.1.10.3. Profitability by Market Segments

            18.1.10.4. Sales Footprint

            18.1.10.5. Strategy Overview

                18.1.10.5.1. Marketing Strategy

                18.1.10.5.2. Product Strategy

                18.1.10.5.3. Channel Strategy

19. Assumptions & Acronyms Used

20. Research Methodology

List of Tables

Table 1: Global Market Value (US$ Million) Forecast by Region, 2019 to 2034

Table 2: Global Market Volume (Units) Forecast by Region, 2019 to 2034

Table 3: Global Market Value (US$ Million) Forecast by Offering, 2019 to 2034

Table 4: Global Market Volume (Units) Forecast by Offering, 2019 to 2034

Table 5: Global Market Value (US$ Million) Forecast by Farm Size, 2019 to 2034

Table 6: Global Market Volume (Units) Forecast by Farm Size, 2019 to 2034

Table 7: Global Market Value (US$ Million) Forecast by Species, 2019 to 2034

Table 8: Global Market Volume (Units) Forecast by Species, 2019 to 2034

Table 9: North America Market Value (US$ Million) Forecast by Country, 2019 to 2034

Table 10: North America Market Volume (Units) Forecast by Country, 2019 to 2034

Table 11: North America Market Value (US$ Million) Forecast by Offering, 2019 to 2034

Table 12: North America Market Volume (Units) Forecast by Offering, 2019 to 2034

Table 13: North America Market Value (US$ Million) Forecast by Farm Size, 2019 to 2034

Table 14: North America Market Volume (Units) Forecast by Farm Size, 2019 to 2034

Table 15: North America Market Value (US$ Million) Forecast by Species, 2019 to 2034

Table 16: North America Market Volume (Units) Forecast by Species, 2019 to 2034

Table 17: Latin America Market Value (US$ Million) Forecast by Country, 2019 to 2034

Table 18: Latin America Market Volume (Units) Forecast by Country, 2019 to 2034

Table 19: Latin America Market Value (US$ Million) Forecast by Offering, 2019 to 2034

Table 20: Latin America Market Volume (Units) Forecast by Offering, 2019 to 2034

Table 21: Latin America Market Value (US$ Million) Forecast by Farm Size, 2019 to 2034

Table 22: Latin America Market Volume (Units) Forecast by Farm Size, 2019 to 2034

Table 23: Latin America Market Value (US$ Million) Forecast by Species, 2019 to 2034

Table 24: Latin America Market Volume (Units) Forecast by Species, 2019 to 2034

Table 25: Western Europe Market Value (US$ Million) Forecast by Country, 2019 to 2034

Table 26: Western Europe Market Volume (Units) Forecast by Country, 2019 to 2034

Table 27: Western Europe Market Value (US$ Million) Forecast by Offering, 2019 to 2034

Table 28: Western Europe Market Volume (Units) Forecast by Offering, 2019 to 2034

Table 29: Western Europe Market Value (US$ Million) Forecast by Farm Size, 2019 to 2034

Table 30: Western Europe Market Volume (Units) Forecast by Farm Size, 2019 to 2034

Table 31: Western Europe Market Value (US$ Million) Forecast by Species, 2019 to 2034

Table 32: Western Europe Market Volume (Units) Forecast by Species, 2019 to 2034

Table 33: Eastern Europe Market Value (US$ Million) Forecast by Country, 2019 to 2034

Table 34: Eastern Europe Market Volume (Units) Forecast by Country, 2019 to 2034

Table 35: Eastern Europe Market Value (US$ Million) Forecast by Offering, 2019 to 2034

Table 36: Eastern Europe Market Volume (Units) Forecast by Offering, 2019 to 2034

Table 37: Eastern Europe Market Value (US$ Million) Forecast by Farm Size, 2019 to 2034

Table 38: Eastern Europe Market Volume (Units) Forecast by Farm Size, 2019 to 2034

Table 39: Eastern Europe Market Value (US$ Million) Forecast by Species, 2019 to 2034

Table 40: Eastern Europe Market Volume (Units) Forecast by Species, 2019 to 2034

Table 41: South Asia and Pacific Market Value (US$ Million) Forecast by Country, 2019 to 2034

Table 42: South Asia and Pacific Market Volume (Units) Forecast by Country, 2019 to 2034

Table 43: South Asia and Pacific Market Value (US$ Million) Forecast by Offering, 2019 to 2034

Table 44: South Asia and Pacific Market Volume (Units) Forecast by Offering, 2019 to 2034

Table 45: South Asia and Pacific Market Value (US$ Million) Forecast by Farm Size, 2019 to 2034

Table 46: South Asia and Pacific Market Volume (Units) Forecast by Farm Size, 2019 to 2034

Table 47: South Asia and Pacific Market Value (US$ Million) Forecast by Species, 2019 to 2034

Table 48: South Asia and Pacific Market Volume (Units) Forecast by Species, 2019 to 2034

Table 49: East Asia Market Value (US$ Million) Forecast by Country, 2019 to 2034

Table 50: East Asia Market Volume (Units) Forecast by Country, 2019 to 2034

Table 51: East Asia Market Value (US$ Million) Forecast by Offering, 2019 to 2034

Table 52: East Asia Market Volume (Units) Forecast by Offering, 2019 to 2034

Table 53: East Asia Market Value (US$ Million) Forecast by Farm Size, 2019 to 2034

Table 54: East Asia Market Volume (Units) Forecast by Farm Size, 2019 to 2034

Table 55: East Asia Market Value (US$ Million) Forecast by Species, 2019 to 2034

Table 56: East Asia Market Volume (Units) Forecast by Species, 2019 to 2034

Table 57: Middle East and Africa Market Value (US$ Million) Forecast by Country, 2019 to 2034

Table 58: Middle East and Africa Market Volume (Units) Forecast by Country, 2019 to 2034

Table 59: Middle East and Africa Market Value (US$ Million) Forecast by Offering, 2019 to 2034

Table 60: Middle East and Africa Market Volume (Units) Forecast by Offering, 2019 to 2034

Table 61: Middle East and Africa Market Value (US$ Million) Forecast by Farm Size, 2019 to 2034

Table 62: Middle East and Africa Market Volume (Units) Forecast by Farm Size, 2019 to 2034

Table 63: Middle East and Africa Market Value (US$ Million) Forecast by Species, 2019 to 2034

Table 64: Middle East and Africa Market Volume (Units) Forecast by Species, 2019 to 2034

List of Charts

Figure 1: Global Market Value (US$ Million) by Offering, 2024 to 2034

Figure 2: Global Market Value (US$ Million) by Farm Size, 2024 to 2034

Figure 3: Global Market Value (US$ Million) by Species, 2024 to 2034

Figure 4: Global Market Value (US$ Million) by Region, 2024 to 2034

Figure 5: Global Market Value (US$ Million) Analysis by Region, 2019 to 2034

Figure 6: Global Market Volume (Units) Analysis by Region, 2019 to 2034

Figure 7: Global Market Value Share (%) and BPS Analysis by Region, 2024 to 2034

Figure 8: Global Market Y-o-Y Growth (%) Projections by Region, 2024 to 2034

Figure 9: Global Market Value (US$ Million) Analysis by Offering, 2019 to 2034

Figure 10: Global Market Volume (Units) Analysis by Offering, 2019 to 2034

Figure 11: Global Market Value Share (%) and BPS Analysis by Offering, 2024 to 2034

Figure 12: Global Market Y-o-Y Growth (%) Projections by Offering, 2024 to 2034

Figure 13: Global Market Value (US$ Million) Analysis by Farm Size, 2019 to 2034

Figure 14: Global Market Volume (Units) Analysis by Farm Size, 2019 to 2034

Figure 15: Global Market Value Share (%) and BPS Analysis by Farm Size, 2024 to 2034

Figure 16: Global Market Y-o-Y Growth (%) Projections by Farm Size, 2024 to 2034

Figure 17: Global Market Value (US$ Million) Analysis by Species, 2019 to 2034

Figure 18: Global Market Volume (Units) Analysis by Species, 2019 to 2034

Figure 19: Global Market Value Share (%) and BPS Analysis by Species, 2024 to 2034

Figure 20: Global Market Y-o-Y Growth (%) Projections by Species, 2024 to 2034

Figure 21: Global Market Attractiveness by Offering, 2024 to 2034

Figure 22: Global Market Attractiveness by Farm Size, 2024 to 2034

Figure 23: Global Market Attractiveness by Species, 2024 to 2034

Figure 24: Global Market Attractiveness by Region, 2024 to 2034

Figure 25: North America Market Value (US$ Million) by Offering, 2024 to 2034

Figure 26: North America Market Value (US$ Million) by Farm Size, 2024 to 2034

Figure 27: North America Market Value (US$ Million) by Species, 2024 to 2034

Figure 28: North America Market Value (US$ Million) by Country, 2024 to 2034

Figure 29: North America Market Value (US$ Million) Analysis by Country, 2019 to 2034

Figure 30: North America Market Volume (Units) Analysis by Country, 2019 to 2034

Figure 31: North America Market Value Share (%) and BPS Analysis by Country, 2024 to 2034

Figure 32: North America Market Y-o-Y Growth (%) Projections by Country, 2024 to 2034

Figure 33: North America Market Value (US$ Million) Analysis by Offering, 2019 to 2034

Figure 34: North America Market Volume (Units) Analysis by Offering, 2019 to 2034

Figure 35: North America Market Value Share (%) and BPS Analysis by Offering, 2024 to 2034

Figure 36: North America Market Y-o-Y Growth (%) Projections by Offering, 2024 to 2034

Figure 37: North America Market Value (US$ Million) Analysis by Farm Size, 2019 to 2034

Figure 38: North America Market Volume (Units) Analysis by Farm Size, 2019 to 2034

Figure 39: North America Market Value Share (%) and BPS Analysis by Farm Size, 2024 to 2034

Figure 40: North America Market Y-o-Y Growth (%) Projections by Farm Size, 2024 to 2034

Figure 41: North America Market Value (US$ Million) Analysis by Species, 2019 to 2034

Figure 42: North America Market Volume (Units) Analysis by Species, 2019 to 2034

Figure 43: North America Market Value Share (%) and BPS Analysis by Species, 2024 to 2034

Figure 44: North America Market Y-o-Y Growth (%) Projections by Species, 2024 to 2034

Figure 45: North America Market Attractiveness by Offering, 2024 to 2034

Figure 46: North America Market Attractiveness by Farm Size, 2024 to 2034

Figure 47: North America Market Attractiveness by Species, 2024 to 2034

Figure 48: North America Market Attractiveness by Country, 2024 to 2034

Figure 49: Latin America Market Value (US$ Million) by Offering, 2024 to 2034

Figure 50: Latin America Market Value (US$ Million) by Farm Size, 2024 to 2034

Figure 51: Latin America Market Value (US$ Million) by Species, 2024 to 2034

Figure 52: Latin America Market Value (US$ Million) by Country, 2024 to 2034

Figure 53: Latin America Market Value (US$ Million) Analysis by Country, 2019 to 2034

Figure 54: Latin America Market Volume (Units) Analysis by Country, 2019 to 2034

Figure 55: Latin America Market Value Share (%) and BPS Analysis by Country, 2024 to 2034

Figure 56: Latin America Market Y-o-Y Growth (%) Projections by Country, 2024 to 2034

Figure 57: Latin America Market Value (US$ Million) Analysis by Offering, 2019 to 2034

Figure 58: Latin America Market Volume (Units) Analysis by Offering, 2019 to 2034

Figure 59: Latin America Market Value Share (%) and BPS Analysis by Offering, 2024 to 2034

Figure 60: Latin America Market Y-o-Y Growth (%) Projections by Offering, 2024 to 2034

Figure 61: Latin America Market Value (US$ Million) Analysis by Farm Size, 2019 to 2034

Figure 62: Latin America Market Volume (Units) Analysis by Farm Size, 2019 to 2034

Figure 63: Latin America Market Value Share (%) and BPS Analysis by Farm Size, 2024 to 2034

Figure 64: Latin America Market Y-o-Y Growth (%) Projections by Farm Size, 2024 to 2034

Figure 65: Latin America Market Value (US$ Million) Analysis by Species, 2019 to 2034

Figure 66: Latin America Market Volume (Units) Analysis by Species, 2019 to 2034

Figure 67: Latin America Market Value Share (%) and BPS Analysis by Species, 2024 to 2034

Figure 68: Latin America Market Y-o-Y Growth (%) Projections by Species, 2024 to 2034

Figure 69: Latin America Market Attractiveness by Offering, 2024 to 2034

Figure 70: Latin America Market Attractiveness by Farm Size, 2024 to 2034

Figure 71: Latin America Market Attractiveness by Species, 2024 to 2034

Figure 72: Latin America Market Attractiveness by Country, 2024 to 2034

Figure 73: Western Europe Market Value (US$ Million) by Offering, 2024 to 2034

Figure 74: Western Europe Market Value (US$ Million) by Farm Size, 2024 to 2034

Figure 75: Western Europe Market Value (US$ Million) by Species, 2024 to 2034

Figure 76: Western Europe Market Value (US$ Million) by Country, 2024 to 2034

Figure 77: Western Europe Market Value (US$ Million) Analysis by Country, 2019 to 2034

Figure 78: Western Europe Market Volume (Units) Analysis by Country, 2019 to 2034

Figure 79: Western Europe Market Value Share (%) and BPS Analysis by Country, 2024 to 2034

Figure 80: Western Europe Market Y-o-Y Growth (%) Projections by Country, 2024 to 2034

Figure 81: Western Europe Market Value (US$ Million) Analysis by Offering, 2019 to 2034

Figure 82: Western Europe Market Volume (Units) Analysis by Offering, 2019 to 2034

Figure 83: Western Europe Market Value Share (%) and BPS Analysis by Offering, 2024 to 2034

Figure 84: Western Europe Market Y-o-Y Growth (%) Projections by Offering, 2024 to 2034

Figure 85: Western Europe Market Value (US$ Million) Analysis by Farm Size, 2019 to 2034

Figure 86: Western Europe Market Volume (Units) Analysis by Farm Size, 2019 to 2034

Figure 87: Western Europe Market Value Share (%) and BPS Analysis by Farm Size, 2024 to 2034

Figure 88: Western Europe Market Y-o-Y Growth (%) Projections by Farm Size, 2024 to 2034

Figure 89: Western Europe Market Value (US$ Million) Analysis by Species, 2019 to 2034

Figure 90: Western Europe Market Volume (Units) Analysis by Species, 2019 to 2034

Figure 91: Western Europe Market Value Share (%) and BPS Analysis by Species, 2024 to 2034

Figure 92: Western Europe Market Y-o-Y Growth (%) Projections by Species, 2024 to 2034

Figure 93: Western Europe Market Attractiveness by Offering, 2024 to 2034

Figure 94: Western Europe Market Attractiveness by Farm Size, 2024 to 2034

Figure 95: Western Europe Market Attractiveness by Species, 2024 to 2034

Figure 96: Western Europe Market Attractiveness by Country, 2024 to 2034

Figure 97: Eastern Europe Market Value (US$ Million) by Offering, 2024 to 2034

Figure 98: Eastern Europe Market Value (US$ Million) by Farm Size, 2024 to 2034

Figure 99: Eastern Europe Market Value (US$ Million) by Species, 2024 to 2034

Figure 100: Eastern Europe Market Value (US$ Million) by Country, 2024 to 2034

Figure 101: Eastern Europe Market Value (US$ Million) Analysis by Country, 2019 to 2034

Figure 102: Eastern Europe Market Volume (Units) Analysis by Country, 2019 to 2034

Figure 103: Eastern Europe Market Value Share (%) and BPS Analysis by Country, 2024 to 2034

Figure 104: Eastern Europe Market Y-o-Y Growth (%) Projections by Country, 2024 to 2034

Figure 105: Eastern Europe Market Value (US$ Million) Analysis by Offering, 2019 to 2034

Figure 106: Eastern Europe Market Volume (Units) Analysis by Offering, 2019 to 2034

Figure 107: Eastern Europe Market Value Share (%) and BPS Analysis by Offering, 2024 to 2034

Figure 108: Eastern Europe Market Y-o-Y Growth (%) Projections by Offering, 2024 to 2034

Figure 109: Eastern Europe Market Value (US$ Million) Analysis by Farm Size, 2019 to 2034

Figure 110: Eastern Europe Market Volume (Units) Analysis by Farm Size, 2019 to 2034

Figure 111: Eastern Europe Market Value Share (%) and BPS Analysis by Farm Size, 2024 to 2034

Figure 112: Eastern Europe Market Y-o-Y Growth (%) Projections by Farm Size, 2024 to 2034

Figure 113: Eastern Europe Market Value (US$ Million) Analysis by Species, 2019 to 2034

Figure 114: Eastern Europe Market Volume (Units) Analysis by Species, 2019 to 2034

Figure 115: Eastern Europe Market Value Share (%) and BPS Analysis by Species, 2024 to 2034

Figure 116: Eastern Europe Market Y-o-Y Growth (%) Projections by Species, 2024 to 2034

Figure 117: Eastern Europe Market Attractiveness by Offering, 2024 to 2034

Figure 118: Eastern Europe Market Attractiveness by Farm Size, 2024 to 2034

Figure 119: Eastern Europe Market Attractiveness by Species, 2024 to 2034

Figure 120: Eastern Europe Market Attractiveness by Country, 2024 to 2034

Figure 121: South Asia and Pacific Market Value (US$ Million) by Offering, 2024 to 2034

Figure 122: South Asia and Pacific Market Value (US$ Million) by Farm Size, 2024 to 2034

Figure 123: South Asia and Pacific Market Value (US$ Million) by Species, 2024 to 2034

Figure 124: South Asia and Pacific Market Value (US$ Million) by Country, 2024 to 2034

Figure 125: South Asia and Pacific Market Value (US$ Million) Analysis by Country, 2019 to 2034

Figure 126: South Asia and Pacific Market Volume (Units) Analysis by Country, 2019 to 2034

Figure 127: South Asia and Pacific Market Value Share (%) and BPS Analysis by Country, 2024 to 2034

Figure 128: South Asia and Pacific Market Y-o-Y Growth (%) Projections by Country, 2024 to 2034

Figure 129: South Asia and Pacific Market Value (US$ Million) Analysis by Offering, 2019 to 2034

Figure 130: South Asia and Pacific Market Volume (Units) Analysis by Offering, 2019 to 2034

Figure 131: South Asia and Pacific Market Value Share (%) and BPS Analysis by Offering, 2024 to 2034

Figure 132: South Asia and Pacific Market Y-o-Y Growth (%) Projections by Offering, 2024 to 2034

Figure 133: South Asia and Pacific Market Value (US$ Million) Analysis by Farm Size, 2019 to 2034

Figure 134: South Asia and Pacific Market Volume (Units) Analysis by Farm Size, 2019 to 2034

Figure 135: South Asia and Pacific Market Value Share (%) and BPS Analysis by Farm Size, 2024 to 2034

Figure 136: South Asia and Pacific Market Y-o-Y Growth (%) Projections by Farm Size, 2024 to 2034

Figure 137: South Asia and Pacific Market Value (US$ Million) Analysis by Species, 2019 to 2034

Figure 138: South Asia and Pacific Market Volume (Units) Analysis by Species, 2019 to 2034

Figure 139: South Asia and Pacific Market Value Share (%) and BPS Analysis by Species, 2024 to 2034

Figure 140: South Asia and Pacific Market Y-o-Y Growth (%) Projections by Species, 2024 to 2034

Figure 141: South Asia and Pacific Market Attractiveness by Offering, 2024 to 2034

Figure 142: South Asia and Pacific Market Attractiveness by Farm Size, 2024 to 2034

Figure 143: South Asia and Pacific Market Attractiveness by Species, 2024 to 2034

Figure 144: South Asia and Pacific Market Attractiveness by Country, 2024 to 2034

Figure 145: East Asia Market Value (US$ Million) by Offering, 2024 to 2034

Figure 146: East Asia Market Value (US$ Million) by Farm Size, 2024 to 2034

Figure 147: East Asia Market Value (US$ Million) by Species, 2024 to 2034

Figure 148: East Asia Market Value (US$ Million) by Country, 2024 to 2034

Figure 149: East Asia Market Value (US$ Million) Analysis by Country, 2019 to 2034

Figure 150: East Asia Market Volume (Units) Analysis by Country, 2019 to 2034

Figure 151: East Asia Market Value Share (%) and BPS Analysis by Country, 2024 to 2034

Figure 152: East Asia Market Y-o-Y Growth (%) Projections by Country, 2024 to 2034

Figure 153: East Asia Market Value (US$ Million) Analysis by Offering, 2019 to 2034

Figure 154: East Asia Market Volume (Units) Analysis by Offering, 2019 to 2034

Figure 155: East Asia Market Value Share (%) and BPS Analysis by Offering, 2024 to 2034

Figure 156: East Asia Market Y-o-Y Growth (%) Projections by Offering, 2024 to 2034

Figure 157: East Asia Market Value (US$ Million) Analysis by Farm Size, 2019 to 2034

Figure 158: East Asia Market Volume (Units) Analysis by Farm Size, 2019 to 2034

Figure 159: East Asia Market Value Share (%) and BPS Analysis by Farm Size, 2024 to 2034

Figure 160: East Asia Market Y-o-Y Growth (%) Projections by Farm Size, 2024 to 2034

Figure 161: East Asia Market Value (US$ Million) Analysis by Species, 2019 to 2034

Figure 162: East Asia Market Volume (Units) Analysis by Species, 2019 to 2034

Figure 163: East Asia Market Value Share (%) and BPS Analysis by Species, 2024 to 2034

Figure 164: East Asia Market Y-o-Y Growth (%) Projections by Species, 2024 to 2034

Figure 165: East Asia Market Attractiveness by Offering, 2024 to 2034

Figure 166: East Asia Market Attractiveness by Farm Size, 2024 to 2034

Figure 167: East Asia Market Attractiveness by Species, 2024 to 2034

Figure 168: East Asia Market Attractiveness by Country, 2024 to 2034

Figure 169: Middle East and Africa Market Value (US$ Million) by Offering, 2024 to 2034

Figure 170: Middle East and Africa Market Value (US$ Million) by Farm Size, 2024 to 2034

Figure 171: Middle East and Africa Market Value (US$ Million) by Species, 2024 to 2034

Figure 172: Middle East and Africa Market Value (US$ Million) by Country, 2024 to 2034

Figure 173: Middle East and Africa Market Value (US$ Million) Analysis by Country, 2019 to 2034

Figure 174: Middle East and Africa Market Volume (Units) Analysis by Country, 2019 to 2034

Figure 175: Middle East and Africa Market Value Share (%) and BPS Analysis by Country, 2024 to 2034

Figure 176: Middle East and Africa Market Y-o-Y Growth (%) Projections by Country, 2024 to 2034

Figure 177: Middle East and Africa Market Value (US$ Million) Analysis by Offering, 2019 to 2034

Figure 178: Middle East and Africa Market Volume (Units) Analysis by Offering, 2019 to 2034

Figure 179: Middle East and Africa Market Value Share (%) and BPS Analysis by Offering, 2024 to 2034

Figure 180: Middle East and Africa Market Y-o-Y Growth (%) Projections by Offering, 2024 to 2034

Figure 181: Middle East and Africa Market Value (US$ Million) Analysis by Farm Size, 2019 to 2034

Figure 182: Middle East and Africa Market Volume (Units) Analysis by Farm Size, 2019 to 2034

Figure 183: Middle East and Africa Market Value Share (%) and BPS Analysis by Farm Size, 2024 to 2034

Figure 184: Middle East and Africa Market Y-o-Y Growth (%) Projections by Farm Size, 2024 to 2034

Figure 185: Middle East and Africa Market Value (US$ Million) Analysis by Species, 2019 to 2034

Figure 186: Middle East and Africa Market Volume (Units) Analysis by Species, 2019 to 2034

Figure 187: Middle East and Africa Market Value Share (%) and BPS Analysis by Species, 2024 to 2034

Figure 188: Middle East and Africa Market Y-o-Y Growth (%) Projections by Species, 2024 to 2034

Figure 189: Middle East and Africa Market Attractiveness by Offering, 2024 to 2034

Figure 190: Middle East and Africa Market Attractiveness by Farm Size, 2024 to 2034

Figure 191: Middle East and Africa Market Attractiveness by Species, 2024 to 2034

Figure 192: Middle East and Africa Market Attractiveness by Country, 2024 to 2034

Recommendations

Industrial Automation

Milking Equipment Market

Published : January 2023

Process Automation

Milk Sterilizer Machine Market

Published : December 2022

Explore Process Automation Insights

View Reports

Milking Automation Market