The Cow Milking Machine Market is estimated to be valued at USD 1043.4 million in 2025 and is projected to reach USD 2337.6 million by 2035, registering a compound annual growth rate (CAGR) of 8.4% over the forecast period.
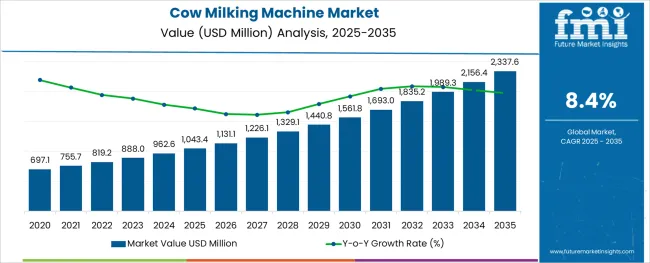
The cow milking machine market is witnessing notable expansion as dairy producers increasingly adopt mechanized solutions to improve productivity, animal welfare, and operational efficiency. Rising labor costs, stricter hygiene standards, and the push for higher milk yields have accelerated the shift from manual milking to automated systems.
Fully automated and stationary models are being favored as they enable consistent output, reduced dependency on skilled labor, and better herd management. Demand is also being fueled by growing dairy farm consolidation, technological advancements in sensors and robotics, and increasing awareness of food safety among consumers.
Future growth is expected to be shaped by innovation in machine design, improved affordability of automated systems, and supportive government initiatives to modernize the dairy sector. These drivers are paving the path for wider adoption of efficient, scalable, and animal-friendly milking solutions across varied dairy farming operations.
The market is segmented by Product Type, Model Type, and Buyer Type and region. By Product Type, the market is divided into Fully Automatic and Semi-Automatic. In terms of Model Type, the market is classified into Stationary, Mobile, and Pipeline. Based on Buyer Type, the market is segmented into Enterprise - Large, Individuals, Enterprise - Small, and Enterprise - Medium. Regionally, the market is classified into North America, Latin America, Western Europe, Eastern Europe, Balkan & Baltic Countries, Russia & Belarus, Central Asia, East Asia, South Asia & Pacific, and the Middle East & Africa.
The market is segmented by Product Type, Model Type, and Buyer Type and region. By Product Type, the market is divided into Fully Automatic and Semi-Automatic. In terms of Model Type, the market is classified into Stationary, Mobile, and Pipeline. Based on Buyer Type, the market is segmented into Enterprise - Large, Individuals, Enterprise - Small, and Enterprise - Medium. Regionally, the market is classified into North America, Latin America, Western Europe, Eastern Europe, Balkan & Baltic Countries, Russia & Belarus, Central Asia, East Asia, South Asia & Pacific, and the Middle East & Africa.
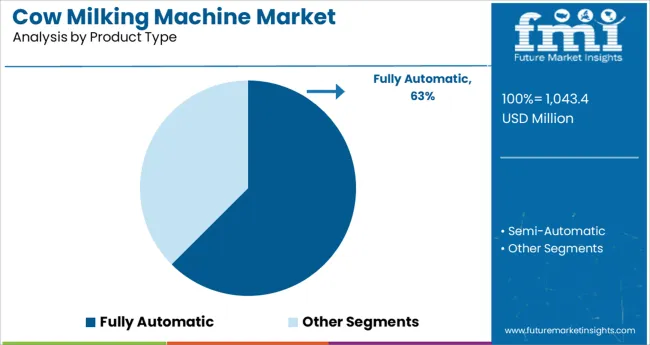
When segmented by product type, the fully automatic segment is anticipated to command a leading position with 62.5% of the total market revenue in 2025. This leadership is being attributed to its ability to significantly reduce manual intervention while ensuring consistent milking routines aligned with animal comfort and productivity goals.
Fully automatic systems have been widely deployed as they improve operational efficiency through real time monitoring of milk quality and yield, minimize stress on livestock, and optimize milking schedules. Dairy farms are increasingly recognizing that such systems reduce dependency on skilled labor and enable compliance with hygiene and animal welfare regulations.
Technological integration with herd management software and data analytics has further enhanced their value proposition, making fully automatic solutions the preferred choice in both large scale and progressive mid-sized operations.
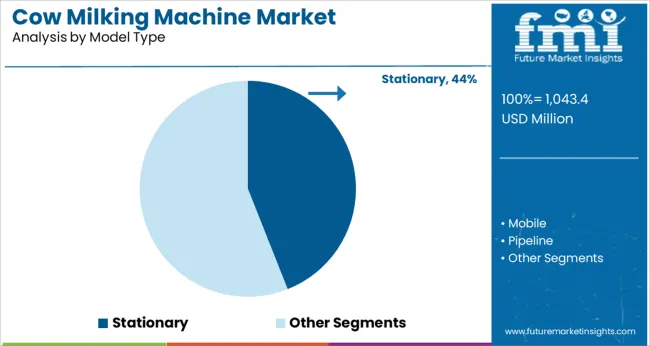
Segmenting by model type, the stationary segment is projected to hold 44.0% of the market revenue in 2025, securing its position as the leading model type. This dominance is being driven by its suitability for larger herds and its ability to deliver stable and efficient performance in high-volume operations.
Stationary models have been favored because of their robustness, durability, and ability to be integrated with automated cleaning and monitoring systems. These models offer superior reliability under continuous use and allow for seamless incorporation of advanced features like automated teat cleaning, controlled vacuum settings, and real time data capture.
The cost effectiveness of maintaining stationary installations and their adaptability to herd expansion have reinforced their preference among commercial dairy operations where consistency and scalability are critical.
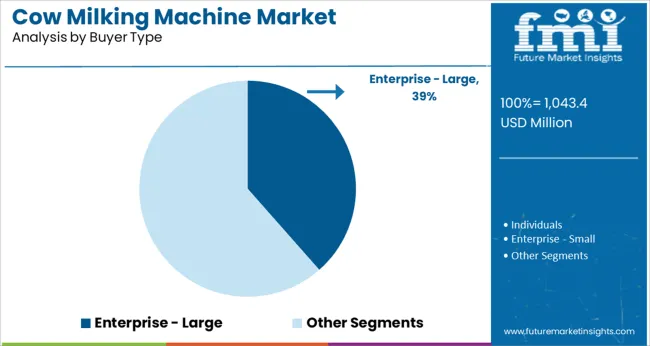
When segmented by buyer type, the enterprise large segment is expected to account for 38.5% of the market revenue in 2025, maintaining its leadership. This prominence is being supported by the financial capacity and operational scale of large dairy enterprises to invest in advanced milking technologies.
Larger buyers have been driving adoption as they prioritize efficiency, regulatory compliance, and return on investment while managing extensive herds. Their ability to implement sophisticated herd management systems, integrate automation across the value chain, and optimize labor utilization has positioned them at the forefront of modernizing dairy production.
The strategic focus on sustainability, quality assurance, and long term cost reduction has further encouraged large enterprises to transition toward mechanized milking, solidifying their leadership in the market.
The development of sophisticated electromechanical technology in the dairy equipment sector has had a considerable impact on the demand for cow milking machines. When compared to the 7.5% CAGR recorded between 2020 and 2025, the cow milking machine business is predicted to expand at an 8.4% CAGR between 2025 and 2035.
| Market Statistics | Details |
|---|---|
| Market Share (2020) | USD 530.1 million |
| Market Share (2024) | USD 761.8 million |
| Market Share (2025) | USD 819.1 million |
Advanced dairy equipment is no longer only used in large-scale dairy production facilities; small- and medium-sized dairy enterprises are increasingly incorporating it into their manufacturing cow milking machines.
Short-term Growth (2025 to 2029): a promising market trend is a fully autonomous variation. Short-term sales of cow milking machines are projected to rise in the industry as a result.
Medium-term Growth (2035 to 2035): during the predicted period, there is likely to increase in knowledge of these machines worldwide and in rural cooperative dairy enterprises.
Long-term Growth (2035 to 2035): high investment prospects by key market participants are projected to give great profit margins by 2035.
Key areas in the livestock business where the application of AI can yield significant benefits include combating parasites, biosecurity, monitoring farm animals, and farm management. In November 2020, rotational milking adopted artificial intelligence (AI) thanks to Dairymaster, an Irish producer of dairy equipment.
Most industrial sectors, including the dairy industry, have been affected by the fourth industrial revolution. It has increased the demand for cow milking machines in the fast-growing organic dairy industries throughout the world.
In an effort to meet end-user demands for company efficiency, milking machine industry leaders are introducing more user-friendly controls and effective features thanks to technological advancements.
The introduction of next-generation automation technologies in the dairy equipment business can support an increase in the sales of fully automatic cow milking machines.
Sales of these versions are nevertheless supported by end users' willingness to pay more for technologically advanced and automated milking machines. It is primarily driven by dairy firms' growing demand to increase milking efficiencies per labor hour.
FMI suggests cow milking machine manufacturers concentrate on using the internet of things (IoT) and 5G for increased productivity, profitability, and efficiency. Key players must concentrate on enlarging their product portfolios through acquisitions, and more, to take advantage of these opportunities.
The market for milking machines is currently trending toward higher demand for semi-automated models than for fully automatic ones. However, the introduction of robotic milking systems in the business can support the sales of fully automatic cow milking machines, with a CAGR of 8.3%.
As leading milking machine manufacturers introduce machines with herd management systems, the demand for fully automated milking machines is expected to soar in the near future.
The mobile model system outperforms the stationary milking apparatus, allowing the cows to spend the entire summer outdoors without ever leaving the pasture. With this arrangement, cows are milked in a mobile parlor that is on a grazing pasture, eliminating the need for herd trails. All challenges with remote herds are resolved by mobile models.
| Countries | Market Value (2025) |
|---|---|
| USA | USD 220.1 million |
| UK | USD 71.9 million |
| China | USD 67.69 million |
| Australia | USD 22.2 million |
| Germany | USD 140.2 million |
| Japan | USD 39.7 million |
| India | USD 34.3 million |
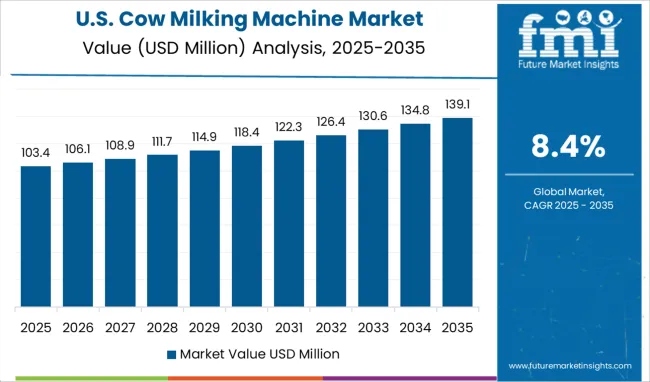
The USA is expected to generate the greatest revenue due to rising milk product demand and increased implementation of cutting-edge automated equipment. In 2025, it holds the largest cow milking machine market share at 26.9%.
Major dairy products are in high demand in this region. The region's dairy producers place a strong emphasis on using cutting-edge automated dairy equipment to produce high-quality milk products quickly.
Additionally, the essential stakeholders emphasize the delivery of high-quality equipment. As an illustration, the market-leading BouMatic LLC, with its headquarters in Wisconsin, USA, manufactures and runs milking machines through a subsidiary, BouMatic Robotics B.V.
For dairy farmers, a Dutch start-up makes milking robots. The business is primarily concerned with maintaining the harmony between cows, people, and technology, while also incorporating contemporary robotics into the dairy cattle industry.
Despite a severe dichotomy between vegetarianism and the region's heavy consumption of dairy products, the milking machine business in Europe is predicted to develop significantly over the coming years.
| UK Market CAGR (2035) | 9% |
|---|---|
| UK Market Share (2035) | 8.8% |
| UK Market Value (2035) | USD 170.3 million |
The UK's strong acceptance of technology automation is one factor that is helping to fuel the market's expansion. The industry is also being driven by the presence of top milking machines and dairy manufacturers. For instance, Fullwood Packo is a well-known producer of milking systems and milk chilling tanks with its headquarters in Ellesmere, England.
For the food and pharmaceutical industries, the company provides high-quality products. They produce sophisticated robotic milking systems with a strong emphasis on enhancing productivity, efficiency, and milk quality.
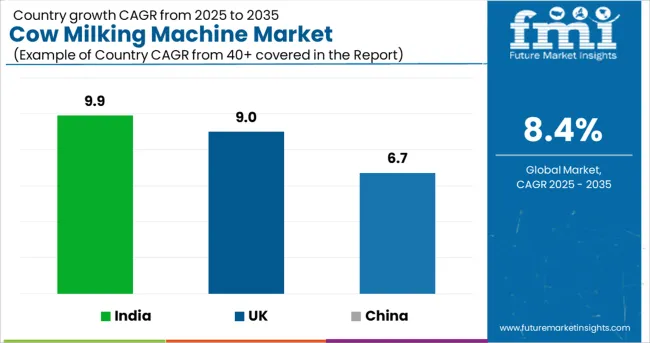
High sales of cow milking machines are anticipated for nations like China and India in the upcoming years, due to a variety of industry developments in these nations.
| Country | China |
|---|---|
| Market Share (2035) | 8.30% |
| Market CAGR (2035) | 6.70% |
| Market Value (2035) | USD 129.9 million |
| Country | India |
|---|---|
| Market Share (2035) | 5.20% |
| Market CAGR (2035) | 9.90% |
| Market Value (2035) | USD 87.8 million |
Along with new manufacturing methods, the local government in these areas is also helping the dairy business expand. As a result, the global industry is expanding due to rising opportunities in the cow milking machine market.
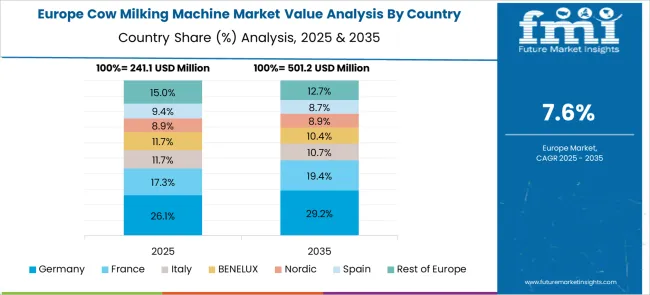
Germany holds a market share of 14.1% in 2025 due to high investment plans.
Leading dairy producers' emphasis on minimizing labor dependence is reflected in their recent business strategies, which support the deployment of cutting-edge automated technologies in the market.
Targeting new dairy businesses, developing cutting-edge products, and expanding product penetration through e-commerce are anticipated to generate sizable market potential.
For instance, in January 2020, DeLaval, another well-known brand in milking equipment, was bought by the largest company. DeLaval paid USD 780 Million in cash for the transaction. The position of DeLaval in the market for milking equipment around the world is improved by this acquisition.
The cow milking machine industry has a vibrant start-up scene. Numerous new businesses and goods are being developed. Being active in this sector right now is a wise decision. There are several chances for new goods and services, for this high investments are required by start-ups and key players.
Recent Developments
The global cow milking machine market is estimated to be valued at USD 1,043.4 million in 2025.
It is projected to reach USD 2,337.6 million by 2035.
The market is expected to grow at a 8.4% CAGR between 2025 and 2035.
The key product types are fully automatic and semi-automatic.
stationary segment is expected to dominate with a 44.0% industry share in 2025.


Our Research Products

The "Full Research Suite" delivers actionable market intel, deep dives on markets or technologies, so clients act faster, cut risk, and unlock growth.

The Leaderboard benchmarks and ranks top vendors, classifying them as Established Leaders, Leading Challengers, or Disruptors & Challengers.

Locates where complements amplify value and substitutes erode it, forecasting net impact by horizon

We deliver granular, decision-grade intel: market sizing, 5-year forecasts, pricing, adoption, usage, revenue, and operational KPIs—plus competitor tracking, regulation, and value chains—across 60 countries broadly.

Spot the shifts before they hit your P&L. We track inflection points, adoption curves, pricing moves, and ecosystem plays to show where demand is heading, why it is changing, and what to do next across high-growth markets and disruptive tech

Real-time reads of user behavior. We track shifting priorities, perceptions of today’s and next-gen services, and provider experience, then pace how fast tech moves from trial to adoption, blending buyer, consumer, and channel inputs with social signals (#WhySwitch, #UX).

Partner with our analyst team to build a custom report designed around your business priorities. From analysing market trends to assessing competitors or crafting bespoke datasets, we tailor insights to your needs.
Supplier Intelligence
Discovery & Profiling
Capacity & Footprint
Performance & Risk
Compliance & Governance
Commercial Readiness
Who Supplies Whom
Scorecards & Shortlists
Playbooks & Docs
Category Intelligence
Definition & Scope
Demand & Use Cases
Cost Drivers
Market Structure
Supply Chain Map
Trade & Policy
Operating Norms
Deliverables
Buyer Intelligence
Account Basics
Spend & Scope
Procurement Model
Vendor Requirements
Terms & Policies
Entry Strategy
Pain Points & Triggers
Outputs
Pricing Analysis
Benchmarks
Trends
Should-Cost
Indexation
Landed Cost
Commercial Terms
Deliverables
Brand Analysis
Positioning & Value Prop
Share & Presence
Customer Evidence
Go-to-Market
Digital & Reputation
Compliance & Trust
KPIs & Gaps
Outputs
Full Research Suite comprises of:
Market outlook & trends analysis
Interviews & case studies
Strategic recommendations
Vendor profiles & capabilities analysis
5-year forecasts
8 regions and 60+ country-level data splits
Market segment data splits
12 months of continuous data updates
DELIVERED AS:
PDF EXCEL ONLINE
Machine Glazed Paper Market Size and Share Forecast Outlook 2025 to 2035
Machine Glazed Kraft Paper Market Forecast and Outlook 2025 to 2035
Machine Condition Monitoring Market Size and Share Forecast Outlook 2025 to 2035
Machine Glazed Paper Industry Analysis in Asia Pacific Forecast Outlook 2025 to 2035
Milking Automation Market Size and Share Forecast Outlook 2025 to 2035
Machine Vision Camera Market Size and Share Forecast Outlook 2025 to 2035
Machine Tool Oils Market Size and Share Forecast Outlook 2025 to 2035
Machine Vision System And Services Market Size and Share Forecast Outlook 2025 to 2035
Machine Glazed Paper Industry Analysis in Western Europe Size and Share Forecast Outlook 2025 to 2035
Machine Glazed Paper Industry Analysis in Korea Size and Share Forecast Outlook 2025 to 2035
Machine Glazed Paper Industry Analysis in Japan Size and Share Forecast Outlook 2025 to 2035
Milking Robots Market Size and Share Forecast Outlook 2025 to 2035
Machine Tool Cooling System Market Analysis - Size, Share, and Forecast Outlook 2025 to 2035
Machine Tool Touch Probe Market Analysis - Size, Growth, and Forecast 2025 to 2035
Machine Mount Market Analysis - Size & Industry Trends 2025 to 2035
Machine Control System Market Growth – Trends & Forecast 2025 to 2035
Machine Automation Controller Market Growth – Trends & Forecast 2025 to 2035
Machine-to-Machine (M2M) Connections Market – IoT & Smart Devices 2025 to 2035
Cow Colostrum Market Insights – Immunity & Nutritional Benefits 2025 to 2035
Cowboy Boots Market Analysis – Growth, Demand & Forecast 2025 to 2035

Thank you!
You will receive an email from our Business Development Manager. Please be sure to check your SPAM/JUNK folder too.
Chat With
MaRIA