Plant-based Snacks Market Forecast and Outlook 2025 to 2035

The global plant-based snacks market is valued at USD 42.2 billion in 2025 and is slated to reach USD 92.8 billion by 2035, recording an absolute increase of USD 50.7 billion over the forecast period. This translates into a total growth of 120.1%, with the market forecast to expand at a compound annual growth rate (CAGR) of 8.2% between 2025 and 2035.
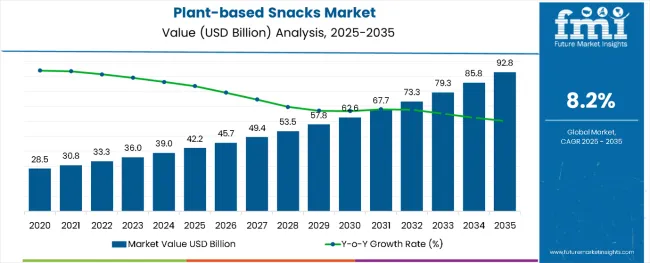
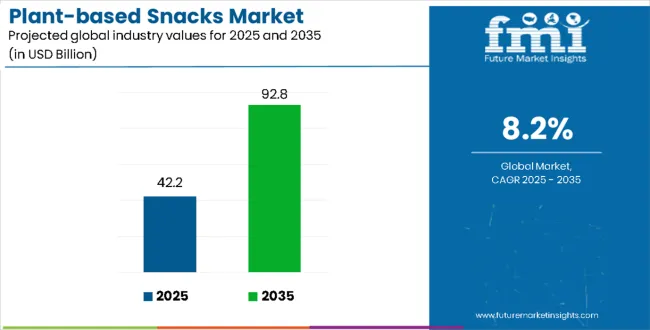
Plant Based Snacks Market Value Analysis

Quick Stats for Plant-based Snacks Market

  • Plant-based Snacks Market Value (2025): USD 42.2 billion
  • Plant-based Snacks Market Forecast Value (2035): USD 92.8 billion
  • Plant-based Snacks Market Forecast CAGR: 8.2%
  • Leading Product Type in Plant-based Snacks Market: Cereal/Grain-based Snacks (28.0%)
  • Key Growth Regions in Plant-based Snacks Market: North America, Europe, and Asia Pacific
  • Top Key Players in Plant-based Snacks Market: General Mills Inc., Nestlé S.A., Unilever, The Hain Celestial Group, Danone, Beyond Meat Inc., Kellogg Company, Mondelez International, PepsiCo Inc., Kind LLC

Plant Based Snacks Market

Plant-based Snacks Market Key Takeaways

Metric Value
Estimated Value in (2025E) USD 42.2 billion
Forecast Value in (2035F) USD 92.8 billion
Forecast CAGR (2025 to 2035) 8.2%

The overall market size is expected to grow by nearly 2.2X during the same period, supported by increasing consumer awareness about health benefits, rising demand for sustainable food options, and growing focus on plant-based nutrition and ethical consumption.

Between 2025 and 2030, the plant-based snacks market is projected to expand from USD 42.2 billion to USD 62.8 billion, resulting in a value increase of USD 20.6 billion, which represents 40.6% of the total forecast growth for the decade. This phase of growth will be shaped by rising consumer awareness about health and sustainability benefits, increasing demand for natural and organic formulations, and growing penetration of plant-based products in mainstream retail channels. Food manufacturers are expanding their plant-based snack portfolios to address the growing demand for nutritious and sustainable snacking solutions.

From 2030 to 2035, the market is forecast to grow from USD 62.8 billion to USD 92.8 billion, adding another USD 30.1 billion, which constitutes 59.4% of the overall ten-year expansion. This period is expected to be characterized by expansion of e-commerce channels, integration of advanced processing technologies in formulations, and development of personalized nutrition solutions. The growing adoption of clean label trends and nutritionist-recommended products will drive demand for premium plant-based snacks with enhanced nutritional profiles and sustainability credentials.

Between 2020 and 2025, the plant-based snacks market experienced robust expansion, driven by increasing consumer focus on health-conscious eating and growing awareness of environmental sustainability. The market developed as food brands recognized the need for nutritious snacking alternatives to address wellness concerns and environmental impact. Social media influence and nutritionist recommendations began emphasizing the importance of plant-based nutrition in daily dietary routines for maintaining optimal health and supporting sustainable food systems.

Plant-based Snacks Market-Opportunity Pathways

The decade ahead is transformative for plant-based snacks. Consumers are seeking healthier, sustainable, and convenient alternatives to traditional snacks. Policymakers are reinforcing this with nutrition labeling and sugar/fat reduction mandates, while innovators push the boundaries with functional ingredients and new formats. Together, these forces create eight powerful growth pathways, unlocking USD 90-120 billion in incremental revenue by 2035.

Pathway A - Clean Label & Ingredient Innovation.

Novel plant proteins such as pea, lentil, and chickpea are redefining taste and texture. Organic, non-GMO, and allergen-free claims meet the rising demand for clean-label products. Expected revenue pool: USD 12-18 billion.

Pathway B - Functional & Health-Oriented Snacking.

Snacks fortified with protein, fibre, probiotics, or reduced sugar reposition plant-based products as wellness tools. Target groups include athletes, weight managers, and health-conscious consumers. Opportunity size: USD 10-15 billion.

Pathway C - Format & Application Diversification.

Expansion beyond bars and chips into jerky, dips, coated snacks, frozen products, and ready-to-eat kits broadens usage occasions. Incremental pool: USD 8-12 billion.

Pathway D - Emerging Market Penetration & Localisation.

Asia-Pacific, Latin America, and Africa are poised for rapid uptake. Local sourcing of raw materials and flavour adaptation drive affordability and consumer acceptance. Expected upside: USD 15 to 20 billion.

Pathway E - Sustainability & ESG Monetization.

Sustainable farming practices, recyclable packaging, and carbon-reduction claims resonate with ESG-focused buyers and institutions. Additional value: USD 8-12 billion.

Pathway F - Brand & Premium Positioning.

Premiumisation through gourmet flavours, exotic botanicals, and artisan blends elevates plant-based snacks beyond “healthy alternatives.” Incremental revenue: USD 6-10 billion.

Pathway G - Digital & Subscription Models.

Direct-to-consumer platforms, snack subscription boxes, and wellness bundling strengthen consumer relationships and recurring revenues. Smaller but fast-growing pool: USD 5-8 billion.

Pathway H - Regulatory & Policy Tailwinds.

Sugar/fat reduction mandates, stricter labelling rules, and public procurement programs (schools, hospitals) accelerate adoption. Potential upside: USD 6-9 billion.

Why is the Plant-based Snacks Market Growing?

Market expansion is being supported by the increasing consumer awareness about the health benefits of plant-based nutrition and the corresponding demand for sustainable snacking options. Modern consumers are increasingly focused on clean eating practices that can support overall wellness, weight management, and environmental sustainability. Plant-based snacks' proven benefits in providing essential nutrients while reducing environmental footprint make them a preferred choice in health-conscious snacking formulations.

The growing emphasis on clean label and natural ingredients is driving demand for plant-based snack products derived from whole food sources such as fruits, nuts, grains, and vegetables. Consumer preference for multifunctional products that combine nutritional benefits with taste satisfaction and convenience is creating opportunities for innovative formulations. The rising influence of social media wellness trends and nutritionist recommendations is also contributing to increased product adoption across different age groups and demographics.

  • North America: Consumption is relatively high, supported by strong availability in retail and convenience channels, with younger consumers leading adoption.
  • Europe: Uptake is steady, shaped by health consciousness and sustainability priorities, with Northern and Western countries showing the most consistent habits.
  • Asia Pacific: Growth is accelerating, fueled by expanding plant-forward diets, urban demand, and increasing exposure to global snack brands.

Segmental Analysis

The market is segmented by product type, packaging, flavor, and distribution channel. By product type, the market is divided into cereal/grain-based snacks, fruit and nut snacks, plant-based snack bars, meat alternative snacks, wafers, and others. Based on packaging, the market is categorized into bags, wrappers, tins, and antiseptic packaging.

In terms of flavor, the market is segmented into savory and sweet varieties. By distribution channel, the market is classified into indirect and direct channels, with indirect channels including hypermarkets/supermarkets, online retailers, convenience stores, specialty stores, grocery stores, and independent retailers.
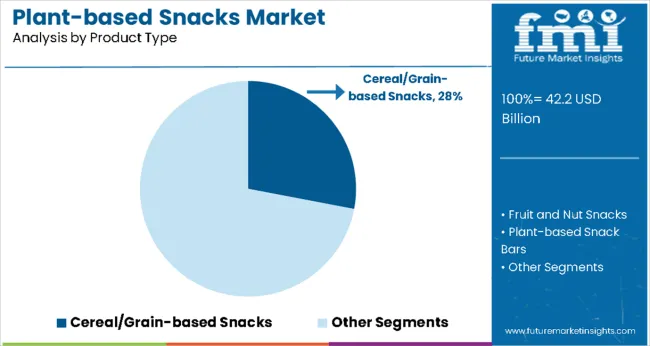
By Product Type, Cereal/Grain-based Snacks Segment Accounts for 28.0% Market Share

Plant Based Snacks Market By Product Types

The cereal/grain-based snacks segment is projected to account for 28.0% of the plant-based snacks market in 2025, reaffirming its position as the category's leading product type. Consumers increasingly understand the nutritional benefits of whole grains, including fiber content, protein, and essential vitamins and minerals that support digestive health and sustained energy levels. Cereal and grain-based snacks' versatility in flavor profiles and convenience factor directly address modern snacking preferences by offering wholesome nutrition in portable formats.

This segment forms the foundation of most product positioning, as it represents the most accessible and familiar form of plant-based snacking for mainstream consumers. Nutritionist endorsements and ongoing research validation continue to strengthen trust in grain-based formulations. With consumer lifestyles demanding convenient yet nutritious snacking options, cereal/grain-based snacks align with both health-conscious and practical snacking goals. Their broad appeal across demographics ensures sustained dominance, making them the central growth driver of plant-based snack demand.
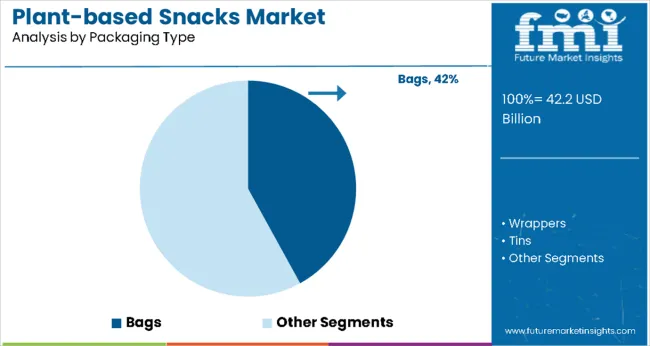
By Packaging, Bags Segment Accounts for 42.0% Market Share

Plant Based Snacks Market By Packaging Type

Bags are projected to represent 42.0% of plant-based snack packaging demand in 2025, underscoring their role as the preferred packaging format for convenient snack consumption. Consumers gravitate toward bag packaging for its portability, resealability, and ability to preserve product freshness while offering clear product visibility and branding opportunities. Positioned as practical and cost-effective packaging solutions, bags offer both functionality for on-the-go consumption and sustainability benefits through recyclable material options.

The segment is supported by the rising popularity of portion-controlled snacking, where bags play a central role in providing appropriate serving sizes. Additionally, brands are increasingly utilizing innovative bag designs with sustainable materials, enhanced barrier properties, and eye-catching graphics, enhancing appeal and justifying premium positioning. As convenience-focused consumers prioritize portable and fresh snacking experiences, bag packaging will continue to dominate demand, reinforcing its practical positioning within the plant-based snacks market.

What are the Drivers, Restraints, and Key Trends of the Plant-based Snacks Market?

The plant-based snacks market is advancing rapidly due to increasing consumer awareness about health and wellness and growing demand for sustainable food options. However, the market faces challenges including ingredient sourcing complexities, taste and texture optimization issues, and competition from traditional snack categories. Innovation in processing technologies and sustainable sourcing practices continue to influence product development and market expansion patterns.

Expansion of E-commerce and Direct-to-Consumer Channels

The growing adoption of e-commerce platforms is enabling brands to reach consumers directly and provide personalized nutrition recommendations. Online channels offer convenience, detailed product information, and customer reviews that influence purchasing decisions. Social media marketing and influencer partnerships are driving brand awareness and product adoption, particularly among younger demographics who prefer online shopping experiences and value transparency in food sourcing.

Integration of Advanced Processing Technologies and Formulation Innovation

Modern plant-based snack manufacturers are incorporating advanced processing technologies such as air-drying, freeze-drying, and high-pressure processing to enhance nutritional retention and extend shelf life. These technologies improve the taste and texture of plant-based snacks while maintaining nutritional integrity and providing better consumer experience. Advanced formulation techniques also enable combination products that deliver multiple nutritional benefits and satisfy diverse taste preferences in single applications.
Analysis of Plant-based Snacks Market by Key Country

Plant Based Snacks Market Country Wise Analysis

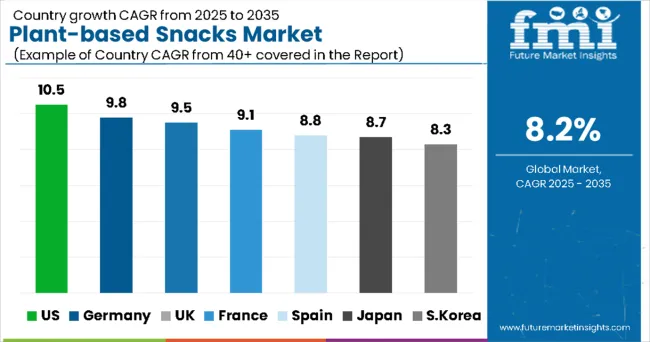
Country CAGR (2025 to 2035)
United States 10.5%
Germany 9.8%
UK 9.5%
France 9.1%
Spain 8.8%
Japan 8.7%
South Korea 8.3%

The plant-based snacks market is experiencing robust growth globally, with the United States leading at a 10.5% CAGR through 2035, driven by strong health and wellness trends, increasing consumer awareness of sustainable eating, and growing penetration of plant-based products in mainstream retail.

Germany follows at 9.8%, supported by strong organic food culture, environmental consciousness, and increasing demand for premium healthy snacks. The UK shows steady growth at 9.5%, emphasizing clean eating trends and sustainability-focused consumption. France records 9.1%, focusing on gourmet plant-based formulations and premium positioning. Spain shows 8.8% growth, prioritizing Mediterranean diet integration and healthy snacking practices.

The report covers an in-depth analysis of 40+ countries; six top-performing countries are highlighted below.

United States Leads Market Growth with Health and Wellness Innovation

Revenue from plant-based snacks in the United States is projected to exhibit strong growth with a CAGR of 10.5% through 2035, driven by rapid adoption of health-conscious eating habits among consumers and increasing influence of wellness trends on snacking choices.

The country's expanding health-aware population and growing sustainability consciousness are creating significant demand for nutritious and environmentally friendly snack products. Major food manufacturers and emerging brands are establishing comprehensive distribution networks to serve the growing population of health-conscious consumers across urban and suburban markets.

  • Government support for sustainable agriculture and plant-based food innovation is driving demand for certified organic and sustainably sourced snack products throughout major metropolitan areas.
  • E-commerce platform growth and subscription-based snack services are supporting rapid product adoption and brand awareness among health-focused consumers nationwide.

Germany Demonstrates Strong Market Foundation with Organic Food Culture

Revenue from plant-based snacks in Germany is expanding at a CAGR of 9.8%, supported by strong organic food culture, environmental awareness, and rising demand for sustainable food options. The country's health-conscious demographic profile and increasing focus on sustainable consumption are driving demand for premium plant-based snacking solutions. International food brands and domestic manufacturers are establishing distribution channels to serve the growing demand for organic and environmentally responsible snack products.

  • Rising awareness about environmental impact of food choices and sustainable eating practices is creating opportunities for specialized plant-based snack products across urban and rural markets.
  • Growing influence of environmental movements and sustainability advocates is driving product education and adoption among consumers seeking responsible food choices.

United Kingdom Focuses on Health Trends and Sustainability

Demand for plant-based snacks in the UK is projected to grow at a CAGR of 9.5%, supported by consumer preference for healthy snacking options and environmentally conscious food choices. British consumers are increasingly focused on nutritional transparency, product efficacy, and sustainable food practices. The market is characterized by strong demand for premium formulations that combine plant-based nutrition with innovative flavors and convenient packaging formats.

  • Clean eating movement and natural ingredient preference are driving demand for plant-based snacks derived from organic and sustainably sourced ingredients throughout retail channels.
  • Nutritionist recommendations and health studies are supporting product credibility and consumer confidence in plant-based snack nutritional benefits and wellness impact.

France Maintains Leadership with Gourmet Food Innovation

Revenue from plant-based snacks in France is projected to grow at a CAGR of 9.1% through 2035, driven by the country's strong focus on food quality, gourmet positioning, and consumer preference for premium food experiences. French consumers consistently demand high-quality, artisanal products that deliver exceptional taste while maintaining nutritional benefits.

  • Ongoing investment in food technology and culinary innovation is supporting next-generation plant-based snack formulations that combine French culinary expertise with advanced nutritional science for superior taste and health benefits.
  • Collaboration between food manufacturers and culinary institutes is enhancing product innovation, reinforcing France's position as a leader in gourmet plant-based snack solutions.

Spain Strengthens Market with Mediterranean Diet Integration

Revenue from plant-based snacks in Spain is projected to grow at a CAGR of 8.8% through 2035, supported by integration with traditional Mediterranean diet principles and rising consumer interest in healthy snacking alternatives. Spanish consumers value natural ingredients, traditional food preparation methods, and nutritional authenticity, positioning plant-based snacks as a natural extension of Mediterranean eating patterns.

  • Growth in specialty food retail and health-focused distribution channels is increasing accessibility of plant-based snacks across diverse consumer demographics and regions.
  • Rising demand for traditional flavor profiles combined with modern nutritional benefits is encouraging food brands to integrate Mediterranean ingredients into their plant-based snack formulations.

Japan Anchors Growth with Quality and Innovation Standards

Revenue from plant-based snacks in Japan is projected to grow at a CAGR of 8.7% through 2035, supported by the country's strong emphasis on food quality, innovation, and health-conscious eating habits. Japanese consumers prioritize nutritional density, natural ingredients, and functional food benefits, making plant-based snacks a trusted choice in the premium healthy snacking segment.

  • Strict quality standards and consumer demand for safe, high-quality formulations are driving manufacturers to adopt advanced processing techniques and rigorous testing for plant-based snack products.
  • Convenience stores, health food retailers, and premium e-commerce platforms are enhancing product distribution, while nutritionist endorsements are supporting consumer confidence in plant-based snack nutritional efficacy and health benefits.

South Korea Anchors Growth with K-Wellness and Innovation Standards

Revenue from plant-based snacks in South Korea is projected to grow at a CAGR of 8.3% through 2035, supported by the country's strong emphasis on wellness culture, beauty-from-within trends, and consumer preference for functional food products. Korean consumers prioritize nutritional benefits, natural ingredients, and innovative food technologies, making plant-based snacks a trusted choice in the premium healthy lifestyle segment.
  • Integration of traditional Korean ingredients and flavors with modern plant-based formulations is driving product innovation and supporting consumer acceptance of healthy snacking alternatives.
  • Convenience stores, health food retailers, and online platforms are enhancing product distribution, while K-wellness influencers and nutritionists are supporting consumer confidence in plant-based snack health benefits and lifestyle integration.

Europe Market Split by Country

Europe Plant Based Snacks Market

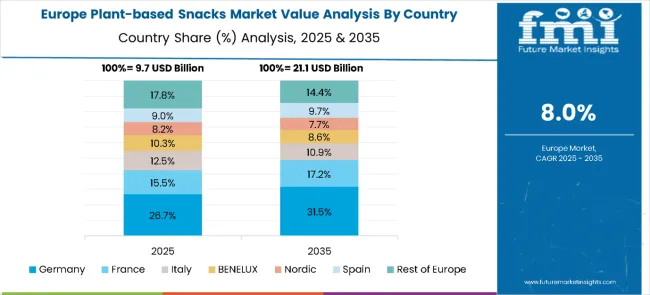
The plant-based snacks market in Europe is projected to grow from USD 9.1 billion in 2025 to USD 20.0 billion by 2035, registering a CAGR of 8.2% over the forecast period. Germany will continue to lead the regional market, accounting for 23.5% in 2025 and rising slightly to 24.1% by 2035, supported by a large health-conscious consumer base, strong organic retail channels, and innovation from domestic food brands. The United Kingdom follows with 18.9% in 2025, increasing to 19.7% by 2035, driven by rapid adoption of clean-label products, DTC/e-commerce penetration, and ongoing product innovation.

France holds 16.3% in 2025, edging up to 16.6% by 2035 as premium and gourmet plant-based snack formulations gain traction among quality-seeking consumers. Italy contributes 11.8% in 2025, remaining broadly stable at 11.6% by 2035, supported by Mediterranean ingredient adjacencies and growing premium snack launches.

Spain represents 8.9% in 2025, easing slightly to 8.6% by 2035, while the Rest of Europe (Nordic, BENELUX, Eastern Europe and smaller markets) accounts for the remainder, moderating from 20.6% in 2025 to 19.4% by 2035 as larger Western markets capture a greater share of premium and mainstream plant-based snack demand.
Competitive Landscape of Plant-based Snacks Market

Plant Based Snacks Market By Company

The plant-based snacks market is characterized by competition among established food manufacturers, specialty health food companies, and emerging plant-based brands. Companies are investing in advanced processing technologies, sustainable sourcing practices, premium packaging, and digital marketing strategies to deliver nutritious, appealing, and accessible plant-based snacking solutions. Brand positioning, ingredient innovation, and channel expansion are central to strengthening product portfolios and market presence.

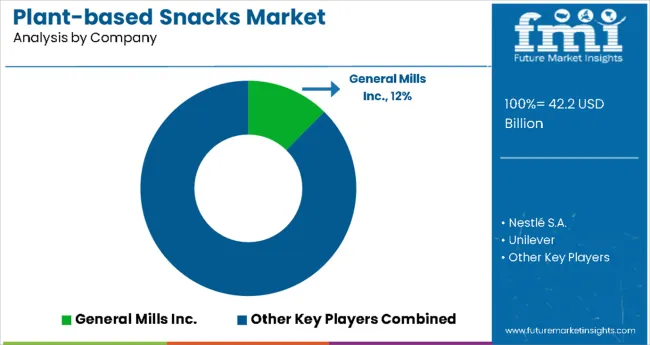
General Mills Inc. leads the market with 12.4% global value share, offering diverse plant-based snack formulations with a focus on nutritional benefits and taste satisfaction. Nestlé S.A. provides comprehensive plant-based product ranges with emphasis on quality ingredients and global distribution. Unilever delivers sustainable and health-focused formulations with strong brand recognition and consumer trust. The Hain Celestial Group focuses on organic and natural plant-based snacking solutions with premium positioning.

Danone and Beyond Meat Inc., operating globally, provide innovative plant-based product ranges across multiple price points and distribution channels. Kellogg Company emphasizes nutritional benefits and convenient packaging with mainstream market appeal. Mondelez International offers premium plant-based snack solutions with focus on taste innovation and global reach. PepsiCo Inc. and Kind LLC provide specialized healthy snacking solutions with focus on specific nutritional benefits and natural ingredient preferences.

Global Plant-Based Snacks Market - Stakeholder Contribution Framework

The rise of plant-based snacks, fueled by shifting consumer diets, ESG-linked food strategies, and digital retail expansion, will not only accelerate healthier eating habits but also strengthen food security and climate resilience. It will consolidate emerging regions as hubs for sustainable ingredient sourcing (legumes, pulses, fruits, nuts) and align advanced economies with clean-label, low-carbon snacking. This calls for a concerted effort by all stakeholders: governments, industry bodies, suppliers, OEMs, and investors. Each can be a crucial enabler in preparing the market for its next phase of growth.

How Governments Could Spur Local Production and Adoption?

  • Targeted Incentives: Provide tax breaks for companies using indigenous pulses, millets, or upcycled plant ingredients in snack formulations.
  • Trade Agreements: Classify plant-based snacks under "sustainable and climate-positive foods" in FTAs and simplify regulatory clearance for protein-fortified or allergen-free claims.
  • Facilitate Innovation: Fund R&D in shelf-stability, low-sodium flavorings, and clean-label packaging. Establish innovation labs for climate-resilient crops to feed snack pipelines.

How Industry Bodies Could Support Market Development?

  • Foster Connectivity: Create coalitions linking snack brands, ingredient suppliers, and digital commerce platforms to accelerate scale and global reach.
  • Promote Exports: Position plant-based snacks as premium, health-forward alternatives. Organize trade shows showcasing protein-rich, functional, and clean-label innovations.
  • Upskilling Programs: Develop curricula on fortification, allergen management, carbon-footprint reporting, and sustainable packaging for manufacturers and distributors.

How OEMs and Food-Tech Players Could Strengthen the Ecosystem?

  • Drive Integration: Bundle extrusion, baking, and dehydration technologies with AI-enabled recipe formulation and IoT-driven quality monitoring.
  • Forge Partnerships: Co-develop snacks with enhanced nutrition such as fiber, omega-3, and probiotics. Partner with suppliers on upcycling food waste into high-value snack ingredients.

How Suppliers Could Navigate the Shift?

  • Capture Exports: Expand supply of protein isolates, fruit powders, and pulse flours into high-growth Western markets seeking vegan and allergen-free snacks.
  • Invest in Research: Collaborate with startups on texturization, novel binding agents, and functional fortification such as adaptogens and superfoods.
  • Build Capabilities: Train farmers and cooperatives to meet traceability and organic standards, strengthening supplier-brand partnerships.

How Investors Could Catalyze Growth?

  • Deploy Capital: Support scaling of mid-sized plant-based snack brands and co-manufacturing facilities.
  • Support Branding: Fund D2C digital-native snack startups targeting Gen Z and wellness consumers.
  • De-Risk Supply Chains: Finance resilient sourcing networks for key inputs such as peas, chickpeas, quinoa, and oats across emerging regions.

Key Players in the Plant-based Snacks Market

  • General Mills Inc.
  • Nestlé S.A.
  • Unilever
  • The Hain Celestial Group
  • Danone
  • Beyond Meat Inc.
  • Kellogg Company
  • Mondelez International
  • PepsiCo Inc.
  • Kind LLC

Scope of the Report

Items Values
Quantitative Units (2025) USD 42.2 Billion
Product Type Cereal/grain-based snacks, Fruit and nut snacks, Plant-based snack bars, Meat alternative snacks, Wafers, Others
Packaging Bags, Wrappers, Tins, Antiseptic
Flavor Savory, Sweet
Distribution Channel Indirect, Direct
Regions Covered North America, Europe, East Asia, South Asia & Pacific, Latin America, Middle East & Africa
Countries Covered United States, Canada, United Kingdom, Germany, France, Japan, South Korea, Spain, India, Brazil, Australia and 40+ countries
Key Companies Profiled General Mills Inc., Nestlé S.A., Unilever, The Hain Celestial Group, Danone, Beyond Meat Inc., Kellogg Company, Mondelez International, PepsiCo Inc., and Kind LLC
Additional Attributes Dollar sales by product type and packaging format, regional demand trends, competitive landscape, buyer preferences for organic versus conventional sources, integration with health/wellness positioning, innovations in processing technology, sustainable packaging, and clean label formulations

Key Segments

By Product Type:

  • Cereal/grain-based snacks
  • Fruit and nut snacks
  • Plant-based snack bars
  • Meat alternative snacks
  • Wafers
  • Others

By Packaging:

  • Bags
  • Wrappers
  • Tins
  • Antiseptic

By Flavor:

  • Savory
  • Sweet

By Distribution Channel:

  • Indirect
    • Hypermarkets/Supermarkets
    • Online Retailers
    • Convenience Stores
    • Specialty Stores
    • Grocery Stores
    • Independent Retailers
  • Direct

By Region:

  • North America
    • United States
    • Canada
    • Mexico
  • Europe
    • Germany
    • United Kingdom
    • France
    • Italy
    • Spain
    • Nordic
    • BENELUX
    • Rest of Europe
  • East Asia
    • China
    • Japan
    • South Korea
  • South Asia & Pacific
    • India
    • ASEAN
    • Australia & New Zealand
    • Rest of South Asia & Pacific
  • Latin America
    • Brazil
    • Chile
    • Rest of Latin America
  • Middle East & Africa
    • Kingdom of Saudi Arabia
    • Other GCC Countries
    • Turkiye
    • South Africa
    • Other African Union
    • Rest of Middle East & Africa

Frequently Asked Questions

What is the projected CAGR for the global plant-based snacks market from 2025 to 2035?

The global plant-based snacks market is expected to grow at a CAGR of 8.2% during the forecast period of 2025 to 2035.

What is the anticipated market value of the global plant-based snacks market by 2035?

The market is projected to reach a value of approximately USD 92.9 billion by 2035.

Which product type segment is expected to experience the fastest growth in the global plant-based snacks market?

The plant-based snack bars segment is anticipated to witness the highest growth rate, driven by increasing consumer demand for convenient and nutritious snack options.

What factors are driving the growth of the global plant-based snacks market?

Key drivers include rising health consciousness, increasing adoption of vegan and vegetarian diets, and growing awareness of environmental sustainability.

Who are the key companies operating in the global plant-based snacks market?

Major players in the market include Amy's Kitchen Inc., Beyond Meat Inc., Danone S.A., Hain Celestial Group, Inc., Nestlé S.A., and PepsiCo, Inc.

Table of Content

  1. Executive Summary
  2. Industry Introduction, including Taxonomy and Market Definition
  3. Trends and Success Factors, including Macro-economic Factors, Market Dynamics, and Recent Industry Developments
  4. Global Market Demand Analysis 2020 to 2024 and Forecast 2025 to 2035, including Historical Analysis and Future Projections
  5. Pricing Analysis
  6. Global Market Analysis 2020 to 2024 and Forecast 2025 to 2035
    • Product Type
    • Packaging
    • Flavor
    • Distribution Channel
  7. By Product Type
    • Meat Alternative Snack
    • Cereal/Grain-based Snacks
    • Fruit and Nut Snacks
    • Plant-based Snack Bars
    • Wafers
    • Others
  8. By Packaging
    • Antiseptic
    • Wrappers
    • Bags
    • Tins
  9. By Flavor
    • Savory
    • Sweet
  10. By Distribution Channel
    • Direct
    • Indirect
      • Hypermarkets/Supermarkets
      • Convenience Store
      • Specialty Stores
      • Grocery Stores
      • Independent Retailers
      • Online Retailers
  11. By Region
    • North America
    • Latin America
    • Western Europe
    • Eastern Europe
    • East Asia
    • South Asia & Pacific
    • Central Asia
    • Russia and Belarus
    • Balkan & Baltic Countries
    • Middle East and Africa
  12. North America Sales Analysis 2020 to 2024 and Forecast 2025 to 2035, by Key Segments and Countries
  13. Latin America Sales Analysis 2020 to 2024 and Forecast 2025 to 2035, by Key Segments and Countries
  14. Western Europe Sales Analysis 2020 to 2024 and Forecast 2025 to 2035, by Key Segments and Countries
  15. Eastern Europe Sales Analysis 2020 to 2024 and Forecast 2025 to 2035, by Key Segments and Countries
  16. East Asia Sales Analysis 2020 to 2024 and Forecast 2025 to 2035, by Key Segments and Countries
  17. South Asia & Pacific Sales Analysis 2020 to 2024 and Forecast 2025 to 2035, by Key Segments and Countries
  18. Central Asia Sales Analysis 2020 to 2024 and Forecast 2025 to 2035, by Key Segments and Countries
  19. Russia and Belarus Sales Analysis 2020 to 2024 and Forecast 2025 to 2035, by Key Segments and Countries
  20. Balkan & Baltic Countries Sales Analysis 2020 to 2024 and Forecast 2025 to 2035, by Key Segments and Countries
  21. Middle East and Africa Sales Analysis 2020 to 2024 and Forecast 2025 to 2035, by Key Segments and Countries
  22. Sales Forecast to 2035 by Product Type, Packaging, Flavor, and Distribution Channel for 30 Countries
  23. Competitive Assessment, Company Share Analysis by Key Players, and Competition Dashboard
  24. Company Profile
    • Amy's Kitchen Inc.
    • Beyond Meat Inc.
    • Danone S.A.
    • Hain Celestial Group, Inc.
    • Nestlé S.A.
    • PepsiCo, Inc.
    • Unilever
    • Conagra Brands, Inc.
    • General Mills, Inc.
    • Blue Diamond Growers

List of Tables

  • Table 1: Global Market Value (USD Billion) Forecast by Region, 2020-2035
  • Table 2: Global Market Volume (Units) Forecast by Region, 2020-2035
  • Table 3: Global Market Value (USD Billion) Forecast by Product Type, 2020-2035
  • Table 4: Global Market Volume (Units) Forecast by Product Type, 2020-2035
  • Table 5: Global Market Value (USD Billion) Forecast by Packaging, 2020-2035
  • Table 6: Global Market Volume (Units) Forecast by Packaging, 2020-2035
  • Table 7: Global Market Value (USD Billion) Forecast by Flavor, 2020-2035
  • Table 8: Global Market Volume (Units) Forecast by Flavor, 2020-2035
  • Table 9: Global Market Value (USD Billion) Forecast by Distribution Channel, 2020-2035
  • Table 10: Global Market Volume (Units) Forecast by Distribution Channel, 2020-2035
  • Table 11: North America Market Value (USD Billion) Forecast by Country, 2020-2035
  • Table 12: North America Market Volume (Units) Forecast by Country, 2020-2035
  • Table 13: North America Market Value (USD Billion) Forecast by Product Type, 2020-2035
  • Table 14: North America Market Volume (Units) Forecast by Product Type, 2020-2035
  • Table 15: North America Market Value (USD Billion) Forecast by Packaging, 2020-2035
  • Table 16: North America Market Volume (Units) Forecast by Packaging, 2020-2035
  • Table 17: North America Market Value (USD Billion) Forecast by Flavor, 2020-2035
  • Table 18: North America Market Volume (Units) Forecast by Flavor, 2020-2035
  • Table 19: North America Market Value (USD Billion) Forecast by Distribution Channel, 2020-2035
  • Table 20: North America Market Volume (Units) Forecast by Distribution Channel, 2020-2035
  • Table 21: Latin America Market Value (USD Billion) Forecast by Country, 2020-2035
  • Table 22: Latin America Market Volume (Units) Forecast by Country, 2020-2035
  • Table 23: Latin America Market Value (USD Billion) Forecast by Product Type, 2020-2035
  • Table 24: Latin America Market Volume (Units) Forecast by Product Type, 2020-2035
  • Table 25: Latin America Market Value (USD Billion) Forecast by Packaging, 2020-2035
  • Table 26: Latin America Market Volume (Units) Forecast by Packaging, 2020-2035
  • Table 27: Latin America Market Value (USD Billion) Forecast by Flavor, 2020-2035
  • Table 28: Latin America Market Volume (Units) Forecast by Flavor, 2020-2035
  • Table 29: Latin America Market Value (USD Billion) Forecast by Distribution Channel, 2020-2035
  • Table 30: Latin America Market Volume (Units) Forecast by Distribution Channel, 2020-2035
  • Table 31: Europe Market Value (USD Billion) Forecast by Country, 2020-2035
  • Table 32: Europe Market Volume (Units) Forecast by Country, 2020-2035
  • Table 33: Europe Market Value (USD Billion) Forecast by Product Type, 2020-2035
  • Table 34: Europe Market Volume (Units) Forecast by Product Type, 2020-2035
  • Table 35: Europe Market Value (USD Billion) Forecast by Packaging, 2020-2035
  • Table 36: Europe Market Volume (Units) Forecast by Packaging, 2020-2035
  • Table 37: Europe Market Value (USD Billion) Forecast by Flavor, 2020-2035
  • Table 38: Europe Market Volume (Units) Forecast by Flavor, 2020-2035
  • Table 39: Europe Market Value (USD Billion) Forecast by Distribution Channel, 2020-2035
  • Table 40: Europe Market Volume (Units) Forecast by Distribution Channel, 2020-2035
  • Table 41: East Asia Market Value (USD Billion) Forecast by Country, 2020-2035
  • Table 42: East Asia Market Volume (Units) Forecast by Country, 2020-2035
  • Table 43: East Asia Market Value (USD Billion) Forecast by Product Type, 2020-2035
  • Table 44: East Asia Market Volume (Units) Forecast by Product Type, 2020-2035
  • Table 45: East Asia Market Value (USD Billion) Forecast by Packaging, 2020-2035
  • Table 46: East Asia Market Volume (Units) Forecast by Packaging, 2020-2035
  • Table 47: East Asia Market Value (USD Billion) Forecast by Flavor, 2020-2035
  • Table 48: East Asia Market Volume (Units) Forecast by Flavor, 2020-2035
  • Table 49: East Asia Market Value (USD Billion) Forecast by Distribution Channel, 2020-2035
  • Table 50: East Asia Market Volume (Units) Forecast by Distribution Channel, 2020-2035
  • Table 51: South Asia & Pacific Market Value (USD Billion) Forecast by Country, 2020-2035
  • Table 52: South Asia & Pacific Market Volume (Units) Forecast by Country, 2020-2035
  • Table 53: South Asia & Pacific Market Value (USD Billion) Forecast by Product Type, 2020-2035
  • Table 54: South Asia & Pacific Market Volume (Units) Forecast by Product Type, 2020-2035
  • Table 55: South Asia & Pacific Market Value (USD Billion) Forecast by Packaging, 2020-2035
  • Table 56: South Asia & Pacific Market Volume (Units) Forecast by Packaging, 2020-2035
  • Table 57: South Asia & Pacific Market Value (USD Billion) Forecast by Flavor, 2020-2035
  • Table 58: South Asia & Pacific Market Volume (Units) Forecast by Flavor, 2020-2035
  • Table 59: South Asia & Pacific Market Value (USD Billion) Forecast by Distribution Channel, 2020-2035
  • Table 60: South Asia & Pacific Market Volume (Units) Forecast by Distribution Channel, 2020-2035
  • Table 61: Middle East & Africa Market Value (USD Billion) Forecast by Country, 2020-2035
  • Table 62: Middle East & Africa Market Volume (Units) Forecast by Country, 2020-2035
  • Table 63: Middle East & Africa Market Value (USD Billion) Forecast by Product Type, 2020-2035
  • Table 64: Middle East & Africa Market Volume (Units) Forecast by Product Type, 2020-2035
  • Table 65: Middle East & Africa Market Value (USD Billion) Forecast by Packaging, 2020-2035
  • Table 66: Middle East & Africa Market Volume (Units) Forecast by Packaging, 2020-2035
  • Table 67: Middle East & Africa Market Value (USD Billion) Forecast by Flavor, 2020-2035
  • Table 68: Middle East & Africa Market Volume (Units) Forecast by Flavor, 2020-2035
  • Table 69: Middle East & Africa Market Value (USD Billion) Forecast by Distribution Channel, 2020-2035
  • Table 70: Middle East & Africa Market Volume (Units) Forecast by Distribution Channel, 2020-2035
  • Table 71: U.S. Market Value (USD Billion) Forecast by Product Type, 2020-2035
  • Table 72: U.S. Market Volume (Units) Forecast by Product Type, 2020-2035
  • Table 73: U.S. Market Value (USD Billion) Forecast by Packaging, 2020-2035
  • Table 74: U.S. Market Volume (Units) Forecast by Packaging, 2020-2035
  • Table 75: U.S. Market Value (USD Billion) Forecast by Flavor, 2020-2035
  • Table 76: U.S. Market Volume (Units) Forecast by Flavor, 2020-2035
  • Table 77: U.S. Market Value (USD Billion) Forecast by Distribution Channel, 2020-2035
  • Table 78: U.S. Market Volume (Units) Forecast by Distribution Channel, 2020-2035
  • Table 79: Germany Market Value (USD Billion) Forecast by Product Type, 2020-2035
  • Table 80: Germany Market Volume (Units) Forecast by Product Type, 2020-2035
  • Table 81: Germany Market Value (USD Billion) Forecast by Packaging, 2020-2035
  • Table 82: Germany Market Volume (Units) Forecast by Packaging, 2020-2035
  • Table 83: Germany Market Value (USD Billion) Forecast by Flavor, 2020-2035
  • Table 84: Germany Market Volume (Units) Forecast by Flavor, 2020-2035
  • Table 85: Germany Market Value (USD Billion) Forecast by Distribution Channel, 2020-2035
  • Table 86: Germany Market Volume (Units) Forecast by Distribution Channel, 2020-2035
  • Table 87: U.K. Market Value (USD Billion) Forecast by Product Type, 2020-2035
  • Table 88: U.K. Market Volume (Units) Forecast by Product Type, 2020-2035
  • Table 89: U.K. Market Value (USD Billion) Forecast by Packaging, 2020-2035
  • Table 90: U.K. Market Volume (Units) Forecast by Packaging, 2020-2035
  • Table 91: U.K. Market Value (USD Billion) Forecast by Flavor, 2020-2035
  • Table 92: U.K. Market Volume (Units) Forecast by Flavor, 2020-2035
  • Table 93: U.K. Market Value (USD Billion) Forecast by Distribution Channel, 2020-2035
  • Table 94: U.K. Market Volume (Units) Forecast by Distribution Channel, 2020-2035
  • Table 95: France Market Value (USD Billion) Forecast by Product Type, 2020-2035
  • Table 96: France Market Volume (Units) Forecast by Product Type, 2020-2035
  • Table 97: France Market Value (USD Billion) Forecast by Packaging, 2020-2035
  • Table 98: France Market Volume (Units) Forecast by Packaging, 2020-2035
  • Table 99: France Market Value (USD Billion) Forecast by Flavor, 2020-2035
  • Table 100: France Market Volume (Units) Forecast by Flavor, 2020-2035
  • Table 101: France Market Value (USD Billion) Forecast by Distribution Channel, 2020-2035
  • Table 102: France Market Volume (Units) Forecast by Distribution Channel, 2020-2035
  • Table 103: Spain Market Value (USD Billion) Forecast by Product Type, 2020-2035
  • Table 104: Spain Market Volume (Units) Forecast by Product Type, 2020-2035
  • Table 105: Spain Market Value (USD Billion) Forecast by Packaging, 2020-2035
  • Table 106: Spain Market Volume (Units) Forecast by Packaging, 2020-2035
  • Table 107: Spain Market Value (USD Billion) Forecast by Flavor, 2020-2035
  • Table 108: Spain Market Volume (Units) Forecast by Flavor, 2020-2035
  • Table 109: Spain Market Value (USD Billion) Forecast by Distribution Channel, 2020-2035
  • Table 110: Spain Market Volume (Units) Forecast by Distribution Channel, 2020-2035
  • Table 111: Japan Market Value (USD Billion) Forecast by Product Type, 2020-2035
  • Table 112: Japan Market Volume (Units) Forecast by Product Type, 2020-2035
  • Table 113: Japan Market Value (USD Billion) Forecast by Packaging, 2020-2035
  • Table 114: Japan Market Volume (Units) Forecast by Packaging, 2020-2035
  • Table 115: Japan Market Value (USD Billion) Forecast by Flavor, 2020-2035
  • Table 116: Japan Market Volume (Units) Forecast by Flavor, 2020-2035
  • Table 117: Japan Market Value (USD Billion) Forecast by Distribution Channel, 2020-2035
  • Table 118: Japan Market Volume (Units) Forecast by Distribution Channel, 2020-2035
  • Table 119: South Korea Market Value (USD Billion) Forecast by Product Type, 2020-2035
  • Table 120: South Korea Market Volume (Units) Forecast by Product Type, 2020-2035
  • Table 121: South Korea Market Value (USD Billion) Forecast by Packaging, 2020-2035
  • Table 122: South Korea Market Volume (Units) Forecast by Packaging, 2020-2035
  • Table 123: South Korea Market Value (USD Billion) Forecast by Flavor, 2020-2035
  • Table 124: South Korea Market Volume (Units) Forecast by Flavor, 2020-2035
  • Table 125: South Korea Market Value (USD Billion) Forecast by Distribution Channel, 2020-2035
  • Table 126: South Korea Market Volume (Units) Forecast by Distribution Channel, 2020-2035
  • Table 127: India Market Value (USD Billion) Forecast by Product Type, 2020-2035
  • Table 128: India Market Volume (Units) Forecast by Product Type, 2020-2035
  • Table 129: India Market Value (USD Billion) Forecast by Packaging, 2020-2035
  • Table 130: India Market Volume (Units) Forecast by Packaging, 2020-2035
  • Table 131: India Market Value (USD Billion) Forecast by Flavor, 2020-2035
  • Table 132: India Market Volume (Units) Forecast by Flavor, 2020-2035
  • Table 133: India Market Value (USD Billion) Forecast by Distribution Channel, 2020-2035
  • Table 134: India Market Volume (Units) Forecast by Distribution Channel, 2020-2035
  • Table 135: Brazil Market Value (USD Billion) Forecast by Product Type, 2020-2035
  • Table 136: Brazil Market Volume (Units) Forecast by Product Type, 2020-2035
  • Table 137: Brazil Market Value (USD Billion) Forecast by Packaging, 2020-2035
  • Table 138: Brazil Market Volume (Units) Forecast by Packaging, 2020-2035
  • Table 139: Brazil Market Value (USD Billion) Forecast by Flavor, 2020-2035
  • Table 140: Brazil Market Volume (Units) Forecast by Flavor, 2020-2035
  • Table 141: Brazil Market Value (USD Billion) Forecast by Distribution Channel, 2020-2035
  • Table 142: Brazil Market Volume (Units) Forecast by Distribution Channel, 2020-2035
  • Table 143: Australia Market Value (USD Billion) Forecast by Product Type, 2020-2035
  • Table 144: Australia Market Volume (Units) Forecast by Product Type, 2020-2035
  • Table 145: Australia Market Value (USD Billion) Forecast by Packaging, 2020-2035
  • Table 146: Australia Market Volume (Units) Forecast by Packaging, 2020-2035
  • Table 147: Australia Market Value (USD Billion) Forecast by Flavor, 2020-2035
  • Table 148: Australia Market Volume (Units) Forecast by Flavor, 2020-2035
  • Table 149: Australia Market Value (USD Billion) Forecast by Distribution Channel, 2020-2035
  • Table 150: Australia Market Volume (Units) Forecast by Distribution Channel, 2020-2035

List of Figures

  • Figure 1: Global Market Value (USD Billion) by Product Type, 2025-2035
  • Figure 2: Global Market Value (USD Billion) by Packaging, 2025-2035
  • Figure 3: Global Market Value (USD Billion) by Flavor, 2025-2035
  • Figure 4: Global Market Value (USD Billion) by Distribution Channel, 2025-2035
  • Figure 5: Global Market Value (USD Billion) by Region, 2025-2035
  • Figure 6: Global Market Value (USD Billion) Analysis by Region, 2020-2035
  • Figure 7: Global Market Volume (Units) Analysis by Region, 2020-2035
  • Figure 8: Global Market Value Share (%) and BPS Analysis by Region, 2025-2035
  • Figure 9: Global Market Y-o-Y Growth (%) Projections by Region, 2025-2035
  • Figure 10: Global Market Value (USD Billion) Analysis by Product Type, 2020-2035
  • Figure 11: Global Market Volume (Units) Analysis by Product Type, 2020-2035
  • Figure 12: Global Market Value Share (%) and BPS Analysis by Product Type, 2025-2035
  • Figure 13: Global Market Y-o-Y Growth (%) Projections by Product Type, 2025-2035
  • Figure 14: Global Market Value (USD Billion) Analysis by Packaging, 2020-2035
  • Figure 15: Global Market Volume (Units) Analysis by Packaging, 2020-2035
  • Figure 16: Global Market Value Share (%) and BPS Analysis by Packaging, 2025-2035
  • Figure 17: Global Market Y-o-Y Growth (%) Projections by Packaging, 2025-2035
  • Figure 18: Global Market Value (USD Billion) Analysis by Flavor, 2020-2035
  • Figure 19: Global Market Volume (Units) Analysis by Flavor, 2020-2035
  • Figure 20: Global Market Value Share (%) and BPS Analysis by Flavor, 2025-2035
  • Figure 21: Global Market Y-o-Y Growth (%) Projections by Flavor, 2025-2035
  • Figure 22: Global Market Value (USD Billion) Analysis by Distribution Channel, 2020-2035
  • Figure 23: Global Market Volume (Units) Analysis by Distribution Channel, 2020-2035
  • Figure 24: Global Market Value Share (%) and BPS Analysis by Distribution Channel, 2025-2035
  • Figure 25: Global Market Y-o-Y Growth (%) Projections by Distribution Channel, 2025-2035
  • Figure 26: Global Market Attractiveness by Product Type, 2025-2035
  • Figure 27: Global Market Attractiveness by Packaging, 2025-2035
  • Figure 28: Global Market Attractiveness by Flavor, 2025-2035
  • Figure 29: Global Market Attractiveness by Distribution Channel, 2025-2035
  • Figure 30: Global Market Attractiveness by Region, 2025-2035
  • Figure 31: North America Market Value (USD Billion) by Product Type, 2025-2035
  • Figure 32: North America Market Value (USD Billion) by Packaging, 2025-2035
  • Figure 33: North America Market Value (USD Billion) by Flavor, 2025-2035
  • Figure 34: North America Market Value (USD Billion) by Distribution Channel, 2025-2035
  • Figure 35: North America Market Value (USD Billion) by Country, 2025-2035
  • Figure 36: North America Market Value (USD Billion) Analysis by Country, 2020-2035
  • Figure 37: North America Market Volume (Units) Analysis by Country, 2020-2035
  • Figure 38: North America Market Value Share (%) and BPS Analysis by Country, 2025-2035
  • Figure 39: North America Market Y-o-Y Growth (%) Projections by Country, 2025-2035
  • Figure 40: North America Market Value (USD Billion) Analysis by Product Type, 2020-2035
  • Figure 41: North America Market Volume (Units) Analysis by Product Type, 2020-2035
  • Figure 42: North America Market Value Share (%) and BPS Analysis by Product Type, 2025-2035
  • Figure 43: North America Market Y-o-Y Growth (%) Projections by Product Type, 2025-2035
  • Figure 44: North America Market Value (USD Billion) Analysis by Packaging, 2020-2035
  • Figure 45: North America Market Volume (Units) Analysis by Packaging, 2020-2035
  • Figure 46: North America Market Value Share (%) and BPS Analysis by Packaging, 2025-2035
  • Figure 47: North America Market Y-o-Y Growth (%) Projections by Packaging, 2025-2035
  • Figure 48: North America Market Value (USD Billion) Analysis by Flavor, 2020-2035
  • Figure 49: North America Market Volume (Units) Analysis by Flavor, 2020-2035
  • Figure 50: North America Market Value Share (%) and BPS Analysis by Flavor, 2025-2035
  • Figure 51: North America Market Y-o-Y Growth (%) Projections by Flavor, 2025-2035
  • Figure 52: North America Market Value (USD Billion) Analysis by Distribution Channel, 2020-2035
  • Figure 53: North America Market Volume (Units) Analysis by Distribution Channel, 2020-2035
  • Figure 54: North America Market Value Share (%) and BPS Analysis by Distribution Channel, 2025-2035
  • Figure 55: North America Market Y-o-Y Growth (%) Projections by Distribution Channel, 2025-2035
  • Figure 56: North America Market Attractiveness by Product Type, 2025-2035
  • Figure 57: North America Market Attractiveness by Packaging, 2025-2035
  • Figure 58: North America Market Attractiveness by Flavor, 2025-2035
  • Figure 59: North America Market Attractiveness by Distribution Channel, 2025-2035
  • Figure 60: North America Market Attractiveness by Country, 2025-2035
  • Figure 61: Latin America Market Value (USD Billion) by Product Type, 2025-2035
  • Figure 62: Latin America Market Value (USD Billion) by Packaging, 2025-2035
  • Figure 63: Latin America Market Value (USD Billion) by Flavor, 2025-2035
  • Figure 64: Latin America Market Value (USD Billion) by Distribution Channel, 2025-2035
  • Figure 65: Latin America Market Value (USD Billion) by Country, 2025-2035
  • Figure 66: Latin America Market Value (USD Billion) Analysis by Country, 2020-2035
  • Figure 67: Latin America Market Volume (Units) Analysis by Country, 2020-2035
  • Figure 68: Latin America Market Value Share (%) and BPS Analysis by Country, 2025-2035
  • Figure 69: Latin America Market Y-o-Y Growth (%) Projections by Country, 2025-2035
  • Figure 70: Latin America Market Value (USD Billion) Analysis by Product Type, 2020-2035
  • Figure 71: Latin America Market Volume (Units) Analysis by Product Type, 2020-2035
  • Figure 72: Latin America Market Value Share (%) and BPS Analysis by Product Type, 2025-2035
  • Figure 73: Latin America Market Y-o-Y Growth (%) Projections by Product Type, 2025-2035
  • Figure 74: Latin America Market Value (USD Billion) Analysis by Packaging, 2020-2035
  • Figure 75: Latin America Market Volume (Units) Analysis by Packaging, 2020-2035
  • Figure 76: Latin America Market Value Share (%) and BPS Analysis by Packaging, 2025-2035
  • Figure 77: Latin America Market Y-o-Y Growth (%) Projections by Packaging, 2025-2035
  • Figure 78: Latin America Market Value (USD Billion) Analysis by Flavor, 2020-2035
  • Figure 79: Latin America Market Volume (Units) Analysis by Flavor, 2020-2035
  • Figure 80: Latin America Market Value Share (%) and BPS Analysis by Flavor, 2025-2035
  • Figure 81: Latin America Market Y-o-Y Growth (%) Projections by Flavor, 2025-2035
  • Figure 82: Latin America Market Value (USD Billion) Analysis by Distribution Channel, 2020-2035
  • Figure 83: Latin America Market Volume (Units) Analysis by Distribution Channel, 2020-2035
  • Figure 84: Latin America Market Value Share (%) and BPS Analysis by Distribution Channel, 2025-2035
  • Figure 85: Latin America Market Y-o-Y Growth (%) Projections by Distribution Channel, 2025-2035
  • Figure 86: Latin America Market Attractiveness by Product Type, 2025-2035
  • Figure 87: Latin America Market Attractiveness by Packaging, 2025-2035
  • Figure 88: Latin America Market Attractiveness by Flavor, 2025-2035
  • Figure 89: Latin America Market Attractiveness by Distribution Channel, 2025-2035
  • Figure 90: Latin America Market Attractiveness by Country, 2025-2035
  • Figure 91: Europe Market Value (USD Billion) by Product Type, 2025-2035
  • Figure 92: Europe Market Value (USD Billion) by Packaging, 2025-2035
  • Figure 93: Europe Market Value (USD Billion) by Flavor, 2025-2035
  • Figure 94: Europe Market Value (USD Billion) by Distribution Channel, 2025-2035
  • Figure 95: Europe Market Value (USD Billion) by Country, 2025-2035
  • Figure 96: Europe Market Value (USD Billion) Analysis by Country, 2020-2035
  • Figure 97: Europe Market Volume (Units) Analysis by Country, 2020-2035
  • Figure 98: Europe Market Value Share (%) and BPS Analysis by Country, 2025-2035
  • Figure 99: Europe Market Y-o-Y Growth (%) Projections by Country, 2025-2035
  • Figure 100: Europe Market Value (USD Billion) Analysis by Product Type, 2020-2035
  • Figure 101: Europe Market Volume (Units) Analysis by Product Type, 2020-2035
  • Figure 102: Europe Market Value Share (%) and BPS Analysis by Product Type, 2025-2035
  • Figure 103: Europe Market Y-o-Y Growth (%) Projections by Product Type, 2025-2035
  • Figure 104: Europe Market Value (USD Billion) Analysis by Packaging, 2020-2035
  • Figure 105: Europe Market Volume (Units) Analysis by Packaging, 2020-2035
  • Figure 106: Europe Market Value Share (%) and BPS Analysis by Packaging, 2025-2035
  • Figure 107: Europe Market Y-o-Y Growth (%) Projections by Packaging, 2025-2035
  • Figure 108: Europe Market Value (USD Billion) Analysis by Flavor, 2020-2035
  • Figure 109: Europe Market Volume (Units) Analysis by Flavor, 2020-2035
  • Figure 110: Europe Market Value Share (%) and BPS Analysis by Flavor, 2025-2035
  • Figure 111: Europe Market Y-o-Y Growth (%) Projections by Flavor, 2025-2035
  • Figure 112: Europe Market Value (USD Billion) Analysis by Distribution Channel, 2020-2035
  • Figure 113: Europe Market Volume (Units) Analysis by Distribution Channel, 2020-2035
  • Figure 114: Europe Market Value Share (%) and BPS Analysis by Distribution Channel, 2025-2035
  • Figure 115: Europe Market Y-o-Y Growth (%) Projections by Distribution Channel, 2025-2035
  • Figure 116: Europe Market Attractiveness by Product Type, 2025-2035
  • Figure 117: Europe Market Attractiveness by Packaging, 2025-2035
  • Figure 118: Europe Market Attractiveness by Flavor, 2025-2035
  • Figure 119: Europe Market Attractiveness by Distribution Channel, 2025-2035
  • Figure 120: Europe Market Attractiveness by Country, 2025-2035
  • Figure 121: East Asia Market Value (USD Billion) by Product Type, 2025-2035
  • Figure 122: East Asia Market Value (USD Billion) by Packaging, 2025-2035
  • Figure 123: East Asia Market Value (USD Billion) by Flavor, 2025-2035
  • Figure 124: East Asia Market Value (USD Billion) by Distribution Channel, 2025-2035
  • Figure 125: East Asia Market Value (USD Billion) by Country, 2025-2035
  • Figure 126: East Asia Market Value (USD Billion) Analysis by Country, 2020-2035
  • Figure 127: East Asia Market Volume (Units) Analysis by Country, 2020-2035
  • Figure 128: East Asia Market Value Share (%) and BPS Analysis by Country, 2025-2035
  • Figure 129: East Asia Market Y-o-Y Growth (%) Projections by Country, 2025-2035
  • Figure 130: East Asia Market Value (USD Billion) Analysis by Product Type, 2020-2035
  • Figure 131: East Asia Market Volume (Units) Analysis by Product Type, 2020-2035
  • Figure 132: East Asia Market Value Share (%) and BPS Analysis by Product Type, 2025-2035
  • Figure 133: East Asia Market Y-o-Y Growth (%) Projections by Product Type, 2025-2035
  • Figure 134: East Asia Market Value (USD Billion) Analysis by Packaging, 2020-2035
  • Figure 135: East Asia Market Volume (Units) Analysis by Packaging, 2020-2035
  • Figure 136: East Asia Market Value Share (%) and BPS Analysis by Packaging, 2025-2035
  • Figure 137: East Asia Market Y-o-Y Growth (%) Projections by Packaging, 2025-2035
  • Figure 138: East Asia Market Value (USD Billion) Analysis by Flavor, 2020-2035
  • Figure 139: East Asia Market Volume (Units) Analysis by Flavor, 2020-2035
  • Figure 140: East Asia Market Value Share (%) and BPS Analysis by Flavor, 2025-2035
  • Figure 141: East Asia Market Y-o-Y Growth (%) Projections by Flavor, 2025-2035
  • Figure 142: East Asia Market Value (USD Billion) Analysis by Distribution Channel, 2020-2035
  • Figure 143: East Asia Market Volume (Units) Analysis by Distribution Channel, 2020-2035
  • Figure 144: East Asia Market Value Share (%) and BPS Analysis by Distribution Channel, 2025-2035
  • Figure 145: East Asia Market Y-o-Y Growth (%) Projections by Distribution Channel, 2025-2035
  • Figure 146: East Asia Market Attractiveness by Product Type, 2025-2035
  • Figure 147: East Asia Market Attractiveness by Packaging, 2025-2035
  • Figure 148: East Asia Market Attractiveness by Flavor, 2025-2035
  • Figure 149: East Asia Market Attractiveness by Distribution Channel, 2025-2035
  • Figure 150: East Asia Market Attractiveness by Country, 2025-2035
Dashboard
Dashboard
Dashboard
Dashboard
Dashboard
Dashboard

Full Research Suite comprises of:

Market outlook & trends analysis

Market outlook & trends analysis

Interviews & case studies

Interviews & case studies

Strategic recommendations

Strategic recommendations

Vendor profiles & capabilities analysis

Vendor profiles & capabilities analysis

5-year forecasts

5-year forecasts

8 regions and 60+ country-level data splits

8 regions and 60+ country-level data splits

Market segment data splits

Market segment data splits

12 months of continuous data updates

12 months of continuous data updates

DELIVERED AS:

PDF EXCEL ONLINE

Full Research Suite


$3500

$5000

$6500

Buy Report Now
Similar Industry Reports

Similar Industry Reports

Demand for Plant-based Snacks in EU

Demand for Plant-based Snacks in EU Size and Share Forecast Outlook 2025 to 2035

CBD Snacks Market
CBD Snacks Market

CBD Snacks Market Size and Share Forecast Outlook 2025 to 2035

Kid Snacks Market
Kid Snacks Market

Kid Snacks Market Analysis by Source, Type, and Distribution Channel Through 2035

Pet Snacks and Treats Market

Pet Snacks and Treats Market Analysis by Product, Pet Type, Distribution Channel, and Region Through 2035

Baby Snacks Market
Baby Snacks Market

Baby Snacks Market Analysis - Size, Share, & Forecast Outlook 2025 to 2035

Meat Snacks Market
Meat Snacks Market

Meat Snacks Market Trends – Protein-Packed & Industry Growth 2024-2034

Dairy Snacks Market
Dairy Snacks Market

Dairy Snacks Market Growth - Consumer Preferences & Industry Trends 2025 to 2035

Fruit Snacks Market Share Analysis

Competitive Breakdown of Fruit Snacks Suppliers

Fruit Snacks Market
Fruit Snacks Market

Fruit Snacks Market Analysis by Product Type, Nature, Flavour Type, Distribution Channel Type, and Processing Type Through 2035

Frozen Snacks Market

Frozen Snacks Market Analysis - Size, Share, and Forecast Outlook for 2025 to 2035

Healthy Snacks Market

Healthy Snacks Market Size and Share Forecast Outlook 2025 to 2035

Protein Snacks Market

Protein Snacks Market Growth - Demand, Trends & Industry Forecast 2025 to 2035

Extruded Snacks Market

Extruded Snacks Market Size and Share Forecast Outlook 2025 to 2035

Oat-based Snacks Market

Oat-based Snacks Market Size and Share Forecast Outlook 2025 to 2035

Pregnancy Snacks Market

Pregnancy Snacks Market Analysis by Product Type, Nutritional Content, Distribution Channel, Packaging Format and Stage of Pregnancy Flavors Through 2035

Dog Food and Snacks Market

Dog Food and Snacks Market Size and Share Forecast Outlook 2025 to 2035

Insect-Based Snacks Market

Insect-Based Snacks Market Analysis - Size, Share & Forecast 2025 to 2035

Refrigerated Snacks Market

Refrigerated Snacks Market Trends - Healthy & Fresh Innovations 2025 to 2035

Better for You Snacks Market

Better for You Snacks Market Analysis - Size, Share, and Forecast Outlook 2025 to 2035

Mushroom-Based Snacks Market

Mushroom-Based Snacks Market Analysis - Size and Share Forecast Outlook 2025 to 2035

Future Market Insights

Plant-based Snacks Market

Chat With MaRIA

Chat With

MaRIA

Hi There, I am MaRIA, Your Market Research Intelligence Assistant. How may I help you?