Insect-Based Snacks Market Size and Share Forecast Outlook 2025 to 2035

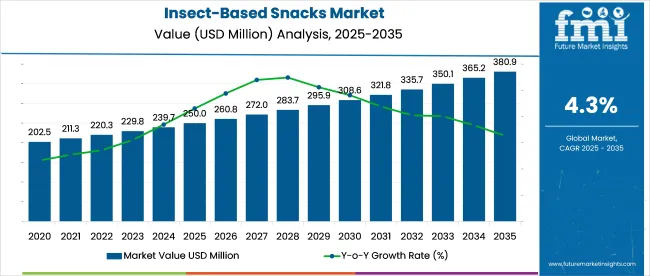
The insect-based snacks market is valued at USD 250 million in 2025 and is projected to reach USD 380.9 million by 2035, registering a CAGR of 4.3%. Global demand has been shaped by rising interest in high-protein, shelf-stable alternatives such as cricket bars, mealworm chips, and grasshopper-based savory items.
Quick Stats of the Insect-Based Snacks Market

  • Market Size (2025): USD 250 million
  • Market Value (2035): USD 380.9 million
  • Forecast CAGR (2025 to 2035): 4.3%
  • Leading Segment: Crickets (40%)
  • Key Growth Region: Europe (United Kingdom)
  • Key Players: Chapul, EXO Protein, Jimini’s, Eat Grub, Cricket One

Insect Based Snacks Market

Powdered insect flours are being favored for formulation in baked goods and extruded snacks, while whole-insect formats remain confined to niche channels. It is argued that brands offering flavored variants, transparent sourcing, and allergen labeling will gain faster acceptance.

However, inconsistent regulatory approvals and cultural resistance are being cited as growth inhibitors unless broader consumer education and standardized safety frameworks are prioritized. Market consolidation is expected as specialty startups are acquired by larger food ingredient firms.

In 2023, EdoardoImparato, Co-Founder and CEO of Small Giants, shared the motivation behind the company’s foray into insect-based snacks, highlighting a personal and strategic shift toward sustainable protein alternatives. Inspired by the FAO’s landmark 2013 report on edible insects, Small Giants developed cricket-based crackers and snacks designed to appeal to eco-conscious and protein-seeking consumers.

The brand has since expanded across several European retailers and online channels. Reflecting on the company’s origins, EdoardoImparato stated, “Our insect-based snacks were born from our shared commitment to sustainability. Both my cofounder Francesco and I were reducing our meat consumptio. Our search for alternatives to protein led us to a 2013 FAO report titled ‘Edible Insects: Future prospects for food and feed security.’”

The insect-based snacks market holds a niche but growing share within its parent markets. In the snacks market, it accounts for approximately 1-2%, as insect-based snacks are a unique segment compared to traditional snacks like chips and nuts.

Within the alternative protein market, the share is around 5-7%, driven by the increasing demand for sustainable and high-protein food sources. In the sustainable food market, its share is about 4-6%, as insect-based products are considered environmentally friendly. In the functional foods market, the share is approximately 2-3%, due to their nutritional benefits. In the health and wellness food market, the share is around 3-5%, as insect-based snacks are gaining popularity for their high protein and low-fat content.

Analyzing Insect-Based Snacks Market by Top Investment Segments

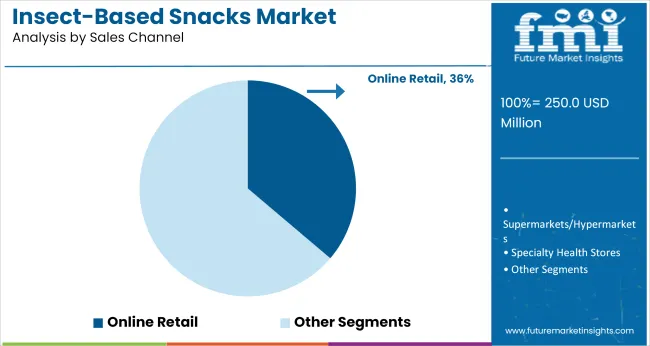
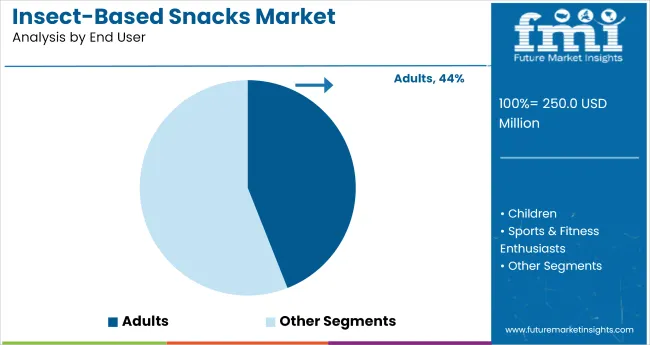
In 2025, the insect-based snacks market is expected to be led by crickets, which will account for 40% of the market. Protein bars will dominate product types with 27.5%, while online retail channels will capture 36% of the sales. Adults will remain the largest consumer group, comprising 44% of the end-user market.
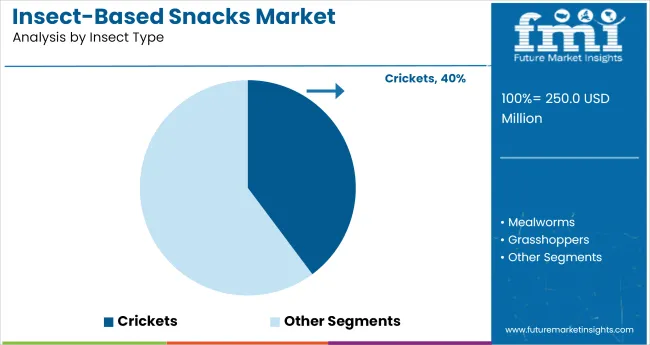
Crickets lead insect type segment with 40% market share

Insect Based Snacks Market Analysis By Insect Type

Crickets are expected to capture 40% of the insect-based snacks market in 2025, making them the leading insect type in this segment. Crickets are a preferred choice due to their high protein content, sustainability, and versatility in various snack products.

They are rich in essential amino acids, making them a valuable source of nutrition, especially for consumers looking for plant-based protein alternatives. As the demand for sustainable and nutrient-dense ingredients rises, crickets will continue to dominate the market for insect-based snacks, particularly in protein bars, chips, and other snack formats.

  • High protein content and nutritional value make crickets a popular choice
  • Sustainable and eco-friendly sourcing appeals to health-conscious and environmentally aware consumers
  • Versatile ingredient used in a wide range of snack products, especially protein bars

Protein bars lead product type segment with 27.5% market share

Protein bars are projected to capture 27.5% of the market share in 2025, making them the dominant product type in the insect-based snacks market. These bars provide a convenient, on-the-go snack option that appeals to health-conscious consumers, particularly those seeking high-protein, sustainable snacks.

Insect-based protein bars, using crickets or mealworms, offer a high-quality protein source while also appealing to those looking for environmentally friendly and clean-label options. The growing fitness and wellness trend will continue to drive demand for protein bars, making them a key segment in the market.
  • Convenient, high-protein snack option for busy, health-conscious consumers
  • Appeals to those seeking sustainable, clean-label ingredients in their snacks
  • Aligns with the growing demand for fitness-focused and eco-friendly snack options

Online retail dominates sales channel segment with 36% market share

Insect Based Snacks Market Analysis By Sales Channel

Online retail is expected to dominate the sales channel segment with 36% market share in 2025. The convenience and accessibility of online shopping, paired with the increasing consumer preference for sustainable and innovative food products, drive the growth of insect-based snacks in e-commerce platforms.

Online channels allow for easy comparison, direct-to-consumer sales, and the ability to target niche markets looking for specialty food products, such as insect-based snacks. The growing popularity of subscription-based models and direct brand marketing further supports the dominance of online retail in this market.
  • E-commerce provides convenient access to niche, sustainable products like insect-based snacks
  • Direct-to-consumer sales models and subscription services enhance brand loyalty
  • Expanding online presence supports broader reach and market penetration in global markets

Adults lead end-user segment with 44% market share

Insect Based Snacks Market Analysis By End User

Adults are projected to account for 44% of the market share in 2025, making them the largest consumer group for insect-based snacks. This segment's dominance is driven by the growing trend of health-conscious, environmentally aware adults seeking sustainable, high-protein, and nutrient-dense snack options.

The increasing awareness of the health benefits of insect protein, as well as the sustainability aspect of consuming insects, is influencing purchasing decisions. Adults, particularly those involved in fitness, wellness, and eco-friendly lifestyles, will continue to drive demand for insect-based snacks, especially in protein bars and snack foods.

  • Health-conscious and eco-aware adults drive demand for sustainable, high-protein snacks
  • Insect-based snacks offer a convenient, nutritious option for adult consumers
  • The growing focus on fitness, wellness, and sustainability will sustain market growth in this segment

Top Insect-Based Snacks Market Dynamics

The insect-based snacks market is expanding due to increasing consumer demand for alternative protein sources and the growing popularity of high-protein, low-fat diets. However, challenges such as cultural perceptions, regulatory hurdles, and supply chain complexities are hindering broader adoption.

Growing Interest in Alternative Protein Sources

The insect-based snacks market is experiencing growth driven by the increasing consumer interest in alternative protein sources. Insects, such as crickets and mealworms, offer a sustainable and efficient means of protein production.

They require fewer resources, such as water and land, compared to traditional livestock, and emit fewer greenhouse gases. This makes them an attractive option for consumers seeking environmentally friendly and nutritious snack alternatives. As awareness of these benefits spreads, the market for insect-based snacks is expected to continue its upward trajectory.

  • Alternative protein sources are gaining popularity among health-conscious consumers.
  • Sustainable production methods appeal to environmentally aware individuals.
  • Nutrient-rich profiles of insects make them a viable snack option.

Cultural Perceptions and Consumer Acceptance Challenges

Despite the benefits, the insect-based snacks market faces significant challenges related to cultural perceptions and consumer acceptance. In many Western cultures, the idea of consuming insects is met with skepticism and aversion.

This cultural barrier hinders the widespread adoption of insect-based snacks, even among individuals who are open to alternative protein sources. Overcoming these perceptions requires targeted education and marketing efforts to familiarize consumers with the benefits and safety of insect consumption.
  • Cultural perceptions often associate insects with uncleanliness.
  • Consumer acceptance is limited due to unfamiliarity and discomfort.
  • Educational initiatives are necessary to shift public attitudes.

Top Countries Normalizing, Diversifying, and Scaling Insect-Based Snacks

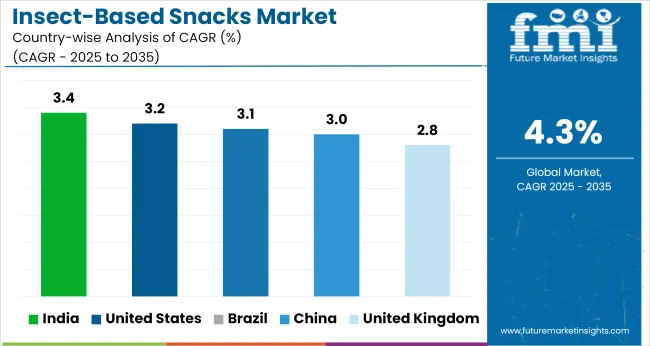
Insect Based Snacks Market Cagr Analysis By Country

Countries CAGR (2025 to 2035)
United States 3.2%
United Kingdom 2.8%
China 3%
India 3.4%
Brazil 3.1%

Global insect-based snacks market demand is projected to rise at a 4.3% value-based CAGR from 2025 to 2035. Of the five profiled markets out of 40 covered, the United Kingdom leads at 4.9%, followed by India at 3.5%, and China at 3.2%, while South Korea posts 3% and the United States records the slowest growth at 2.6%.

These rates translate to a growth premium of +13% for the United Kingdom, -18% for India, and -27% for the United States versus the baseline, while South Korea and China show more moderate growth. Divergence reflects local catalysts: growing interest in sustainable and protein-rich snacks in the United Kingdom, while more mature markets like the United States show slower adoption due to consumer resistance to insect-based food products.

India, China, and South Korea reflect more gradual but steady market expansion driven by increasing awareness of alternative protein sources.

Growth Analysis of Insect-Based Snacks Market in the United States

Sales of insect-based snacks in the United States are expected to grow at a CAGR of 2.6% through 2035. Adoption has remained niche due to regulatory uncertainty and limited consumer acceptance, especially in mainstream retail. However, interest in high-protein, low-footprint snacks is expanding among fitness enthusiasts and sustainability-conscious consumers.

Regional startups are introducing flavored cricket chips and larval protein bars through online channels. Co-branding with health influencers has created awareness in e-commerce platforms, though brick-and-mortar visibility remains low. Regulatory support from the FDA on edible insect labeling may shape future demand pathways. Expansion is occurring mostly through specialty retailers and wellness outlets.

  • Fitness-focused protein bars made from crickets have increased DTC visibility since 2023.
  • Plant-insect hybrid snack launches are targeting flexitarian buyers in California and Oregon.
  • Co-packers are offering pilot runs for cricket flour snacks to regional food startups.

Future Outlook for Insect-Based Snacks in the United Kingdom

Sales of insect-based snacks in the United Kingdom are forecasted to rise at a CAGR of 4.9% through 2035. The Food Standards Agency’s post-Brexit regulatory framework has accelerated novel food approvals, including edible insects. Retailers have expanded listings of insect granola bites and protein crisps in vegan sections.

Public interest has grown following national sustainability campaigns linking protein diversification to long-term food security. Taste trials and school awareness programs have supported normalization of insect-based ingredients. Direct-to-consumer models led by startups are leveraging the ethical protein narrative. Insect-based snacks are finding traction among flexitarian and adventure-eating segments.

  • Tesco and Sainsbury’s piloted mealworm and cricket snacks in health food aisles.
  • FSA novel food guidance streamlined approvals for grasshopper-based protein products.
  • E-commerce bundles featuring mixed insect snacks gained popularity in London metro areas.

Demand Forecast for Insect-Based Snacks in China

Demand for insect-based snacks in China is estimated to grow at a CAGR of 3.2% from 2025 to 2035. Traditional use of edible insects in regional cuisines has enabled smoother consumer transition into processed insect snacks. Major domestic brands have launched flavored silkworm crisps and beetle jerky under premium health snack lines.

Product development focuses on protein density and shelf stability, aligning with snacking-on-the-go trends. Although not yet mainstream in urban retail chains, interest is visible among health-oriented youth segments and specialty stores. Policy clarity on food labeling has helped consolidate supply chains and reduce import dependency for insect flours.

  • E-commerce portals in Shanghai and Shenzhen promoted grasshopper crackers for gym-goers.
  • Provincial campaigns in Hunan encouraged insect protein in school lunch programs.
  • Domestic players launched snack cubes with black soldier fly and soy blends.

Insect-Based Snacks Market Growth Outlook in India

India’s insect-based snacks market is projected to grow at a CAGR of 3.5% through 2035. Interest has risen within the wellness and functional snack segments, although cultural resistance and regulatory opacity have slowed commercialization. Startups are experimenting with low-dose cricket blends in baked snacks and protein-rich flours for rural outreach.

Ayurveda-aligned positioning is being tested for gut-friendly insect snacks. Trials are underway in institutional nutrition channels, targeting protein deficiency concerns. Consumer education, flavor adaptation, and religious dietary norms remain central to shaping the scale and speed of demand. Growth is expected to be strongest in e-commerce and curated nutrition kits.

  • IIT-led incubators are prototyping fortified snacks with edible insect components.
  • Cricket flour snacks are bundled with millet and lentil flours in protein kits.
  • Pilot sales have launched in Tier-II cities via nutrition awareness NGOs.

Analysis of Insect-Based Snacks Demand in South Korea

South Korea’s insect-based snacks market is projected to grow at a CAGR of 3.0% from 2025 to 2035. Government inclusion of insects in the national food code has accelerated product innovation in processed snacks. The popularity of novelty and extreme eating trends has enabled successful test launches of silkworm pupae chips and insect-infused chocolate bites.

Marketing has focused on high-protein and immunity-boosting traits to win over young professionals. However, scale remains limited outside niche consumer groups. Convenience stores and online platforms dominate distribution, with limited penetration in conventional grocery retail. Collaborations with culinary schools and televised food shows have expanded awareness.
  • Insect chocolate clusters marketed as “superfood snacks” gained traction among Gen Z.
  • Seoul-based food tech firms introduced silkworm and cricket snack bars in early 2024.
  • Online unboxing trends boosted short-term trials but didn’t convert to repeat buys.

Leading Insect-Based Snacks Market Suppliers

Insect Based Snacks Market Analysis By Company

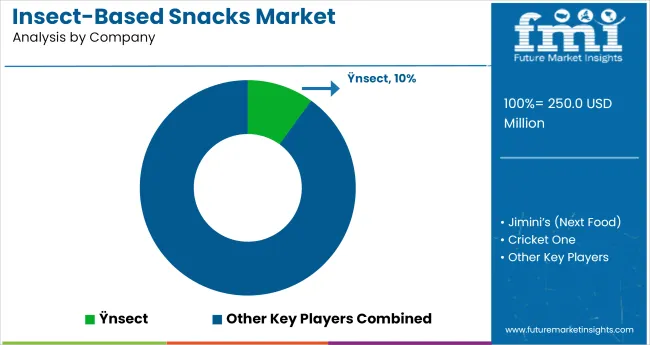
In the insect-based snacks market, appetite is being shaped by a balance of protein quality, flavor appeal, and regulatory clarity. Ÿnsect is leading edible-protein positioning in Europe by offering powdered cricket and mealworm ingredients to food brands and ingredient formulators.

Jimini’s (Next Food) and Cricket One have differentiated offerings in the USA, promoting cricket-chip lines and functional protein bites via direct-to-consumer platforms and select retail grocers. Chapul’s flavored bars have been co-developed for private-label retailers in North America.

Entomo Farms serves regional demand in Canada and the USA with bulk cricket protein, scaling operations through feedstock-sourced rearing systems. All players have navigated allergen labeling, novel food registration, and import approvals across EU, USA, India, and ASEAN markets.

Recent Industry Developments

  • Between 2023 and 2025, Small Giants expanded its reach across European supermarkets and online platforms after closing a £400k Series A round. The company’s cricket-based snacks continue to gain traction as a sustainable, high-protein alternative in the mainstream snack category.
  • In January 2024, Italian startup Nutrinsect received official approval to use cricket flour in human food. CEO José Francesco Cianni called it “a new page in the history of food,” marking a major regulatory milestone for insect-based snacks and alternative protein innovation in Europe.

Report Scope

Attribute Category Details
Industry Size (2025E) USD 250 million
Projected Industry Value (2035F) USD 380.9 million
Value-based CAGR (2025 to 2035) 4.3%
Base Year for Estimation 2024
Historical Period 2020 to 2024
Projections Period 2025 to 2035
Report Parameter Revenue in USD million / Volume in metric tons
By Insect Type Crickets, Mealworms, Grasshoppers, Black Soldier Fly Larvae, Ants
By Product Type Whole Roasted Insects, Protein Bars, Chips & Crisps, Protein Powders (used in snacks), Granola & Energy Bites, Biscuits & Crackers
By Sales Channel Online Retail, Supermarkets/Hypermarkets, Specialty Health Stores, Convenience Stores, Foodservice & Vending
By End User Adults, Children, Sports & Fitness Enthusiasts, Pet Snacks (cross-application)
By Region North America, Latin America, Western Europe, Eastern Europe, East Asia, South Asia & Pacific, Central Asia, Balkan and Baltic Countries, Russia & Belarus, Middle East & Africa
Countries Covered United States, Canada, Mexico, Brazil, Argentina, Germany, France, United Kingdom, Italy, Spain, Netherlands, Poland, Russia, South Korea, Japan, China, India, Australia, Indonesia, Saudi Arabia, United Arab Emirates, South Africa
Key Players Ÿnsect, Jimini’s (Next Food), Cricket One, Chapul, Entomo Farms, Others
Additional Attributes Dollar by sales, share by product type and end-user, trends in consumer preferences across geographies, omni -channel retail performance, demand seasonality insights, and market potential in emerging high-protein snack hubs

Key Players

  • Ÿnsect
  • Jimini’s (Next Food)
  • Cricket One
  • Chapul
  • Entomo Farms
  • Others

Insect-Based Snacks Market Analyzed by Key Investment Segments

By Insect Type:

Insect types include Crickets, Mealworms, Grasshoppers, Black Soldier Fly Larvae, and Ants.

By Product Type:

Product segmentation includes Whole Roasted Insects, Protein Bars, Chips & Crisps, Protein Powders (used in snacks), Granola & Energy Bites, and Biscuits & Crackers.

By Sales Channel:

Sales channels comprise Online Retail, Supermarkets/Hypermarkets, Specialty Health Stores, Convenience Stores, and Foodservice & Vending.

By End User:

End-user categories include Adults, Children, Sports & Fitness Enthusiasts, and Pet Snacks (cross-application).

By Region:

Regional analysis includes North America, Latin America, Eastern Europe, Western Europe, East Asia, South Asia & Pacific, Central Asia, Balkan and Baltic Countries, Russia & Belarus, and the Middle East & Africa.

Table of Content

  1. Executive Summary
    • Global Market Outlook
    • Demand-side Trends
    • Supply-side Trends
    • Technology Roadmap Analysis
    • Analysis and Recommendations
  2. Market Overview
    • Market Coverage / Taxonomy
    • Market Definition / Scope / Limitations
  3. Market Background
    • Market Dynamics
      • Drivers
      • Restraints
      • Opportunity
      • Trends
    • Scenario Forecast
      • Demand in Optimistic Scenario
      • Demand in Likely Scenario
      • Demand in Conservative Scenario
    • Opportunity Map Analysis
    • Product Life Cycle Analysis
    • Supply Chain Analysis
      • Supply Side Participants and their Roles
        • Producers
        • Mid-Level Participants (Traders/ Agents/ Brokers)
        • Wholesalers and Distributors
      • Value Added and Value Created at Node in the Supply Chain
      • List of Raw Material Suppliers
      • List of Existing and Potential Buyer’s
    • Investment Feasibility Matrix
    • Value Chain Analysis
      • Profit Margin Analysis
      • Wholesalers and Distributors
      • Retailers
    • PESTLE and Porter’s Analysis
    • Regulatory Landscape
      • By Key Regions
      • By Key Countries
    • Regional Parent Market Outlook
    • Production and Consumption Statistics
    • Import and Export Statistics
  4. Global Market Analysis 2020 to 2024 and Forecast, 2025 to 2035
    • Historical Market Size Value (USD Million) & Volume (Metric Ton) Analysis, 2020 to 2024
    • Current and Future Market Size Value (USD Million) & Volume (Metric Ton) Projections, 2025 to 2035
      • Y-o-Y Growth Trend Analysis
      • Absolute $ Opportunity Analysis
  5. Global Market Pricing Analysis 2020 to 2024 and Forecast 2025 to 2035
  6. Global Market Analysis 2020 to 2024 and Forecast 2025 to 2035, By Insect Type
    • Introduction / Key Findings
    • Historical Market Size Value (USD Million) & Volume (Metric Ton) Analysis By Insect Type, 2020 to 2024
    • Current and Future Market Size Value (USD Million) & Volume (Metric Ton) Analysis and Forecast By Insect Type, 2025 to 2035
      • Crickets
      • Mealworms
      • Grasshoppers
      • Black Soldier Fly Larvae
      • Ants
    • Y-o-Y Growth Trend Analysis By Insect Type, 2020 to 2024
    • Absolute $ Opportunity Analysis By Insect Type, 2025 to 2035
  7. Global Market Analysis 2020 to 2024 and Forecast 2025 to 2035, By Product Type
    • Introduction / Key Findings
    • Historical Market Size Value (USD Million) & Volume (Metric Ton) Analysis By Product Type, 2020 to 2024
    • Current and Future Market Size Value (USD Million) & Volume (Metric Ton) Analysis and Forecast By Product Type, 2025 to 2035
      • Whole Roasted Insects
      • Protein Bars
      • Chips & Crisps
      • Protein Powders (used in snacks)
      • Granola & Energy Bites
      • Biscuits & Crackers
    • Y-o-Y Growth Trend Analysis By Product Type, 2020 to 2024
    • Absolute $ Opportunity Analysis By Product Type, 2025 to 2035
  8. Global Market Analysis 2020 to 2024 and Forecast 2025 to 2035, By Sales Channel
    • Introduction / Key Findings
    • Historical Market Size Value (USD Million) & Volume (Metric Ton) Analysis By Sales Channel, 2020 to 2024
    • Current and Future Market Size Value (USD Million) & Volume (Metric Ton) Analysis and Forecast By Sales Channel, 2025 to 2035
      • Online Retail
      • Supermarkets/Hypermarkets
      • Specialty Health Stores
      • Convenience Stores
      • Foodservice & Vending
    • Y-o-Y Growth Trend Analysis By Sales Channel, 2020 to 2024
    • Absolute $ Opportunity Analysis By Sales Channel, 2025 to 2035
  9. Global Market Analysis 2020 to 2024 and Forecast 2025 to 2035, By End User
    • Introduction / Key Findings
    • Historical Market Size Value (USD Million) & Volume (Metric Ton) Analysis By End User, 2020 to 2024
    • Current and Future Market Size Value (USD Million) & Volume (Metric Ton) Analysis and Forecast By End User, 2025 to 2035
      • Adults
      • Children
      • Sports & Fitness Enthusiasts
      • Pet Snacks (cross-application)
    • Y-o-Y Growth Trend Analysis By End User, 2020 to 2024
    • Absolute $ Opportunity Analysis By End User, 2025 to 2035
  10. Global Market Analysis 2020 to 2024 and Forecast 2025 to 2035, By Region
    • Introduction
    • Historical Market Size Value (USD Million) & Volume (Metric Ton) Analysis By Region, 2020 to 2024
    • Current Market Size Value (USD Million) & Volume (Metric Ton) Analysis and Forecast By Region, 2025 to 2035
      • North America
      • Latin America
      • Western Europe
      • Eastern Europe
      • East Asia
      • South Asia & Pacific
      • Middle East and Africa
    • Market Attractiveness Analysis By Region
  11. North America Market Analysis 2020 to 2024 and Forecast 2025 to 2035, By Country
    • Historical Market Size Value (USD Million) & Volume (Metric Ton) Trend Analysis By Market Taxonomy, 2020 to 2024
    • Market Size Value (USD Million) & Volume (Metric Ton) Forecast By Market Taxonomy, 2025 to 2035
      • By Country
        • USA
        • Canada
        • Mexico
      • By Insect Type
      • By Product Type
      • By Sales Channel
      • By End User
    • Market Attractiveness Analysis
      • By Country
      • By Insect Type
      • By Product Type
      • By Sales Channel
      • By End User
    • Key Takeaways
  12. Latin America Market Analysis 2020 to 2024 and Forecast 2025 to 2035, By Country
    • Historical Market Size Value (USD Million) & Volume (Metric Ton) Trend Analysis By Market Taxonomy, 2020 to 2024
    • Market Size Value (USD Million) & Volume (Metric Ton) Forecast By Market Taxonomy, 2025 to 2035
      • By Country
        • Brazil
        • Argentina
        • Rest of LATAM
      • By Insect Type
      • By Product Type
      • By Sales Channel
      • By End User
    • Market Attractiveness Analysis
      • By Country
      • By Insect Type
      • By Product Type
      • By Sales Channel
      • By End User
    • Key Takeaways
  13. Western Europe Market Analysis 2020 to 2024 and Forecast 2025 to 2035, By Country
    • Historical Market Size Value (USD Million) & Volume (Metric Ton) Trend Analysis By Market Taxonomy, 2020 to 2024
    • Market Size Value (USD Million) & Volume (Metric Ton) Forecast By Market Taxonomy, 2025 to 2035
      • By Country
        • Germany
        • Italy
        • France
        • UK
        • Spain
        • BENELUX
        • Nordic
        • Rest of W.Europe
      • By Insect Type
      • By Product Type
      • By Sales Channel
      • By End User
    • Market Attractiveness Analysis
      • By Country
      • By Insect Type
      • By Product Type
      • By Sales Channel
      • By End User
    • Key Takeaways
  14. Eastern Europe Market Analysis 2020 to 2024 and Forecast 2025 to 2035, By Country
    • Historical Market Size Value (USD Million) & Volume (Metric Ton) Trend Analysis By Market Taxonomy, 2020 to 2024
    • Market Size Value (USD Million) & Volume (Metric Ton) Forecast By Market Taxonomy, 2025 to 2035
      • By Country
        • Russia
        • Hungary
        • Poland
        • Balkan & Baltics
        • Rest of E. Europe
      • By Insect Type
      • By Product Type
      • By Sales Channel
      • By End User
    • Market Attractiveness Analysis
      • By Country
      • By Insect Type
      • By Product Type
      • By Sales Channel
      • By End User
    • Key Takeaways
  15. East Asia Market Analysis 2020 to 2024 and Forecast 2025 to 2035, By Country
    • Historical Market Size Value (USD Million) & Volume (Metric Ton) Trend Analysis By Market Taxonomy, 2020 to 2024
    • Market Size Value (USD Million) & Volume (Metric Ton) Forecast By Market Taxonomy, 2025 to 2035
      • By Country
        • China
        • Japan
        • South Korea
      • By Insect Type
      • By Product Type
      • By Sales Channel
      • By End User
    • Market Attractiveness Analysis
      • By Country
      • By Insect Type
      • By Product Type
      • By Sales Channel
      • By End User
    • Key Takeaways
  16. South Asia & Pacific Market Analysis 2020 to 2024 and Forecast 2025 to 2035, By Country
    • Historical Market Size Value (USD Million) & Volume (Metric Ton) Trend Analysis By Market Taxonomy, 2020 to 2024
    • Market Size Value (USD Million) & Volume (Metric Ton) Forecast By Market Taxonomy, 2025 to 2035
      • By Country
        • India
        • Australia & New Zealand
        • ASEAN
        • Rest of SAP
      • By Insect Type
      • By Product Type
      • By Sales Channel
      • By End User
    • Market Attractiveness Analysis
      • By Country
      • By Insect Type
      • By Product Type
      • By Sales Channel
      • By End User
    • Key Takeaways
  17. Middle East and Africa Market Analysis 2020 to 2024 and Forecast 2025 to 2035, By Country
    • Historical Market Size Value (USD Million) & Volume (Metric Ton) Trend Analysis By Market Taxonomy, 2020 to 2024
    • Market Size Value (USD Million) & Volume (Metric Ton) Forecast By Market Taxonomy, 2025 to 2035
      • By Country
        • GCC Countries
        • Northern Africa
        • South Africa
        • Turkiye
        • Rest of MEA
      • By Insect Type
      • By Product Type
      • By Sales Channel
      • By End User
    • Market Attractiveness Analysis
      • By Country
      • By Insect Type
      • By Product Type
      • By Sales Channel
      • By End User
    • Key Takeaways
  18. Key Countries Market Analysis
    • USA
      • Pricing Analysis
      • Market Share Analysis, 2024
        • By Insect Type
        • By Product Type
        • By Sales Channel
        • By End User
    • Canada
      • Pricing Analysis
      • Market Share Analysis, 2024
        • By Insect Type
        • By Product Type
        • By Sales Channel
        • By End User
    • Brazil
      • Pricing Analysis
      • Market Share Analysis, 2024
        • By Insect Type
        • By Product Type
        • By Sales Channel
        • By End User
    • Mexico
      • Pricing Analysis
      • Market Share Analysis, 2024
        • By Insect Type
        • By Product Type
        • By Sales Channel
        • By End User
    • Argentina
      • Pricing Analysis
      • Market Share Analysis, 2024
        • By Insect Type
        • By Product Type
        • By Sales Channel
        • By End User
  19. Market Structure Analysis
    • Competition Dashboard
    • Competition Benchmarking
    • Market Share Analysis of Top Players
      • By Regional
      • By Insect Type
      • By Product Type
      • By Sales Channel
      • By End User
  20. Competition Analysis
    • Competition Deep Dive
      • Ÿnsect
        • Overview
        • Product Portfolio
        • Profitability by Market Segments (Product/Age /Sales Channel/Region)
        • Sales Footprint
        • Strategy Overview
          • Marketing Strategy
          • Product Strategy
          • Channel Strategy
      • Jimini’s (Next Food)
        • Overview
        • Product Portfolio
        • Profitability by Market Segments (Product/Age /Sales Channel/Region)
        • Sales Footprint
        • Strategy Overview
          • Marketing Strategy
          • Product Strategy
          • Channel Strategy
      • Cricket One
        • Overview
        • Product Portfolio
        • Profitability by Market Segments (Product/Age /Sales Channel/Region)
        • Sales Footprint
        • Strategy Overview
          • Marketing Strategy
          • Product Strategy
          • Channel Strategy
      • Chapul
        • Overview
        • Product Portfolio
        • Profitability by Market Segments (Product/Age /Sales Channel/Region)
        • Sales Footprint
        • Strategy Overview
          • Marketing Strategy
          • Product Strategy
          • Channel Strategy
      • Entomo Farms
        • Overview
        • Product Portfolio
        • Profitability by Market Segments (Product/Age /Sales Channel/Region)
        • Sales Footprint
        • Strategy Overview
          • Marketing Strategy
          • Product Strategy
          • Channel Strategy
  21. Assumptions & Acronyms Used
  22. Research Methodology

List of Tables

  • Table 1: Global Market Value (USD Million) Forecast by Region, 2020 to 2035
  • Table 2: Global Market Volume (Metric Ton) Forecast by Region, 2020 to 2035
  • Table 3: Global Market Value (USD Million) Forecast by Insect Type, 2020 to 2035
  • Table 4: Global Market Volume (Metric Ton) Forecast by Insect Type, 2020 to 2035
  • Table 5: Global Market Value (USD Million) Forecast by Product Type, 2020 to 2035
  • Table 6: Global Market Volume (Metric Ton) Forecast by Product Type, 2020 to 2035
  • Table 7: Global Market Value (USD Million) Forecast by Sales Channel, 2020 to 2035
  • Table 8: Global Market Volume (Metric Ton) Forecast by Sales Channel, 2020 to 2035
  • Table 9: Global Market Value (USD Million) Forecast by End User, 2020 to 2035
  • Table 10: Global Market Volume (Metric Ton) Forecast by End User, 2020 to 2035
  • Table 11: North America Market Value (USD Million) Forecast by Country, 2020 to 2035
  • Table 12: North America Market Volume (Metric Ton) Forecast by Country, 2020 to 2035
  • Table 13: North America Market Value (USD Million) Forecast by Insect Type, 2020 to 2035
  • Table 14: North America Market Volume (Metric Ton) Forecast by Insect Type, 2020 to 2035
  • Table 15: North America Market Value (USD Million) Forecast by Product Type, 2020 to 2035
  • Table 16: North America Market Volume (Metric Ton) Forecast by Product Type, 2020 to 2035
  • Table 17: North America Market Value (USD Million) Forecast by Sales Channel, 2020 to 2035
  • Table 18: North America Market Volume (Metric Ton) Forecast by Sales Channel, 2020 to 2035
  • Table 19: North America Market Value (USD Million) Forecast by End User, 2020 to 2035
  • Table 20: North America Market Volume (Metric Ton) Forecast by End User, 2020 to 2035
  • Table 21: Latin America Market Value (USD Million) Forecast by Country, 2020 to 2035
  • Table 22: Latin America Market Volume (Metric Ton) Forecast by Country, 2020 to 2035
  • Table 23: Latin America Market Value (USD Million) Forecast by Insect Type, 2020 to 2035
  • Table 24: Latin America Market Volume (Metric Ton) Forecast by Insect Type, 2020 to 2035
  • Table 25: Latin America Market Value (USD Million) Forecast by Product Type, 2020 to 2035
  • Table 26: Latin America Market Volume (Metric Ton) Forecast by Product Type, 2020 to 2035
  • Table 27: Latin America Market Value (USD Million) Forecast by Sales Channel, 2020 to 2035
  • Table 28: Latin America Market Volume (Metric Ton) Forecast by Sales Channel, 2020 to 2035
  • Table 29: Latin America Market Value (USD Million) Forecast by End User, 2020 to 2035
  • Table 30: Latin America Market Volume (Metric Ton) Forecast by End User, 2020 to 2035
  • Table 31: Western Europe Market Value (USD Million) Forecast by Country, 2020 to 2035
  • Table 32: Western Europe Market Volume (Metric Ton) Forecast by Country, 2020 to 2035
  • Table 33: Western Europe Market Value (USD Million) Forecast by Insect Type, 2020 to 2035
  • Table 34: Western Europe Market Volume (Metric Ton) Forecast by Insect Type, 2020 to 2035
  • Table 35: Western Europe Market Value (USD Million) Forecast by Product Type, 2020 to 2035
  • Table 36: Western Europe Market Volume (Metric Ton) Forecast by Product Type, 2020 to 2035
  • Table 37: Western Europe Market Value (USD Million) Forecast by Sales Channel, 2020 to 2035
  • Table 38: Western Europe Market Volume (Metric Ton) Forecast by Sales Channel, 2020 to 2035
  • Table 39: Western Europe Market Value (USD Million) Forecast by End User, 2020 to 2035
  • Table 40: Western Europe Market Volume (Metric Ton) Forecast by End User, 2020 to 2035
  • Table 41: Eastern Europe Market Value (USD Million) Forecast by Country, 2020 to 2035
  • Table 42: Eastern Europe Market Volume (Metric Ton) Forecast by Country, 2020 to 2035
  • Table 43: Eastern Europe Market Value (USD Million) Forecast by Insect Type, 2020 to 2035
  • Table 44: Eastern Europe Market Volume (Metric Ton) Forecast by Insect Type, 2020 to 2035
  • Table 45: Eastern Europe Market Value (USD Million) Forecast by Product Type, 2020 to 2035
  • Table 46: Eastern Europe Market Volume (Metric Ton) Forecast by Product Type, 2020 to 2035
  • Table 47: Eastern Europe Market Value (USD Million) Forecast by Sales Channel, 2020 to 2035
  • Table 48: Eastern Europe Market Volume (Metric Ton) Forecast by Sales Channel, 2020 to 2035
  • Table 49: Eastern Europe Market Value (USD Million) Forecast by End User, 2020 to 2035
  • Table 50: Eastern Europe Market Volume (Metric Ton) Forecast by End User, 2020 to 2035
  • Table 51: East Asia Market Value (USD Million) Forecast by Country, 2020 to 2035
  • Table 52: East Asia Market Volume (Metric Ton) Forecast by Country, 2020 to 2035
  • Table 53: East Asia Market Value (USD Million) Forecast by Insect Type, 2020 to 2035
  • Table 54: East Asia Market Volume (Metric Ton) Forecast by Insect Type, 2020 to 2035
  • Table 55: East Asia Market Value (USD Million) Forecast by Product Type, 2020 to 2035
  • Table 56: East Asia Market Volume (Metric Ton) Forecast by Product Type, 2020 to 2035
  • Table 57: East Asia Market Value (USD Million) Forecast by Sales Channel, 2020 to 2035
  • Table 58: East Asia Market Volume (Metric Ton) Forecast by Sales Channel, 2020 to 2035
  • Table 59: East Asia Market Value (USD Million) Forecast by End User, 2020 to 2035
  • Table 60: East Asia Market Volume (Metric Ton) Forecast by End User, 2020 to 2035
  • Table 61: South Asia & Pacific Market Value (USD Million) Forecast by Country, 2020 to 2035
  • Table 62: South Asia & Pacific Market Volume (Metric Ton) Forecast by Country, 2020 to 2035
  • Table 63: South Asia & Pacific Market Value (USD Million) Forecast by Insect Type, 2020 to 2035
  • Table 64: South Asia & Pacific Market Volume (Metric Ton) Forecast by Insect Type, 2020 to 2035
  • Table 65: South Asia & Pacific Market Value (USD Million) Forecast by Product Type, 2020 to 2035
  • Table 66: South Asia & Pacific Market Volume (Metric Ton) Forecast by Product Type, 2020 to 2035
  • Table 67: South Asia & Pacific Market Value (USD Million) Forecast by Sales Channel, 2020 to 2035
  • Table 68: South Asia & Pacific Market Volume (Metric Ton) Forecast by Sales Channel, 2020 to 2035
  • Table 69: South Asia & Pacific Market Value (USD Million) Forecast by End User, 2020 to 2035
  • Table 70: South Asia & Pacific Market Volume (Metric Ton) Forecast by End User, 2020 to 2035
  • Table 71: Middle East and Africa Market Value (USD Million) Forecast by Country, 2020 to 2035
  • Table 72: Middle East and Africa Market Volume (Metric Ton) Forecast by Country, 2020 to 2035
  • Table 73: Middle East and Africa Market Value (USD Million) Forecast by Insect Type, 2020 to 2035
  • Table 74: Middle East and Africa Market Volume (Metric Ton) Forecast by Insect Type, 2020 to 2035
  • Table 75: Middle East and Africa Market Value (USD Million) Forecast by Product Type, 2020 to 2035
  • Table 76: Middle East and Africa Market Volume (Metric Ton) Forecast by Product Type, 2020 to 2035
  • Table 77: Middle East and Africa Market Value (USD Million) Forecast by Sales Channel, 2020 to 2035
  • Table 78: Middle East and Africa Market Volume (Metric Ton) Forecast by Sales Channel, 2020 to 2035
  • Table 79: Middle East and Africa Market Value (USD Million) Forecast by End User, 2020 to 2035
  • Table 80: Middle East and Africa Market Volume (Metric Ton) Forecast by End User, 2020 to 2035

List of Figures

  • Figure 1: Global Market Volume (Metric Ton) Forecast 2020 to 2035
  • Figure 2: Global Market Pricing Analysis
  • Figure 3: Global Market Value (USD Million) Forecast 2020 to 2035
  • Figure 4: Global Market Value Share and BPS Analysis by Insect Type, 2025 and 2035
  • Figure 5: Global Market Y-o-Y Growth Comparison by Insect Type, 2025 to 2035
  • Figure 6: Global Market Attractiveness Analysis by Insect Type
  • Figure 7: Global Market Value Share and BPS Analysis by Product Type, 2025 and 2035
  • Figure 8: Global Market Y-o-Y Growth Comparison by Product Type, 2025 to 2035
  • Figure 9: Global Market Attractiveness Analysis by Product Type
  • Figure 10: Global Market Value Share and BPS Analysis by Sales Channel, 2025 and 2035
  • Figure 11: Global Market Y-o-Y Growth Comparison by Sales Channel, 2025 to 2035
  • Figure 12: Global Market Attractiveness Analysis by Sales Channel
  • Figure 13: Global Market Value Share and BPS Analysis by End User, 2025 and 2035
  • Figure 14: Global Market Y-o-Y Growth Comparison by End User, 2025 to 2035
  • Figure 15: Global Market Attractiveness Analysis by End User
  • Figure 16: Global Market Value (USD Million) Share and BPS Analysis by Region, 2025 and 2035
  • Figure 17: Global Market Y-o-Y Growth Comparison by Region, 2025 to 2035
  • Figure 18: Global Market Attractiveness Analysis by Region
  • Figure 19: North America Market Incremental $ Opportunity, 2025 to 2035
  • Figure 20: Latin America Market Incremental $ Opportunity, 2025 to 2035
  • Figure 21: Western Europe Market Incremental $ Opportunity, 2025 to 2035
  • Figure 22: Eastern Europe Market Incremental $ Opportunity, 2025 to 2035
  • Figure 23: East Asia Market Incremental $ Opportunity, 2025 to 2035
  • Figure 24: South Asia & Pacific Market Incremental $ Opportunity, 2025 to 2035
  • Figure 25: Middle East and Africa Market Incremental $ Opportunity, 2025 to 2035
  • Figure 26: North America Market Value Share and BPS Analysis by Country, 2025 and 2035
  • Figure 27: North America Market Value Share and BPS Analysis by Insect Type, 2025 and 2035
  • Figure 28: North America Market Y-o-Y Growth Comparison by Insect Type, 2025 to 2035
  • Figure 29: North America Market Attractiveness Analysis by Insect Type
  • Figure 30: North America Market Value Share and BPS Analysis by Product Type, 2025 and 2035
  • Figure 31: North America Market Y-o-Y Growth Comparison by Product Type, 2025 to 2035
  • Figure 32: North America Market Attractiveness Analysis by Product Type
  • Figure 33: North America Market Value Share and BPS Analysis by Sales Channel, 2025 and 2035
  • Figure 34: North America Market Y-o-Y Growth Comparison by Sales Channel, 2025 to 2035
  • Figure 35: North America Market Attractiveness Analysis by Sales Channel
  • Figure 36: North America Market Value Share and BPS Analysis by End User, 2025 and 2035
  • Figure 37: North America Market Y-o-Y Growth Comparison by End User, 2025 to 2035
  • Figure 38: North America Market Attractiveness Analysis by End User
  • Figure 39: Latin America Market Value Share and BPS Analysis by Country, 2025 and 2035
  • Figure 40: Latin America Market Value Share and BPS Analysis by Insect Type, 2025 and 2035
  • Figure 41: Latin America Market Y-o-Y Growth Comparison by Insect Type, 2025 to 2035
  • Figure 42: Latin America Market Attractiveness Analysis by Insect Type
  • Figure 43: Latin America Market Value Share and BPS Analysis by Product Type, 2025 and 2035
  • Figure 44: Latin America Market Y-o-Y Growth Comparison by Product Type, 2025 to 2035
  • Figure 45: Latin America Market Attractiveness Analysis by Product Type
  • Figure 46: Latin America Market Value Share and BPS Analysis by Sales Channel, 2025 and 2035
  • Figure 47: Latin America Market Y-o-Y Growth Comparison by Sales Channel, 2025 to 2035
  • Figure 48: Latin America Market Attractiveness Analysis by Sales Channel
  • Figure 49: Latin America Market Value Share and BPS Analysis by End User, 2025 and 2035
  • Figure 50: Latin America Market Y-o-Y Growth Comparison by End User, 2025 to 2035
  • Figure 51: Latin America Market Attractiveness Analysis by End User
  • Figure 52: Western Europe Market Value Share and BPS Analysis by Country, 2025 and 2035
  • Figure 53: Western Europe Market Value Share and BPS Analysis by Insect Type, 2025 and 2035
  • Figure 54: Western Europe Market Y-o-Y Growth Comparison by Insect Type, 2025 to 2035
  • Figure 55: Western Europe Market Attractiveness Analysis by Insect Type
  • Figure 56: Western Europe Market Value Share and BPS Analysis by Product Type, 2025 and 2035
  • Figure 57: Western Europe Market Y-o-Y Growth Comparison by Product Type, 2025 to 2035
  • Figure 58: Western Europe Market Attractiveness Analysis by Product Type
  • Figure 59: Western Europe Market Value Share and BPS Analysis by Sales Channel, 2025 and 2035
  • Figure 60: Western Europe Market Y-o-Y Growth Comparison by Sales Channel, 2025 to 2035
  • Figure 61: Western Europe Market Attractiveness Analysis by Sales Channel
  • Figure 62: Western Europe Market Value Share and BPS Analysis by End User, 2025 and 2035
  • Figure 63: Western Europe Market Y-o-Y Growth Comparison by End User, 2025 to 2035
  • Figure 64: Western Europe Market Attractiveness Analysis by End User
  • Figure 65: Eastern Europe Market Value Share and BPS Analysis by Country, 2025 and 2035
  • Figure 66: Eastern Europe Market Value Share and BPS Analysis by Insect Type, 2025 and 2035
  • Figure 67: Eastern Europe Market Y-o-Y Growth Comparison by Insect Type, 2025 to 2035
  • Figure 68: Eastern Europe Market Attractiveness Analysis by Insect Type
  • Figure 69: Eastern Europe Market Value Share and BPS Analysis by Product Type, 2025 and 2035
  • Figure 70: Eastern Europe Market Y-o-Y Growth Comparison by Product Type, 2025 to 2035
  • Figure 71: Eastern Europe Market Attractiveness Analysis by Product Type
  • Figure 72: Eastern Europe Market Value Share and BPS Analysis by Sales Channel, 2025 and 2035
  • Figure 73: Eastern Europe Market Y-o-Y Growth Comparison by Sales Channel, 2025 to 2035
  • Figure 74: Eastern Europe Market Attractiveness Analysis by Sales Channel
  • Figure 75: Eastern Europe Market Value Share and BPS Analysis by End User, 2025 and 2035
  • Figure 76: Eastern Europe Market Y-o-Y Growth Comparison by End User, 2025 to 2035
  • Figure 77: Eastern Europe Market Attractiveness Analysis by End User
  • Figure 78: East Asia Market Value Share and BPS Analysis by Country, 2025 and 2035
  • Figure 79: East Asia Market Value Share and BPS Analysis by Insect Type, 2025 and 2035
  • Figure 80: East Asia Market Y-o-Y Growth Comparison by Insect Type, 2025 to 2035
  • Figure 81: East Asia Market Attractiveness Analysis by Insect Type
  • Figure 82: East Asia Market Value Share and BPS Analysis by Product Type, 2025 and 2035
  • Figure 83: East Asia Market Y-o-Y Growth Comparison by Product Type, 2025 to 2035
  • Figure 84: East Asia Market Attractiveness Analysis by Product Type
  • Figure 85: East Asia Market Value Share and BPS Analysis by Sales Channel, 2025 and 2035
  • Figure 86: East Asia Market Y-o-Y Growth Comparison by Sales Channel, 2025 to 2035
  • Figure 87: East Asia Market Attractiveness Analysis by Sales Channel
  • Figure 88: East Asia Market Value Share and BPS Analysis by End User, 2025 and 2035
  • Figure 89: East Asia Market Y-o-Y Growth Comparison by End User, 2025 to 2035
  • Figure 90: East Asia Market Attractiveness Analysis by End User
  • Figure 91: South Asia & Pacific Market Value Share and BPS Analysis by Country, 2025 and 2035
  • Figure 92: South Asia & Pacific Market Value Share and BPS Analysis by Insect Type, 2025 and 2035
  • Figure 93: South Asia & Pacific Market Y-o-Y Growth Comparison by Insect Type, 2025 to 2035
  • Figure 94: South Asia & Pacific Market Attractiveness Analysis by Insect Type
  • Figure 95: South Asia & Pacific Market Value Share and BPS Analysis by Product Type, 2025 and 2035
  • Figure 96: South Asia & Pacific Market Y-o-Y Growth Comparison by Product Type, 2025 to 2035
  • Figure 97: South Asia & Pacific Market Attractiveness Analysis by Product Type
  • Figure 98: South Asia & Pacific Market Value Share and BPS Analysis by Sales Channel, 2025 and 2035
  • Figure 99: South Asia & Pacific Market Y-o-Y Growth Comparison by Sales Channel, 2025 to 2035
  • Figure 100: South Asia & Pacific Market Attractiveness Analysis by Sales Channel
  • Figure 101: South Asia & Pacific Market Value Share and BPS Analysis by End User, 2025 and 2035
  • Figure 102: South Asia & Pacific Market Y-o-Y Growth Comparison by End User, 2025 to 2035
  • Figure 103: South Asia & Pacific Market Attractiveness Analysis by End User
  • Figure 104: Middle East and Africa Market Value Share and BPS Analysis by Country, 2025 and 2035
  • Figure 105: Middle East and Africa Market Value Share and BPS Analysis by Insect Type, 2025 and 2035
  • Figure 106: Middle East and Africa Market Y-o-Y Growth Comparison by Insect Type, 2025 to 2035
  • Figure 107: Middle East and Africa Market Attractiveness Analysis by Insect Type
  • Figure 108: Middle East and Africa Market Value Share and BPS Analysis by Product Type, 2025 and 2035
  • Figure 109: Middle East and Africa Market Y-o-Y Growth Comparison by Product Type, 2025 to 2035
  • Figure 110: Middle East and Africa Market Attractiveness Analysis by Product Type
  • Figure 111: Middle East and Africa Market Value Share and BPS Analysis by Sales Channel, 2025 and 2035
  • Figure 112: Middle East and Africa Market Y-o-Y Growth Comparison by Sales Channel, 2025 to 2035
  • Figure 113: Middle East and Africa Market Attractiveness Analysis by Sales Channel
  • Figure 114: Middle East and Africa Market Value Share and BPS Analysis by End User, 2025 and 2035
  • Figure 115: Middle East and Africa Market Y-o-Y Growth Comparison by End User, 2025 to 2035
  • Figure 116: Middle East and Africa Market Attractiveness Analysis by End User
  • Figure 117: Global Market - Tier Structure Analysis
  • Figure 118: Global Market - Company Share Analysis

Frequently Asked Questions

What is the estimated industry size of the insect-based snacks market in 2025?

The estimated industry size of the insect-based snacks market in 2025 is USD 250 million.

What will be the market value of the insect-based snacks market in 2035 and its CAGR?

The market value of the insect-based snacks market in 2035 is USD 380.9 million, with a CAGR of 4.3%.

Which insect type leads the insect-based snacks market?

Crickets lead the insect-based snacks market with a 40% market share.

Which product type dominates the insect-based snacks market?

Protein bars dominate the insect-based snacks market with a 27.5% market share.

Which country is projected to have the highest CAGR in the insect-based snacks market?

The United Kingdom is projected to have the highest CAGR in the insect-based snacks market with a growth rate of 4.9% from 2025 to 2035.

Explore Similar Insights

Future Market Insights

Insect-Based Snacks Market