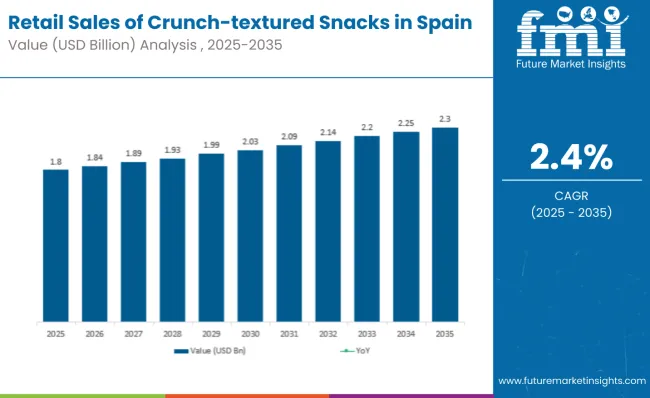
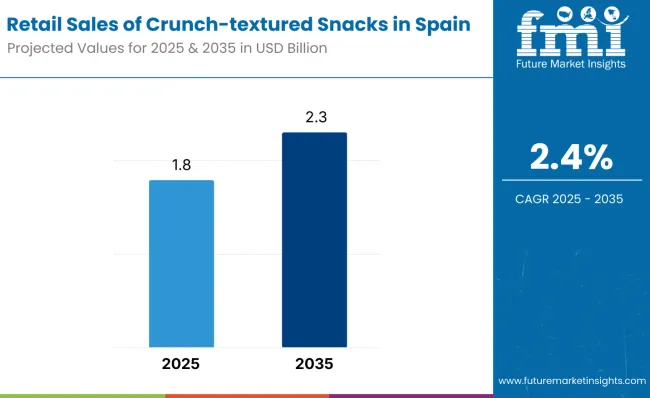
Sales of crunchy-textured Snacks in Spain are estimated at USD 1.80 billion in 2025, with projections indicating a rise to USD 2.30 billion by 2035, reflecting a CAGR of approximately 2.48% over the forecast period. This growth reflects steady consumer demand and measured expansion across established snacking categories. The rise in demand is linked to consistent consumption habits, gradual premiumization, and evolving flavor preferences across regional Spanish preferences.
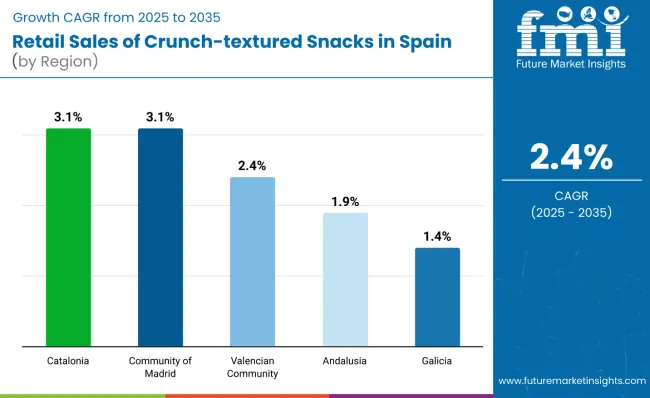
Community of Madrid leads regional growth momentum, expected to generate USD 368 million in crunchy snack sales by 2035, followed by Catalonia and Andalusia (both USD 391 million each). Catalonia and Madrid show the strongest growth rates at 3.10% and 3.15% CAGR respectively, driven by urban density and higher disposable income levels.
The largest contribution to demand continues to come from potato chips and crisps, which are expected to account for 42% of total sales by 2035, though this represents a slight decline from 45% in 2025 as consumers diversify toward other crunchy formats. By distribution channel, hypermarkets and supermarkets represent the dominant retail format, responsible for 60% of all sales, while online channels expand from 6% to 9% share.
Consumer adoption spans traditional Spanish families maintaining established snacking rituals, young urban professionals seeking convenient options, and health-conscious consumers exploring alternatives like roasted nuts and crunchy pulses. Regional preferences remain distinct, with Mediterranean regions favoring lighter, olive-oil based preparations while northern areas show stronger demand for hearty, substantial textures.
The crunchy-textured snacks segment in Spain is classified across several categories. By product type, key varieties include potato chips and crisps, extruded puffs and sticks, roasted nuts and seeds, corn and wheat fried snacks, crunchy pulses, and popcorn. By distribution channel, sales occur through hypermarkets and supermarkets, discounters, convenience stores, gas stations and impulse kiosks, online and e-commerce platforms, and health specialty retailers. By region, coverage includes Andalusia, Catalonia, Community of Madrid, Valencian Community, Galicia, and all other Spanish regions.
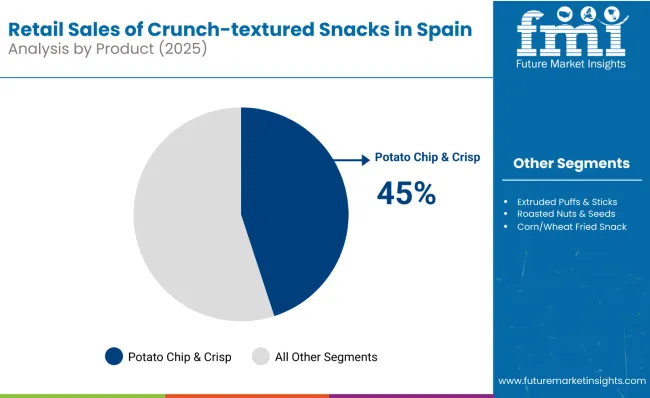
Potato chips and crisps are projected to maintain category leadership through 2035, though facing gradual share erosion as consumers explore alternative crunchy formats. The category benefits from strong brand loyalty, extensive flavor innovation, and universal appeal across age groups.
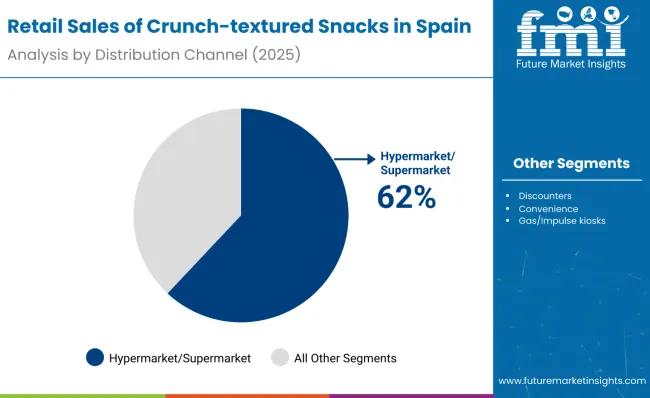
Crunchy-textured snacks in Spain are distributed through diverse retail channels, with hypermarkets and supermarkets maintaining channel leadership while adapting to changing consumer shopping behaviors. Distribution strategies reflect both mainstream adoption and impulse purchasing patterns.
Regional demand for crunchy-textured snacks reflects Spain's economic geography, with Madrid and Catalonia leading both growth rates and absolute consumption levels. Urban concentration, higher incomes, and diverse demographic profiles contribute to stronger performance in these key regions.
Community of Madrid demonstrates the strongest growth trajectory, expanding from USD 270 million (15% share) in 2025 to USD 368 million (16% share) by 2035, achieving a CAGR of 3.15%. This performance is supported by the region's role as Spain's economic center, high concentration of urban professionals, and strong retail infrastructure supporting both premium and mainstream snacking options.
Catalonia follows closely with growth from USD 288 million to USD 391 million (maintaining 16% to 17% share), registering a CAGR of 3.10%. The region benefits from Barcelona's cosmopolitan consumer base, strong tourism-driven impulse consumption, and cultural openness to international snack innovations alongside traditional Catalan preferences.
Andalusia, despite being the largest region by 2035 absolute sales at USD 391 million, shows more moderate growth with a CAGR of 1.90%, reflecting its large population base but more traditional consumption patterns and lower average incomes compared to Madrid and Catalonia.
Valencian Community maintains steady 11% share throughout the forecast period, growing from USD 198 million to USD 253 million with a 2.48% CAGR matching the national average, supported by Valencia's balanced urban-rural mix and consistent consumer demand across product categories.
Galicia shows the most conservative growth at 1.41% CAGR, expanding from USD 180 million to USD 207 million while declining from 10% to 9% share, reflecting the region's aging demographics and more traditional food preferences limiting adoption of newer crunchy snack formats.
Annual sales progression demonstrates consistent but measured growth, with year-over-year increases ranging from 2.10% to 2.90% across the forecast period. The trajectory reflects stable consumer demand and gradual category expansion without dramatic market disruption.
The sales progression shows alternating patterns of acceleration and moderation, reflecting cyclical consumer spending patterns and periodic promotional intensity across the Spanish retail calendar. The consistent growth pattern indicates mature category stability with gradual expansion rather than disruptive innovation.
Regional concentration remains significant, with the top five regions (Andalusia, Catalonia, Madrid, Valencia, Galicia) maintaining exactly 70% of total sales throughout the forecast period. This stability reflects Spain's established population distribution and consistent regional consumption patterns.
The regional data reveals clear performance tiers, with Madrid and Catalonia leading growth, Andalusia and Valencia maintaining steady expansion, and Galicia showing more conservative progression reflecting demographic and economic differences across Spanish regions.
Product preferences demonstrate gradual diversification, with traditional potato chips maintaining leadership while facing gentle erosion from emerging categories. The growth of crunchy pulses from 5% to 8% share represents the most significant category shift, reflecting growing health consciousness without abandoning satisfying texture expectations.
Extruded products gain modestly from 20% to 22%, indicating continued appeal of lighter, airy textures particularly among younger consumers. The stability of nuts and seeds at 14-15% share reflects their established position in Spanish snacking culture, while traditional corn and wheat snacks show slight decline as tastes evolve.
Channel evolution reflects broader Spanish retail trends, with hypermarkets maintaining dominance while online channels capture growing consumer interest in convenience and variety. The expansion of discounters from 12% to 14% share indicates increasing price sensitivity and value-seeking behavior among Spanish consumers.
The slight decline in gas station and impulse channels reflects changing mobility patterns and increased competition from convenience formats offering better product selection and shopping experience.
Crunchy snack consumption in Spain serves multiple consumption occasions, from family gathering accompaniments to individual impulse purchases. Urban professionals drive significant weekday consumption through convenience channels, while families rely on hypermarket shopping for household consumption and social occasion preparation.
Regional taste preferences influence product success, with Mediterranean regions showing preference for olive oil-based preparations and lighter textures, while northern regions favor more substantial, hearty formats. This geographic variation supports regional product mix optimization across retail channels.
Traditional Spanish social consumption patterns, including aperitivo culture and family gatherings, maintain strong influence on purchasing decisions, supporting larger pack sizes and sharing formats across product categories.
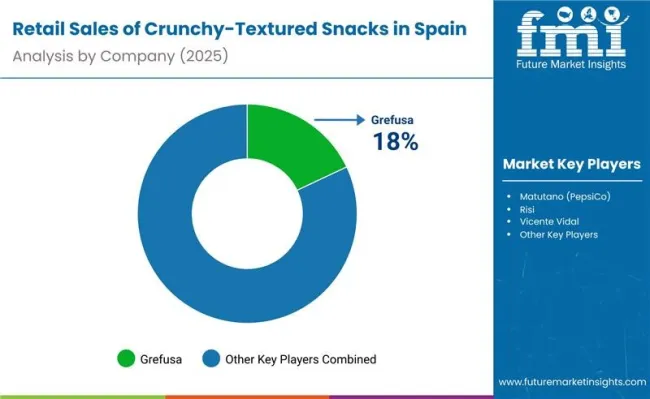
Spain’s crunchy snack market is facing strategic inflection driven by three concurrent forces: price sensitivity, regulatory pressure, and demand for flavor localization. As inflation persists, cost-conscious consumers are shifting toward private-label options, particularly from major retailers like Mercadona and Carrefour.
This is forcing branded manufacturers to defend their positions by optimizing portfolios, improving promotional efficiency, and rationalizing low-margin SKUs. At the same time, evolving health regulations around fat, salt, and sugar content are triggering widespread reformulation. Leading brands are adopting high-oleic sunflower and olive oils, exploring air-popped and baked formats, and launching smaller pack sizes to meet compliance while retaining product appeal.
Premiumization is emerging as a counter-strategy. Companies are differentiating through region-specific flavors such as jamónibérico, manchego cheese, and pimiento de padrón. These premium variants are often marketed with artisanal packaging and limited editions to justify price premiums and escape head-to-head competition with private labels. In parallel, distribution is evolving. Brands are expanding their footprint into petrol stations, vending machines, and dark-store delivery networks to capture impulse demand outside traditional supermarkets.
Despite these shifts, operational discipline remains the key success factor. Players that can optimize sourcing, control raw material volatility, and secure shelf space with strategic retail partners are best positioned to scale profitably in a market that remains highly commoditized at its core.
| Attribute | Details |
|---|---|
| Study Coverage | Spain sales and consumption of crunchy-textured snacks from 2025 to 2035 |
| Base Year | 2025 |
| Forecast Period | 2025 to 2035 |
| Units of Measurement | USD (sales), Percentage shares, CAGR |
| Geography Covered | All Spanish regions with detailed analysis of top 5 regions |
| Top Regions Analyzed | Andalusia, Catalonia, Madrid, Valencia, Galicia |
| By Product Type | Potato chips/crisps, Extruded puffs/sticks, Nuts/seeds, Corn/wheat snacks, Crunchy pulses, Popcorn |
| By Distribution Channel | Hypermarkets/supermarkets, Discounters, Convenience, Gas/impulse, Online, Health/specialty |
| Metrics Provided | Sales (USD), Share by segment, CAGR (2025 to 2035), YoY growth |
| Competitive Landscape | Channel strategies, regional preferences, category positioning |
| Forecast Drivers | Consumer habits, premiumization, health trends, retail expansion |
By 2035, total Spanish sales of crunchy-textured snacks are projected to reach USD 2.30 billion, up from USD 1.80 billion in 2025, reflecting a CAGR of 2.48%.
Potato chips and crisps hold the leading share, accounting for 42% of total sales by 2035, followed by extruded puffs and sticks (22%) and roasted nuts and seeds (14%).
Community of Madrid leads in projected growth with a CAGR of 3.15%, followed by Catalonia at 3.10%, both significantly outpacing the national average.
Hypermarkets and supermarkets dominate with 60% share by 2035, while online channels show rapid expansion from 6% to 9% share over the forecast period.
Crunchy pulses show the strongest growth trajectory, expanding from 5% to 8% share, driven by health-conscious consumers seeking protein-rich alternatives while maintaining satisfying crunch textures.


Our Research Products

The "Full Research Suite" delivers actionable market intel, deep dives on markets or technologies, so clients act faster, cut risk, and unlock growth.

The Leaderboard benchmarks and ranks top vendors, classifying them as Established Leaders, Leading Challengers, or Disruptors & Challengers.

Locates where complements amplify value and substitutes erode it, forecasting net impact by horizon

We deliver granular, decision-grade intel: market sizing, 5-year forecasts, pricing, adoption, usage, revenue, and operational KPIs—plus competitor tracking, regulation, and value chains—across 60 countries broadly.

Spot the shifts before they hit your P&L. We track inflection points, adoption curves, pricing moves, and ecosystem plays to show where demand is heading, why it is changing, and what to do next across high-growth markets and disruptive tech

Real-time reads of user behavior. We track shifting priorities, perceptions of today’s and next-gen services, and provider experience, then pace how fast tech moves from trial to adoption, blending buyer, consumer, and channel inputs with social signals (#WhySwitch, #UX).

Partner with our analyst team to build a custom report designed around your business priorities. From analysing market trends to assessing competitors or crafting bespoke datasets, we tailor insights to your needs.
Supplier Intelligence
Discovery & Profiling
Capacity & Footprint
Performance & Risk
Compliance & Governance
Commercial Readiness
Who Supplies Whom
Scorecards & Shortlists
Playbooks & Docs
Category Intelligence
Definition & Scope
Demand & Use Cases
Cost Drivers
Market Structure
Supply Chain Map
Trade & Policy
Operating Norms
Deliverables
Buyer Intelligence
Account Basics
Spend & Scope
Procurement Model
Vendor Requirements
Terms & Policies
Entry Strategy
Pain Points & Triggers
Outputs
Pricing Analysis
Benchmarks
Trends
Should-Cost
Indexation
Landed Cost
Commercial Terms
Deliverables
Brand Analysis
Positioning & Value Prop
Share & Presence
Customer Evidence
Go-to-Market
Digital & Reputation
Compliance & Trust
KPIs & Gaps
Outputs
Full Research Suite comprises of:
Market outlook & trends analysis
Interviews & case studies
Strategic recommendations
Vendor profiles & capabilities analysis
5-year forecasts
8 regions and 60+ country-level data splits
Market segment data splits
12 months of continuous data updates
DELIVERED AS:
PDF EXCEL ONLINE
CBD Snacks Market Size and Share Forecast Outlook 2025 to 2035
Kid Snacks Market Analysis by Source, Type, and Distribution Channel Through 2035
Pet Snacks and Treats Market Analysis by Product, Pet Type, Distribution Channel, and Region Through 2035
Meat Snacks Market Size and Share Forecast Outlook 2025 to 2035
Baby Snacks Market Analysis - Size, Share, & Forecast Outlook 2025 to 2035
Dairy Snacks Market Growth - Consumer Preferences & Industry Trends 2025 to 2035
Competitive Breakdown of Fruit Snacks Suppliers
Fruit Snacks Market Analysis by Product Type, Nature, Flavour Type, Distribution Channel Type, and Processing Type Through 2035
Frozen Snacks Market Analysis - Size, Share, and Forecast Outlook for 2025 to 2035
Healthy Snacks Market Size and Share Forecast Outlook 2025 to 2035
Protein Snacks Market Growth - Demand, Trends & Industry Forecast 2025 to 2035
Extruded Snacks Market Size and Share Forecast Outlook 2025 to 2035
Oat-based Snacks Market Size and Share Forecast Outlook 2025 to 2035
Pregnancy Snacks Market Analysis by Product Type, Nutritional Content, Distribution Channel, Packaging Format and Stage of Pregnancy Flavors Through 2035
Plant-based Snacks Market Analysis - Size, Share, and Forecast Outlook 2025 to 2035
Dog Food and Snacks Market Size and Share Forecast Outlook 2025 to 2035
Refrigerated Snacks Market Trends - Healthy & Fresh Innovations 2025 to 2035
Insect-Based Snacks Market Analysis - Size, Share & Forecast 2025 to 2035
Better for You Snacks Market Analysis - Size, Share, and Forecast Outlook 2025 to 2035
Mushroom-Based Snacks Market Analysis - Size and Share Forecast Outlook 2025 to 2035

Thank you!
You will receive an email from our Business Development Manager. Please be sure to check your SPAM/JUNK folder too.
Chat With
MaRIA