APAC Functional Food Ingredients Market
Market Insights on APAC Functional Food Ingredients covering sales outlook, demand forecast & up-to-date key trends
APAC Functional Food Ingredients Market by Ingredient Type (Vitamins, Minerals), Application & Region - Forecast 2022 - 2032
APAC Functional Food Ingredients Market Overview
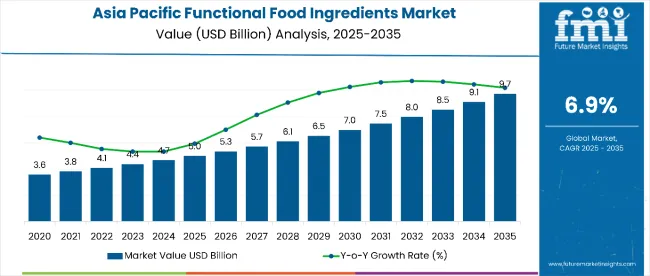
[350 Pages Report] The APAC functional food ingredients market is estimated to be valued at USD 4,138.7 Mn in 2022. As per Future Market Insights (FMI), the overall market value is expected to reach a valuation of USD 8,141.5 Mn by 2032, rising at a CAGR of 7% for 2022-32.
Attribute |
Details |
Market Size Value in 2021 |
USD 3,867.9 Million |
Market Forecast Value in 2032 |
USD 8,141.5 Million |
Global Growth Rate |
7% |
Forecast Period |
2022-2032 |
Functional food ingredients have special abilities to add extra benefits to any food product, in the form of disease prevention or health promotion and are intended to provide benefits in terms of physiological effects and mitigate the risk of chronic diseases in addition to basic nutritional functions. They resemble conventional foods and can be taken as part of a regular diet.
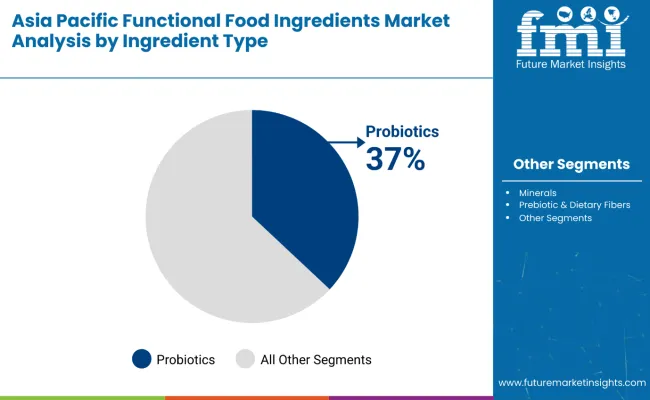
To meet the growing consumer demand for food products with various health benefits, food manufacturers in the Asia Pacific region are constantly developing food products that include functional ingredients such as omega 3s and probiotics. The expansion of manufacturing facilities by providers to further strengthen their market presence in the Asia Pacific functional food ingredients market is one of the upcoming trends observed in the region.
Functional food ingredients market is estimated to account for 9.5% of the overall food ingredients market which is inferred to be valued at USD 43.5 Bn in the year 2022.
Let us know your requirement to get
100% FREE customization
How The Market Progressed Till June 2022?
Particulars |
Details |
H1 2021 |
6.9% |
H1 2022 Projected |
7.0% |
H1 2022 Expected |
7.7% |
BPS Change |
- 77 ↓ |
A review and comparison of the market growth rates and future development possibilities in the APAC market are provided by FMI every six months. Instead of traditional convenience and junk food, customers are choosing nutritive convenience meals and nutritionally enhanced foods. More people are stocking up on healthy foods as a result of the shifting idea that the food cabinet functions as a medicine cabinet, especially in developed nations.
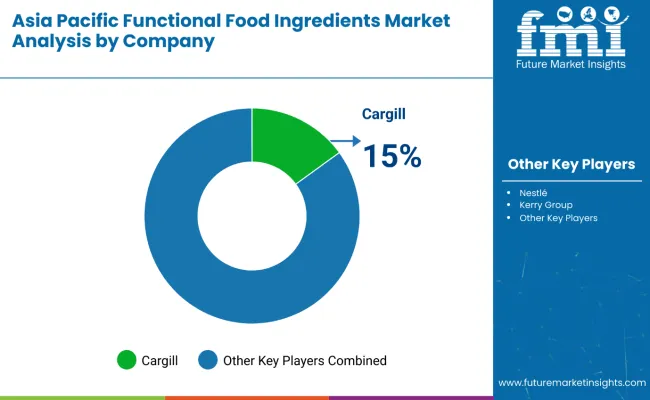
The market for functional food ingredients is fragmented, and the major producers only possess minor market shares. This is a result of the extensive selection of functional food additives produced by various producers. But there are significant international companies in the market for functional food additives.
Several recent changes have occurred in this market.
- To exploit Renmatix's technology for transforming waste plant matter into functional food ingredients, Cargill and Renmatix have formed a joint development agreement (JDA).
- Due to its capacity to improve flavor and scent, encapsulation technology is increasingly being included in the production process of a wide range of products for both niche usage, such as in gourmet meals, and for newborn feeding.
- Four new organic Probiotic Wellness Shots have been introduced by Ginger Shots, Inc. under the Tulua brand. Each health shot contains quality cold-pressed organic juices, special combinations of beneficial nutrients, and a billion CFU of probiotics.
The market for APAC Functional Food Ingredients is expected to rise by 6.9% in the first half of 2021. However, the distribution of this increase is not equal across all geographical areas. The expected growth rate of the market is around 7.7%. Consequently, during H1 2022, there will be a -77 BPS point difference between expected and projected growth.
The slow market adoption during the first half of the forecast period is related to the health-conscious diet, as the system is developing quickly, driving demand for food fortification. The disparities in population health between nations are mostly a result of regional variations in dietary consumption.
The demand for functional food ingredients in the Asia Pacific region is expected to rise in the coming years as a result of a number of factors, including increasing rates of nutritional deficiencies and chronic illnesses, the government's new fortification programmes, the emergence of middle-class in emerging economies, the ageing of the global population, and growing interest in health and wellness.
Despite these promising possibilities, strict regulations have a negative impact on the expansion of the market for functional food additives. Due to these laws, businesses must compete for health claims by undertaking several clinical research and obtaining official certification, which raises the cost. High investment thus presents a challenge for emerging market players with constrained financial resources.
2017-2021 APAC Functional Food Ingredients Market Outlook in Comparison to 2022-2032 Growth Forecast
World consumption of food supplements has rapidly increased over the years due to increased awareness among consumers regarding leading a healthier lifestyle. Minerals, vitamins, hydrocolloids, prebiotics, antioxidants, plant extracts, carotenoids, and amino acids are among the functional food Ingredients found in fortified foods.
In developing markets, the health-conscious diet system is expanding rapidly, fuelling demand for food fortification. Differences in nutritional consumption across regions play a significant role in the differences in population health across countries.
Numerous factors, including rising rates of micronutrient deficiencies and chronic diseases, new government fortification programs, the rise of the middle class in emerging economies, the world's ageing population, and increased interest in health and wellness, are anticipated to boost sales of fortified foods in the coming years, thereby increasing Asia Pacific functional food ingredients market demand.
Country-wise Analysis
Functional Food Ingredients Market Scenario in China
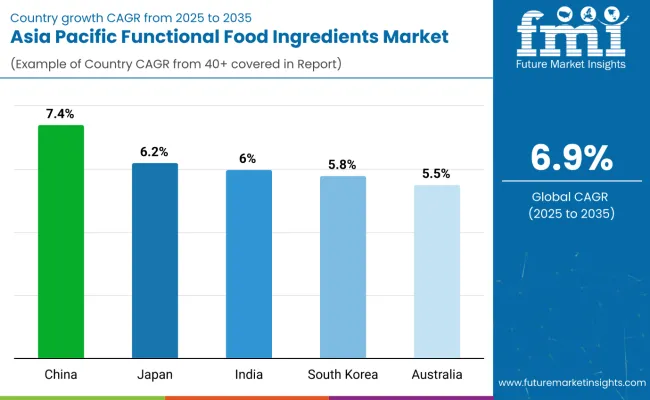
China dominates the functional food ingredient market in the APAC region due to the ubiquity of chronic diseases as a result of the hectic lifestyle of the consumers in the country, in addition to increased awareness regarding the benefits of functional food ingredients.
Furthermore, the food consumption patterns in China have shifted significantly as living standards have improved, exposing more consumers to a broader range of consumer products, particularly functional ingredients products. Because of the popularity of convenience foods, the food industry's demand for emulsifiers has increased, making China the largest market in Asia Pacific functional food ingredients products.
The functional food ingredient industry in China is currently focusing on higher investments in research and development programs as an effort to introduce new ingredients to meet the diversified demand from the consumers. These aforementioned factors are likely to positively impact the market in China and witness sales growth over the forecast period.
Japan Functional Food Ingredients Market to Show Positive Growth
In recent years, Japanese manufacturers in the functional food ingredient market have been trying to make their products more nutritious, following the ongoing high-protein trend in the food and beverage industry.
Consumer awareness in the country regarding anti-ageing, weight management, and other health issues by consuming naturally-sourced protein is enabling many producers to offer protein-fortified products with health benefits in the market. This trend has been an extensive driver for the growth of functional food ingredients in Japan.
Find your sweet spots for generating winning opportunities in this market.
Talk to AnalystCategory-wise Insights
Increase in Demand for Carotenoids Is Going to Drive the Market Growth
Carotenoids are naturally occurring pigments found in most plants that act as antioxidants and are found primarily in algae, plants, and photosynthetic bacteria; however, humans and animals must rely on food to obtain these compounds. As a result, the product has witnessed an increase in demand from the functional food market as it is extensively being used by manufacturers in the F&B industry.
These are widely used as natural, safe colorants in feed, food, and cosmetics. Being necessary for photosynthesis and plant growth, they are also the main source of vitamin A in the human diet. They lower the risk of a variety of chronic health problems, including heart disease, cancer and macular degeneration. These aforementioned benefits of carotenoids are likely to create a lucrative market for the product in the forecast period.
Increased Application of Functional Food Ingredients in Beverages to Boost Product Sales
Minerals, vitamins and proteins are some of the functional food ingredients that are extensively used in the production of beverages specifically energy drinks. This is owing to the fact that multiple manufacturers in the beverage industry are developing drinks for special purposes such as health and medical benefits like improving immunity, heart health, boost energy to mention a few.
Furthermore, suppliers are focusing on broadening their offerings in the sports beverage segment by introducing new ingredients that better meet the functional expectations of the consumers and enhance nutritional benefits. In the long run, these strategies adopted by manufacturers in the beverage industry are likely to positively fuel the sales of functional food ingredients.
Competition Landscape: Top APAC Functional Food Ingredients Companies
Some of the key players in the APAC functional food ingredients market include Archer Daniels Midland Company, Cargill, Incorporated, BASF SE, Arla Foods Ingredients Group P/S, Kerry Group PLC, E. I. DuPont De Nemours and Company, Corbion N.V, AkzoNobel N.V., Tate & Lyle PLC, Jungbunzlauer Suisse AG, Ingredion Inc., Koninklijke DSM N.V., Supreem Pharmaceuticals Mysore Pvt. Ltd., and APAC Specialty Ingredients (M) Sdn. Bhd. (GSI), FENCHEM BIOTEK LTD., Bio Actives Japan Corporation among others.
The functional food ingredients market is fragmented, and the key manufacturers hold small shares in the market. This is due to the wide range of functional food ingredients manufactured by separate manufacturers. However, prominent players in the functional food ingredients market have a notable global presence.
For instance:
- In November 2021, ADM acquired Deerland Probiotics & Enzymes to meet the increasing demand from consumers for functional food ingredients.

An unified Market Research Subscription Platform, built for today’s disparate research needs.
Scope of Report
Attribute |
Details |
Market Size Value in 2021 |
USD 3,867.9 Million |
Market Forecast Value in 2032 |
USD 8,141.5 Million |
Global Growth Rate |
7% |
Forecast Period |
2022-2032 |
Historical Data Available for |
2017-2021 |
Market Analysis |
MT for Volume and USD Mn for Value |
Key Regions Covered |
APAC |
Key Countries Covered |
China, India, Japan, ASEAN, Australia and New Zealand, South Korea and the Rest of APAC |
Key Market Segments Covered |
Ingredient Type, Application and Countries |
Key Companies Profiled |
|
Pricing |
Available upon Request |
Market Segments Covered in APAC Functional Food Ingredients Industry Analysis
By Ingredient Type:
- Vitamins
- Minerals
- Prebiotic & Dietary Fibers
- Probiotics
- Carotenoids
- Proteins
- Omega-3 Fatty Acids
By Application:
- Beverages
- Dairy and Dairy-based Products
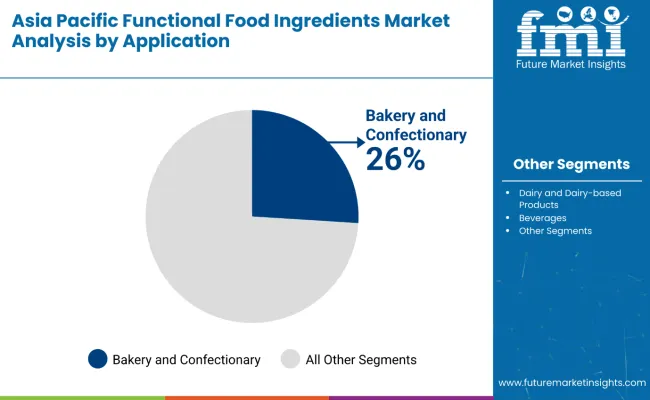
- Bakery and Confectionary
By Country:
- China
- India
- Japan
- ASEAN
- Australia and New Zealand
- South Korea
- Rest of APAC
Frequently Asked Questions
Currently APAC functional food ingredients market is worth more than USD 3,867.9 Mn.
APAC functional food ingredients market is expected to grow at a CAGR of around 7% during the period 2022-2032
APAC functional food ingredients market is anticipated to reach a valuation of USD 8,141.5 Mn by 2032.
Archer Daniels Midland Company, BASF SE, Cargill, Incorporated, Arla Foods Ingredients Group P/S, E. I. DuPont De Nemours and Company, Kerry Group PLC, Corbion N.V, Tate & Lyle PLC, are the prominent players in the market.
The China, Japan, Australia and New Zealand are the major countries driving demand for APAC functional food ingredients.
The most common type of APAC functional food ingredients are vitamins, minerals, prebiotics, probiotics, etc.
Table of Content
1. Market Overview
1.1. Market Coverage / Taxonomy
1.2. Market Definition / Scope / Limitations
2. The Massive Impact of the Crisis
2.1. APAC Functional Food Ingredients Market Forecast Scenario Comparison of Annual Growth Rates for Short Term (2022-2025) and Long Term (2026-2032)
2.1.1. Optimistic Scenario
2.1.1.1. China
2.1.1.2. India
2.1.1.3. Japan
2.1.1.4. ASEAN
2.1.1.5. Australia and New Zealand
2.1.1.6. South Korea
2.1.1.7. Rest of APAC
2.1.2. Likely Scenario
2.1.2.1. China
2.1.2.2. India
2.1.2.3. Japan
2.1.2.4. ASEAN
2.1.2.5. Australia and New Zealand
2.1.2.6. South Korea
2.1.2.7. Rest of APAC
2.1.3. Pessimistic Scenario
2.1.3.1. China
2.1.3.2. India
2.1.3.3. Japan
2.1.3.4. ASEAN
2.1.3.5. Australia and New Zealand
2.1.3.6. South Korea
2.1.3.7. Rest of APAC
2.2. Key Factors Impacting the Market
Note: Market Assessment shall be Provided for Likely Scenario
3. Market Background
3.1. APAC Functional Food Ingredients Production Outlook
3.2. Positive Impact: Consumption of Fortified Food
3.3. Intake of Functional Beverages
3.4. Application Opportunities in Dairy Products
3.5. Product Claims & Nutritional Information Scan by Buyers
3.6. Macro-Economic Factors
3.7. Forecast Factors - Relevance & Impact
3.8. Consumers Survey Analysis
3.9. Market Dynamics
3.9.1. Supply Side Drivers
3.9.2. Demand Side drivers
3.9.3. Economic Side Drivers
3.9.4. Restraints
3.9.5. Opportunity
3.9.6. Trends
4. Key Regulations
4.1. FDA Regulations
4.2. EU Regulations
4.3. Packaging & Labelling Regulations
4.4. Certifications and Certifying Agency Overview
4.5. Import/Export Policies
5. APAC Functional Food Ingredients Market - Production and Trade Analysis
5.1. Total Production Volume (MT), (2022E)
5.1.1. China
5.1.2. India
5.1.3. Japan
5.1.4. ASEAN
5.1.5. Australia and New Zealand
5.1.6. South Korea
5.1.7. Rest of APAC
5.2. APAC Functional Food Ingredients Market- Exports to the World
5.2.1. Key Exporting Countries- Market Share Analysis (2022E)
5.2.2. Value (USD Mn) of Export/ Volume (MT) of Export
5.3. APAC Functional Food Ingredients Market- Imports to the World
5.3.1. Key importing Countries- Market Share Analysis (2022E)
5.3.2. Value (USD Mn) of Import/ Volume (MT) of Import
5.4. Comparative Analysis of Brands by Key Importing Countries
5.5. APAC Functional Food Ingredients Market - Supply Demand Scenario (Production, Sales, Import, Export)
6. APAC Functional Food Ingredients Market Demand Analysis 2017-2021 and Forecast, 2022-2032
6.1. Historical Market Volume (Metric Tons) Analysis, 2017-2021
6.2. Current and Future Market Volume (Metric Tons) Projections, 2022-2032
6.3. Y-o-Y Growth Trend Analysis 2022-2032
7. APAC Functional Food Ingredients Market - Pricing Analysis
7.1. Country Wise Pricing Analysis (USD/Metric Ton) By Ingredient Type (2017,2022,2032)
7.1.1. Vitamins
7.1.2. Minerals
7.1.3. Prebiotic & Dietary Fibres
7.1.4. Probiotics
7.1.5. Carotenoids
7.1.6. Proteins
7.1.7. Omega-3 Fatty Acids
7.2. Pricing Break-up (2017,2022,2032)
7.2.1. Producer Level Pricing
7.2.2. Distributor Level Pricing
7.2.3. Retailer Level Pricing
7.3. Average Pricing Analysis Benchmark
8. APAC Functional Food Ingredients Market Demand (Size in USD Mn) Analysis 2017-2021 and Forecast, 2022-2032
8.1. Historical Market Value (USD Mn) Analysis, 2017-2021
8.2. Current and Future Market Value (USD Mn) Projections, 2022-2032
8.2.1. Y-o-Y Growth Trend Analysis
8.2.2. Absolute $ Opportunity Analysis
9. APAC Functional Food Ingredients Market Analysis 2017-2021 and Forecast 2022-2032, By Ingredient Type
9.1. Introduction / Key Findings
9.2. Historical Market Size (USD Mn) and Volume Analysis By Ingredient Type, 2017-2021
9.3. Current and Future Market Size (USD Mn) and Volume Analysis and Forecast By Ingredient Type, 2022-2032
9.3.1. Vitamins
9.3.2. Minerals
9.3.3. Prebiotic & Dietary fibres
9.3.4. Probiotics
9.3.5. Carotenoids
9.3.6. Proteins
9.3.7. Omega-3 Fatty Acids
9.4. Market Attractiveness Analysis By Ingredient Type
10. APAC Functional Food Ingredients Market Analysis 2017-2021 and Forecast 2022-2032, By Application
10.1. Introduction / Key Findings
10.2. Historical Market Size (USD Mn) and Volume Analysis By Application, 2017-2021
10.3. Current and Future Market Size (USD Mn) and Volume Analysis and Forecast By Application, 2022-2032
10.3.1. Beverages
10.3.2. Dairy and Dairy-based Products
10.3.3. Bakery and Confectionary
10.4. Market Attractiveness Analysis By Application
11. APAC Functional Food Ingredients Market Analysis 2017-2021 and Forecast 2022-2032, By Country
11.1. Introduction / Key Findings
11.2. Historical Market Size (USD Mn) and Volume Analysis By Country, 2017-2021
11.3. Current and Future Market Size (USD Mn) and Volume Analysis and Forecast By Country, 2022-2032
11.3.1. China
11.3.2. India
11.3.3. Japan
11.3.4. ASEAN
11.3.5. Australia and New Zealand
11.3.6. South Korea
11.3.7. Rest of APAC
11.4. Market Attractiveness Analysis By Country
12. China Functional Food Ingredients Market Analysis 2017-2021 and Forecast 2022-2032
12.1. Introduction
12.2. Pricing Analysis
12.3. Historical Market Size (USD Mn) and Volume Trend Analysis By Market Taxonomy, 2017-2021
12.4. Market Size (USD Mn) and Volume Forecast By Market Taxonomy, 2022 - 2032
12.4.1. By Ingredient Type
12.4.2. By Application
12.5. Market Attractiveness Analysis
12.5.1. By Ingredient Type
12.5.2. By Application
12.6. Market Trends
12.7. Key Market Participants - Intensity Mapping
12.8. Drivers and Restraints - Impact Analysis
13. India Functional Food Ingredients Market Analysis 2017-2021 and Forecast 2022-2032
13.1. Introduction
13.2. Pricing Analysis
13.3. Historical Market Size (USD Mn) and Volume Trend Analysis By Market Taxonomy, 2017-2021
13.4. Market Size (USD Mn) and Volume Forecast By Market Taxonomy, 2022 - 2032
13.4.1. By Ingredient Type
13.4.2. By Application
13.5. Market Attractiveness Analysis
13.5.1. By Ingredient Type
13.5.2. By Application
13.6. Market Trends
13.7. Key Market Participants - Intensity Mapping
13.8. Drivers and Restraints - Impact Analysis
14. Japan Functional Food Ingredients Market Analysis 2017-2021and Forecast 2022-2032
14.1. Introduction
14.2. Pricing Analysis
14.3. Historical Market Size (USD Mn) and Volume Trend Analysis By Market Taxonomy, 2017-2021
14.4. Market Size (USD Mn) and Volume Forecast By Market Taxonomy, 2022 - 2032
14.4.1. By Ingredient Type
14.4.2. By Application
14.5. Market Attractiveness Analysis
14.5.1. By Ingredient Type
14.5.2. By Application
14.6. Market Trends
14.7. Key Market Participants - Intensity Mapping
14.8. Drivers and Restraints - Impact Analysis
15. ASEAN Functional Food Ingredients Market Analysis 2017-2021 and Forecast 2022-2032
15.1. Introduction
15.2. Pricing Analysis
15.3. Historical Market Size (USD Mn) and Volume Trend Analysis By Market Taxonomy, 2017-2021
15.4. Market Size (USD Mn) and Volume Forecast By Market Taxonomy, 2022 - 2032
15.4.1. By Ingredient Type
15.4.2. By Application
15.5. Market Attractiveness Analysis
15.5.1. By Ingredient Type
15.5.2. By Application
15.6. Market Trends
15.7. Key Market Participants - Intensity Mapping
15.8. Drivers and Restraints - Impact Analysis
16. Australia and New Zealand Functional Food Ingredients Market Analysis 2017-2021 and Forecast 2022-2032
16.1. Introduction
16.2. Pricing Analysis
16.3. Historical Market Size (USD Mn) and Volume Trend Analysis By Market Taxonomy, 2017-2021
16.4. Market Size (USD Mn) and Volume Forecast By Market Taxonomy, 2022 - 2032
16.4.1. By Ingredient Type
16.4.2. By Application
16.5. Market Attractiveness Analysis
16.5.1. By Ingredient Type
16.5.2. By Application
16.6. Market Trends
16.7. Key Market Participants - Intensity Mapping
16.8. Drivers and Restraints - Impact Analysis
17. South Korea Functional Food Ingredients Market Analysis 2017-2021 and Forecast 2022-2032
17.1. Introduction
17.2. Pricing Analysis
17.3. Historical Market Size (USD Mn) and Volume Trend Analysis By Market Taxonomy, 2017-2021
17.4. Market Size (USD Mn) and Volume Forecast By Market Taxonomy, 2022 - 2032
17.4.1. By Ingredient Type
17.4.2. By Application
17.5. Market Attractiveness Analysis
17.5.1. By Ingredient Type
17.5.2. By Application
17.6. Market Trends
17.7. Key Market Participants - Intensity Mapping
17.8. Drivers and Restraints - Impact Analysis
18. Rest of APAC Functional Food Ingredients Market Analysis 2017-2021 and Forecast 2022-2032
18.1. Introduction
18.2. Pricing Analysis
18.3. Historical Market Size (USD Mn) and Volume Trend Analysis By Market Taxonomy, 2017-2021
18.4. Market Size (USD Mn) and Volume Forecast By Market Taxonomy, 2022 - 2032
18.4.1. By Ingredient Type
18.4.2. By Application
18.5. Market Attractiveness Analysis
18.5.1. By Ingredient Type
18.5.2. By Application
18.6. Market Trends
18.7. Key Market Participants - Intensity Mapping
18.8. Drivers and Restraints - Impact Analysis
19. Market Structure Analysis
19.1. Market Analysis by Tier of Companies
19.2. Company Share Analysis of Top Players
19.2.1. By Ingredient Type
19.2.2. By Country
19.3. Market Presence Analysis
19.3.1. Country Wise Footprint of Players
19.3.2. Product Footprint by Players
19.3.3. Channel Footprint by Players
20. Competition Deep Dive (Tentative List)
20.1. Archer Daniels Midland Company
20.1.1.1. Overview
20.1.1.2. Product Portfolio
20.1.1.3. Profitability by Market Segments
20.1.1.4. Sales Footprint
20.1.1.5. SWOT Analysis
20.1.1.6. Strategy Overview
20.1.1.6.1. Product Strategy
20.1.1.6.2. Channel Strategy
20.2. BASF SE
20.2.1.1. Overview
20.2.1.2. Product Portfolio
20.2.1.3. Profitability by Market Segments
20.2.1.4. Sales Footprint
20.2.1.5. SWOT Analysis
20.2.1.6. Strategy Overview
20.2.1.6.1. Product Strategy
20.2.1.6.2. Channel Strategy
20.3. Cargill, Incorporated
20.3.1.1. Overview
20.3.1.2. Product Portfolio
20.3.1.3. Profitability by Market Segments
20.3.1.4. Sales Footprint
20.3.1.5. SWOT Analysis
20.3.1.6. Strategy Overview
20.3.1.6.1. Product Strategy
20.3.1.6.2. Channel Strategy
20.4. Arla Foods Ingredients Group P/S
20.4.1.1. Overview
20.4.1.2. Product Portfolio
20.4.1.3. Profitability by Market Segments
20.4.1.4. Sales Footprint
20.4.1.5. SWOT Analysis
20.4.1.6. Strategy Overview
20.4.1.6.1. Product Strategy
20.4.1.6.2. Channel Strategy
20.5. E. I. DuPont De Nemours and Company
20.5.1.1. Overview
20.5.1.2. Product Portfolio
20.5.1.3. Profitability by Market Segments
20.5.1.4. Sales Footprint
20.5.1.5. SWOT Analysis
20.5.1.6. Strategy Overview
20.5.1.6.1. Product Strategy
20.5.1.6.2. Channel Strategy
20.6. Kerry Group PLC
20.6.1.1. Overview
20.6.1.2. Product Portfolio
20.6.1.3. Profitability by Market Segments
20.6.1.4. Sales Footprint
20.6.1.5. SWOT Analysis
20.6.1.6. Strategy Overview
20.6.1.6.1. Product Strategy
20.6.1.6.2. Channel Strategy
20.7. Corbion N.V
20.7.1.1. Overview
20.7.1.2. Product Portfolio
20.7.1.3. Profitability by Market Segments
20.7.1.4. Sales Footprint
20.7.1.5. SWOT Analysis
20.7.1.6. Strategy Overview
20.7.1.6.1. Product Strategy
20.7.1.6.2. Channel Strategy
20.8. Tate & Lyle PLC
20.8.1.1. Overview
20.8.1.2. Product Portfolio
20.8.1.3. Profitability by Market Segments
20.8.1.4. Sales Footprint
20.8.1.5. SWOT Analysis
20.8.1.6. Strategy Overview
20.8.1.6.1. Product Strategy
20.8.1.6.2. Channel Strategy
20.9. AkzoNobel N.V.
20.9.1.1. Overview
20.9.1.2. Product Portfolio
20.9.1.3. Profitability by Market Segments
20.9.1.4. Sales Footprint
20.9.1.5. SWOT Analysis
20.9.1.6. Strategy Overview
20.9.1.6.1. Product Strategy
20.9.1.6.2. Channel Strategy
20.10. Jungbunzlauer Suisse AG
20.10.1.1. Overview
20.10.1.2. Product Portfolio
20.10.1.3. Profitability by Market Segments
20.10.1.4. Sales Footprint
20.10.1.5. SWOT Analysis
20.10.1.6. Strategy Overview
20.10.1.6.1. Product Strategy
20.10.1.6.2. Channel Strategy
20.11. Ingredion Inc.
20.11.1.1. Overview
20.11.1.2. Product Portfolio
20.11.1.3. Profitability by Market Segments
20.11.1.4. Sales Footprint
20.11.1.5. SWOT Analysis
20.11.1.6. Strategy Overview
20.11.1.6.1. Product Strategy
20.11.1.6.2. Channel Strategy
20.12. Koninklijke DSM N.V.
20.12.1.1. Overview
20.12.1.2. Product Portfolio
20.12.1.3. Profitability by Market Segments
20.12.1.4. Sales Footprint
20.12.1.5. SWOT Analysis
20.12.1.6. Strategy Overview
20.12.1.6.1. Product Strategy
20.12.1.6.2. Channel Strategy
20.13. APAC Specialty Ingredients (M) Sdn. Bhd. (GSI)
20.13.1.1. Overview
20.13.1.2. Product Portfolio
20.13.1.3. Profitability by Market Segments
20.13.1.4. Sales Footprint
20.13.1.5. SWOT Analysis
20.13.1.6. Strategy Overview
20.13.1.6.1. Product Strategy
20.13.1.6.2. Channel Strategy
20.14. Supreem Pharmaceuticals Mysore Pvt. Ltd.
20.14.1.1. Overview
20.14.1.2. Product Portfolio
20.14.1.3. Profitability by Market Segments
20.14.1.4. Sales Footprint
20.14.1.5. SWOT Analysis
20.14.1.6. Strategy Overview
20.14.1.6.1. Product Strategy
20.14.1.6.2. Channel Strategy
20.15. Bio Actives Japan Corporation
20.15.1.1. Overview
20.15.1.2. Product Portfolio
20.15.1.3. Profitability by Market Segments
20.15.1.4. Sales Footprint
20.15.1.5. SWOT Analysis
20.15.1.6. Strategy Overview
20.15.1.6.1. Product Strategy
20.15.1.6.2. Channel Strategy
20.16. FENCHEM BIOTEK LTD.
20.16.1.1. Overview
20.16.1.2. Product Portfolio
20.16.1.3. Profitability by Market Segments
20.16.1.4. Sales Footprint
20.16.1.5. SWOT Analysis
20.16.1.6. Strategy Overview
20.16.1.6.1. Product Strategy
20.16.1.6.2. Channel Strategy
Note: Above list is subjected to change during the course of study
21. Assumptions and Acronyms Used
22. Research Methodology
Let us know your requirement to get
100% FREE customization
List of Tables
Table 1: APAC Functional Food Ingredient Types Market Value (USD Mn) and Forecast by Country, 2017–2021
Table 2: APAC Functional Food Ingredient Types Market Value (USD Mn) and Forecast by Country,2022–2032
Table 3: APAC Functional Food Ingredient Types Market Volume (MT) and Forecast by Country, 2017–2021
Table 4: APAC Functional Food Ingredient Types Market Volume (MT) and Forecast by Country,2022–2032
Table 5: APAC Functional Food Ingredient Types Market Value (USD Mn) and Forecast By Application, 2017–2021
Table 6: APAC Functional Food Ingredient Types Market Value (USD Mn) and Forecast By Application,2022–2032
Table 7: APAC Functional Food Ingredient Types Market Volume (MT) and Forecast By Application, 2017–2021
Table 8: APAC Functional Food Ingredient Types Market Volume (MT) and Forecast By Application,2022–2032
Table 9: APAC Functional Food Ingredient Types Market Value (USD Mn) and Forecast by Ingredient Type, 2017–2021
Table 10: APAC Functional Food Ingredient Types Market Value (USD Mn) and Forecast by Ingredient Type,2022–2032
Table 11: APAC Functional Food Ingredient Types Market Volume (MT) and Forecast by Ingredient Type, 2017–2021
Table 12: APAC Functional Food Ingredient Types Market Volume (MT) and Forecast by Ingredient Type,2022–2032
Table 13: China Functional Food Ingredient Types Market Value (USD Mn) and Forecast by Country, 2017–2021
Table 14: China Functional Food Ingredient Types Market Value (USD Mn) and Forecast by Country,2022–2032
Table 15: China Functional Food Ingredient Types Market Volume (MT) and Forecast by Country, 2017–2021
Table 16: China Functional Food Ingredient Types Market Volume (MT) and Forecast by Country,2022–2032
Table 17: China Functional Food Ingredient Types Market Value (USD Mn) and Forecast By Application, 2017–2021
Table 18: China Functional Food Ingredient Types Market Value (USD Mn) and Forecast By Application,2022–2032
Table 19: China Functional Food Ingredient Types Market Volume (MT) and Forecast By Application, 2017–2021
Table 20: China Functional Food Ingredient Types Market Volume (MT) and Forecast by Application,2022–2032
Table 21: China Functional Food Ingredient Types Market Value (USD Mn) and Forecast by Ingredient Type, 2017–2021
Table 22: China Functional Food Ingredient Types Market Value (USD Mn) and Forecast by Ingredient Type,2022–2032
Table 23: China Functional Food Ingredient Types Market Volume (MT) and Forecast by Ingredient Type, 2017–2021
Table 24: China Functional Food Ingredient Types Market Volume (MT) and Forecast by Ingredient Type,2022–2032
Table 25: India Functional Food Ingredient Types Market Value (USD Mn) and Forecast by Country, 2017–2021
Table 26: India Functional Food Ingredient Types Market Value (USD Mn) and Forecast by Country,2022–2032
Table 27: India Functional Food Ingredient Types Market Volume (MT) and Forecast by Country, 2017–2021
Table 28: India Functional Food Ingredient Types Market Volume (MT) and Forecast by Country,2022–2032
Table 29: India Functional Food Ingredient Types Market Value (USD Mn) and Forecast By Application, 2017–2021
Table 30: India Functional Food Ingredient Types Market Value (USD Mn) and Forecast By Application,2022–2032
Table 31: India Functional Food Ingredient Types Market Volume (MT) and Forecast By Application, 2017–2021
Table 32: India Functional Food Ingredient Types Market Volume (MT) and Forecast by Application,2022–2032
Table 33: India Functional Food Ingredient Types Market Value (USD Mn) and Forecast by Ingredient Type, 2017–2021
Table 34: India Functional Food Ingredient Types Market Value (USD Mn) and Forecast by Ingredient Type,2022–2032
Table 35: India Functional Food Ingredient Types Market Volume (MT) and Forecast by Ingredient Type, 2017–2021
Table 36: India Functional Food Ingredient Types Market Volume (MT) and Forecast by Ingredient Type,2022–2032
Table 37: Japan Functional Food Ingredient Types Market Value (USD Mn) and Forecast by Country, 2017–2021
Table 38: Japan Functional Food Ingredient Types Market Value (USD Mn) and Forecast by Country,2022–2032
Table 39: Japan Functional Food Ingredient Types Market Volume (MT) and Forecast by Country, 2017–2021
Table 40: Japan Functional Food Ingredient Types Market Volume (MT) and Forecast by Country,2022–2032
Table 41: Japan Functional Food Ingredient Types Market Value (USD Mn) and Forecast By Application, 2017–2021
Table 42: Japan Functional Food Ingredient Types Market Value (USD Mn) and Forecast By Application,2022–2032
Table 43: Japan Functional Food Ingredient Types Market Volume (MT) and Forecast By Application, 2017–2021
Table 44: Japan Functional Food Ingredient Types Market Volume (MT) and Forecast by Application,2022–2032
Table 45: Japan Functional Food Ingredient Types Market Value (USD Mn) and Forecast by Ingredient Type, 2017–2021
Table 46: Japan Functional Food Ingredient Types Market Value (USD Mn) and Forecast by Ingredient Type,2022–2032
Table 47: Japan Functional Food Ingredient Types Market Volume (MT) and Forecast by Ingredient Type, 2017–2021
Table 48: Japan Functional Food Ingredient Types Market Volume (MT) and Forecast by Ingredient Type,2022–2032
Table 49: ASEAN Functional Food Ingredient Types Market Value (USD Mn) and Forecast by Country, 2017–2021
Table 50: ASEAN Functional Food Ingredient Types Market Value (USD Mn) and Forecast by Country,2022–2032
Table 51: ASEAN Functional Food Ingredient Types Market Volume (MT) and Forecast by Country, 2017–2021
Table 52: ASEAN Functional Food Ingredient Types Market Volume (MT) and Forecast by Country,2022–2032
Table 53: ASEAN Functional Food Ingredient Types Market Value (USD Mn) and Forecast By Application, 2017–2021
Table 54: ASEAN Functional Food Ingredient Types Market Value (USD Mn) and Forecast By Application,2022–2032
Table 55: ASEAN Functional Food Ingredient Types Market Volume (MT) and Forecast By Application, 2017–2021
Table 56: ASEAN Functional Food Ingredient Types Market Volume (MT) and Forecast by Application,2022–2032
Table 57: ASEAN Functional Food Ingredient Types Market Value (USD Mn) and Forecast by Ingredient Type, 2017–2021
Table 58: ASEAN Functional Food Ingredient Types Market Value (USD Mn) and Forecast by Ingredient Type,2022–2032
Table 59: ASEAN Functional Food Ingredient Types Market Volume (MT) and Forecast by Ingredient Type, 2017–2021
Table 60: ASEAN Functional Food Ingredient Types Market Volume (MT) and Forecast by Ingredient Type,2022–2032
Table 61: Australia and New Zealand Functional Food Ingredient Types Market Value (USD Mn) and Forecast by Country, 2017–2021
Table 62: Australia and New Zealand Functional Food Ingredient Types Market Value (USD Mn) and Forecast by Country,2022–2032
Table 63: Australia and New Zealand Functional Food Ingredient Types Market Volume (MT) and Forecast by Country, 2017–2021
Table 64: Australia and New Zealand Functional Food Ingredient Types Market Volume (MT) and Forecast by Country,2022–2032
Table 65: Australia and New Zealand Functional Food Ingredient Types Market Value (USD Mn) and Forecast By Application, 2017–2021
Table 66: Australia and New Zealand Functional Food Ingredient Types Market Value (USD Mn) and Forecast By Application,2022–2032
Table 67: Australia and New Zealand Functional Food Ingredient Types Market Volume (MT) and Forecast By Application, 2017–2021
Table 68: Australia and New Zealand Functional Food Ingredient Types Market Volume (MT) and Forecast by Application,2022–2032
Table 69: Australia and New Zealand Functional Food Ingredient Types Market Value (USD Mn) and Forecast by Ingredient Type, 2017–2021
Table 70: Australia and New Zealand Functional Food Ingredient Types Market Value (USD Mn) and Forecast by Ingredient Type,2022–2032
Table 71: Australia and New Zealand Functional Food Ingredient Types Market Volume (MT) and Forecast by Ingredient Type, 2017–2021
Table 72: Australia and New Zealand Functional Food Ingredient Types Market Volume (MT) and Forecast by Ingredient Type,2022–2032
Table 73: South Korea Functional Food Ingredient Types Market Value (USD Mn) and Forecast by Country, 2017–2021
Table 74: South Korea Functional Food Ingredient Types Market Value (USD Mn) and Forecast by Country,2022–2032
Table 75: South Korea Functional Food Ingredient Types Market Volume (MT) and Forecast by Country, 2017–2021
Table 76: South Korea Functional Food Ingredient Types Market Volume (MT) and Forecast by Country,2022–2032
Table 77: South Korea Functional Food Ingredient Types Market Value (USD Mn) and Forecast By Application, 2017–2021
Table 78: South Korea Functional Food Ingredient Types Market Value (USD Mn) and Forecast By Application,2022–2032
Table 79: South Korea Functional Food Ingredient Types Market Volume (MT) and Forecast By Application, 2017–2021
Table 80: South Korea Functional Food Ingredient Types Market Volume (MT) and Forecast by Application,2022–2032
Table 81: South Korea Functional Food Ingredient Types Market Value (USD Mn) and Forecast by Ingredient Type, 2017–2021
Table 82: South Korea Functional Food Ingredient Types Market Value (USD Mn) and Forecast by Ingredient Type,2022–2032
Table 83: South Korea Functional Food Ingredient Types Market Volume (MT) and Forecast by Ingredient Type, 2017–2021
Table 84: South Korea Functional Food Ingredient Types Market Volume (MT) and Forecast by Ingredient Type,2022–2032
Table 85: Rest of APAC Functional Food Ingredient Types Market Value (USD Mn) and Forecast by Country, 2017–2021
Table 86: Rest of APAC Functional Food Ingredient Types Market Value (USD Mn) and Forecast by Country,2022–2032
Table 87: Rest of APAC Functional Food Ingredient Types Market Volume (MT) and Forecast by Country, 2017–2021
Table 88: Rest of APAC Functional Food Ingredient Types Market Volume (MT) and Forecast by Country,2022–2032
Table 89: Rest of APAC Functional Food Ingredient Types Market Value (USD Mn) and Forecast By Application, 2017–2021
Table 90: Rest of APAC Functional Food Ingredient Types Market Value (USD Mn) and Forecast By Application,2022–2032
Table 91: Rest of APAC Functional Food Ingredient Types Market Volume (MT) and Forecast By Application, 2017–2021
Table 92: Rest of APAC Functional Food Ingredient Types Market Volume (MT) and Forecast by Application,2022–2032
Table 93: Rest of APAC Functional Food Ingredient Types Market Value (USD Mn) and Forecast by Ingredient Type, 2017–2021
Table 94: Rest of APAC Functional Food Ingredient Types Market Value (USD Mn) and Forecast by Ingredient Type,2022–2032
Table 95: Rest of APAC Functional Food Ingredient Types Market Volume (MT) and Forecast by Ingredient Type, 2017–2021
Table 96: Rest of APAC Functional Food Ingredient Types Market Volume (MT) and Forecast by Ingredient Type,2022–2032
Find your sweet spots for generating winning opportunities in this market.
Talk to AnalystList of Charts
Figure 1: APAC Functional Food Ingredient Types Market Value Share (%) and BPS Analysis by Country, 2017 & 2022 & 2032
Figure 2: APAC Functional Food Ingredient Types Market Y-o-Y Analysis by Country, 2022 to 2032
Figure 3: APAC Functional Food Ingredient Types Market Attractiveness, by Country, 2022 to 2032
Figure 4: APAC Functional Food Ingredient Types Market Value Share (%) and BPS Analysis by Application, 2017 & 2022 & 2032
Figure 5: APAC Functional Food Ingredient Types Market Y-o-Y Analysis by Application, 2022 to 2032
Figure 6: APAC Functional Food Ingredient Types Market Attractiveness, by Application, 2022 to 2032
Figure 7: APAC Functional Food Ingredient Types Market Value Share (%) and BPS Analysis by Ingredient Type, 2017 & 2022 & 2032
Figure 8: APAC Functional Food Ingredient Types Market Y-o-Y Analysis by Ingredient Type, 2022 to 2032
Figure 9: APAC Functional Food Ingredient Types Market Attractiveness, by Ingredient Type, 2022 to 2032
Figure 10: China Functional Food Ingredient Types Market Value Share (%) and BPS Analysis by Country, 2017 & 2022 & 2032
Figure 11: China Functional Food Ingredient Types Market Y-o-Y Analysis by Country, 2022 to 2032
Figure 12: China Functional Food Ingredient Types Market Attractiveness, by Country, 2022 to 2032
Figure 13: China Functional Food Ingredient Types Market Value Share (%) and BPS Analysis by Application, 2017 & 2022 & 2032
Figure 14: China Functional Food Ingredient Types Market Y-o-Y Analysis by Application, 2022 to 2032
Figure 15: China Functional Food Ingredient Types Market Attractiveness, by Application, 2022 to 2032
Figure 16: China Functional Food Ingredient Types Market Value Share (%) and BPS Analysis by Ingredient Type, 2017 & 2022 & 2032
Figure 17: China Functional Food Ingredient Types Market Y-o-Y Analysis by Ingredient Type, 2022 to 2032
Figure 18: China Functional Food Ingredient Types Market Attractiveness, by Ingredient Type, 2022 to 2032
Figure 19: India Functional Food Ingredient Types Market Value Share (%) and BPS Analysis by Country, 2017 & 2022 & 2032
Figure 20: India Functional Food Ingredient Types Market Y-o-Y Analysis by Country, 2022 to 2032
Figure 21: India Functional Food Ingredient Types Market Attractiveness, by Country, 2022 to 2032
Figure 22: India Functional Food Ingredient Types Market Value Share (%) and BPS Analysis by Application, 2017 & 2022 & 2032
Figure 23: India Functional Food Ingredient Types Market Y-o-Y Analysis by Application, 2022 to 2032
Figure 24: India Functional Food Ingredient Types Market Attractiveness, by Application, 2022 to 2032
Figure 25: India Functional Food Ingredient Types Market Value Share (%) and BPS Analysis by Ingredient Type, 2017 & 2022 & 2032
Figure 26: India Functional Food Ingredient Types Market Y-o-Y Analysis by Ingredient Type, 2022 to 2032
Figure 27: India Functional Food Ingredient Types Market Attractiveness, by Ingredient Type, 2022 to 2032
Figure 28: Japan Functional Food Ingredient Types Market Value Share (%) and BPS Analysis by Country, 2017 & 2022 & 2032
Figure 29: Japan Functional Food Ingredient Types Market Y-o-Y Analysis by Country, 2022 to 2032
Figure 30: Japan Functional Food Ingredient Types Market Attractiveness, by Country, 2022 to 2032
Figure 31: Japan Functional Food Ingredient Types Market Value Share (%) and BPS Analysis by Application, 2017 & 2022 & 2032
Figure 32: Japan Functional Food Ingredient Types Market Y-o-Y Analysis by Application, 2022 to 2032
Figure 33: Japan Functional Food Ingredient Types Market Attractiveness, by Application, 2022 to 2032
Figure 34: Japan Functional Food Ingredient Types Market Value Share (%) and BPS Analysis by Ingredient Type, 2017 & 2022 & 2032
Figure 35: Japan Functional Food Ingredient Types Market Y-o-Y Analysis by Ingredient Type, 2022 to 2032
Figure 36: Japan Functional Food Ingredient Types Market Attractiveness, by Ingredient Type, 2022 to 2032
Figure 37: ASEAN Functional Food Ingredient Types Market Value Share (%) and BPS Analysis by Country, 2017 & 2022 & 2032
Figure 38: ASEAN Functional Food Ingredient Types Market Y-o-Y Analysis by Country, 2022 to 2032
Figure 39: ASEAN Functional Food Ingredient Types Market Attractiveness, by Country, 2022 to 2032
Figure 40: ASEAN Functional Food Ingredient Types Market Value Share (%) and BPS Analysis by Application, 2017 & 2022 & 2032
Figure 41: ASEAN Functional Food Ingredient Types Market Y-o-Y Analysis by Application, 2022 to 2032
Figure 42: ASEAN Functional Food Ingredient Types Market Attractiveness, by Application, 2022 to 2032
Figure 43: ASEAN Functional Food Ingredient Types Market Value Share (%) and BPS Analysis by Ingredient Type, 2017 & 2022 & 2032
Figure 44: ASEAN Functional Food Ingredient Types Market Y-o-Y Analysis by Ingredient Type, 2022 to 2032
Figure 45: ASEAN Functional Food Ingredient Types Market Attractiveness, by Ingredient Type, 2022 to 2032
Figure 46: Australia and New Zealand Functional Food Ingredient Types Market Value Share (%) and BPS Analysis by Country, 2017 & 2022 & 2032
Figure 47: Australia and New Zealand Functional Food Ingredient Types Market Y-o-Y Analysis by Country, 2022 to 2032
Figure 48: Australia and New Zealand Functional Food Ingredient Types Market Attractiveness, by Country, 2022 to 2032
Figure 49: Australia and New Zealand Functional Food Ingredient Types Market Value Share (%) and BPS Analysis by Application, 2017 & 2022 & 2032
Figure 50: Australia and New Zealand Functional Food Ingredient Types Market Y-o-Y Analysis by Application, 2022 to 2032
Figure 51: Australia and New Zealand Functional Food Ingredient Types Market Attractiveness, by Application, 2022 to 2032
Figure 52: Australia and New Zealand Functional Food Ingredient Types Market Value Share (%) and BPS Analysis by Ingredient Type, 2017 & 2022 & 2032
Figure 53: Australia and New Zealand Functional Food Ingredient Types Market Y-o-Y Analysis by Ingredient Type, 2022 to 2032
Figure 54: Australia and New Zealand Functional Food Ingredient Types Market Attractiveness, by Ingredient Type, 2022 to 2032
Figure 55: South Korea Functional Food Ingredient Types Market Value Share (%) and BPS Analysis by Country, 2017 & 2022 & 2032
Figure 56: South Korea Functional Food Ingredient Types Market Y-o-Y Analysis by Country, 2022 to 2032
Figure 57: South Korea Functional Food Ingredient Types Market Attractiveness, by Country, 2022 to 2032
Figure 58: South Korea Functional Food Ingredient Types Market Value Share (%) and BPS Analysis by Application, 2017 & 2022 & 2032
Figure 59: South Korea Functional Food Ingredient Types Market Y-o-Y Analysis by Application, 2022 to 2032
Figure 60: South Korea Functional Food Ingredient Types Market Attractiveness, by Application, 2022 to 2032
Figure 61: South Korea Functional Food Ingredient Types Market Value Share (%) and BPS Analysis by Ingredient Type, 2017 & 2022 & 2032
Figure 62: South Korea Functional Food Ingredient Types Market Y-o-Y Analysis by Ingredient Type, 2022 to 2032
Figure 63: South Korea Functional Food Ingredient Types Market Attractiveness, by Ingredient Type, 2022 to 2032
Figure 64: Rest of APAC Functional Food Ingredient Types Market Value Share (%) and BPS Analysis by Country, 2017 & 2022 & 2032
Figure 65: Rest of APAC Functional Food Ingredient Types Market Y-o-Y Analysis by Country, 2022 to 2032
Figure 66: Rest of APAC Functional Food Ingredient Types Market Attractiveness, by Country, 2022 to 2032
Figure 67: Rest of APAC Functional Food Ingredient Types Market Value Share (%) and BPS Analysis by Application, 2017 & 2022 & 2032
Figure 68: Rest of APAC Functional Food Ingredient Types Market Y-o-Y Analysis by Application, 2022 to 2032
Figure 69: Rest of APAC Functional Food Ingredient Types Market Attractiveness, by Application, 2022 to 2032
Figure 70: Rest of APAC Functional Food Ingredient Types Market Value Share (%) and BPS Analysis by Ingredient Type, 2017 & 2022 & 2032
Figure 71: Rest of APAC Functional Food Ingredient Types Market Y-o-Y Analysis by Ingredient Type, 2022 to 2032
Figure 72: Rest of APAC Functional Food Ingredient Types Market Attractiveness, by Ingredient Type, 2022 to 2032
Need specific information?
Request CustomizationExplore Food and Beverage Insights
View Reports