Asian Sea Bass Market
Market Insights on Asian Sea Bass covering sales outlook, demand forecast & up-to-date key trends
Asian Sea Bass Market By Source (Farmed Asian Sea Bass [Freshwater Asian Sea Bass, Brakishwater Asian Sea Bass], Wild Asian Sea Bass], Form (Whole Asian Sea Bass, Headed and Gutted Asian Sea Bass, Fillet Asian Sea Bass, Frozen Asian Sea Bass), Sales Channel (Direct Sales-B2B, Food Service, Retail Sales) & Region - Forecast to 2021 - 2031
Market Outlook
Asian sea bass, often known as a Barramundi, thrive in difficult habitats, unscrupulously migrating and reproducing. Manufacturers have identified a lucrative opportunity in the production of Asian sea bass as many countries are encouraging production for enhancing food security index. An increasing number of producers are using high end technologies, which has led to the increase in the number of commercial-medium sized farms.
According to the Food and Agriculture Organization (FAO), the manufacturing of finfishes is projected to grow by 7.5% over the next decade. This is expected to bode well for the market. Recently, developing countries such as India are exhibiting increasing consumption of Asian sea bass. This can also be attributed to the rising awareness regarding the many health benefits of high protein and omega 3 fatty acids in Asian sea bass.
In its new study, ESOMAR-certified market research and consulting firm Future Market Insights (FMI) offers insights about key factors driving demand for Asian sea bass. The report tracks the global sales of Asian sea bass in 20+ high-growth markets, along with analyzing the impact COVID-19 has had on the food and beverage industry in general, and Asian sea bass in particular.
Let us know your requirement to get
100% FREE customization
How the Historical and Future Outlook for Asian Sea Bass Market Match Up?
Asian sea bass is native to the Eastern Countries and Australia, and was first imported to India from Thailand in 1952. The commercialization of the market has brought in numerous developments for the production of large quantity and high quality Asian sea bass.
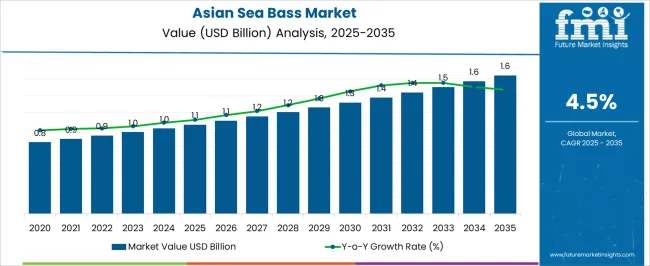
Different countries are issuing various guidelines for responsible farming of Asian sea bass, to ensure no environmental adversity is been created while farming. Currently over 91 Asian sea bass processing plants and 92 Asian sea bass farms are Best Aquaculture Practices (BAP) Certified, from which over 75% of farms are from China. According to FMI’s analysis, Asian sea bass sales have grown at 4.1% CAGR between 2016 and 2020.
Nowadays, the fish food sector has become more dynamic and heterogeneous. However, in more progressive economies, fish processing specialized predominantly in high-value processed and fresh products and ready and/or portion controlled, even-quality meals. Moreover, in many developing countries, fish handling has been outgrowing traditional methods to more innovative significance-adding procedures such as cooking, breeding and specific quick-freezing.
With increasing growth in fish consumption in Asian countries, particularly in Southeast Asia and eastern countries excluding Japan the focus on aquaculture has greatly surged. Coupled with this, increased international fish trade is also one of the key factors driving Asian sea bass market. FMI has projected the global Asian sea bass market to grow at 5.5% CAGR through 2031.
How Blue Growth Initiative is helping Asian Sea Bass Market to grow?
The expanding aquaculture and fisheries sector is threatened by depleting fish wealth. To safeguard the biosecurity and challenges posed by rising incidence of animal diseases several initiatives are undertaken by producers and policy-makers alike.
For instance FAO’s Blue Growth Initiative was integrated to manage aquatic resources while protecting the ecosystem. These initiatives also encompassed families and communities whose livelihoods are dependent on aquaculture and fisheries. Blue growth initiatives focuses on employment and livelihood, sound fisheries management to protect ecology, and food security and nutrition.
The implementation of favorable regulations such as these will continue enabling growth in the market.
Find your sweet spots for generating winning opportunities in this market.
Talk to AnalystHow is Demand for Essential Micronutrients Affecting Asian Sea Bass Sales?
As a valuable addition for nutritious and diversified diets, fish adds to food safety in numerous regions of the world. Moreover, fish is highly nutritious as it provides high value of protein, and an important source of minerals and fatty acids. Additionally, the dietary impact of fish remains as an added benefit in terms of animal proteins, which is measured as an essential constituent in some densely populated countries where proteins intake level total may be low. Hence, the increasing demand from both developed and developing countries has helped the Asian sea bass market to grow rapidly.
How Will Rapid Productivity in Aquaculture Affect Asian Sea Bass Market?
The increasing trend of breeding technology in aquaculture is driving the Asian sea bass market globally. Moreover, technologies such as biotechnology and genetic modification also hold great potential to improve the quantity and quality of fish cultivated in aquaculture. Additionally, biotechnology holds the prospective to boost reproduction and the early developmental success of cultured organisms. Technological advancements are expected to prove crucial for growth of the market.

A unified Market Research Subscription Platform, built for today's disparate research needs.
Country-wise Insights
How Big is the Opportunity in Indonesia for Asian Sea Bass market?
Developing countries such as Indonesia are anticipated to exhibit considerable growth. The aquaculture industry in Indonesia is adopting novel technology and production process to improve productivity and to overcome resource constraints. Asian sea bass market players in Indonesia have started acquiring Internet-of-Things (IoT) solutions and are striving to develop a robust R&D ecosystem to address the technology gaps.
Asian Sea Basses Have Become Common in Malaysia Fish Market
The rising demand for Asian sea bass fillets in Asian countries is creating high growth opportunities. Rising willingness to spend on good quality food will continue enabling growth in Malaysia. Asian sea bass is easy to farm and is considered an economic alternative for consumers willing to adapt seafood as a part of the regular diet.
How is Increasing Technological Affecting China Market?
China has one of the leading aquaculture industries in the world. According to IFFO, the Marine Ingredients Organization, the total sea bass output in China stood at 156,000 tons in 2018. Fujian Province, Guangdong Province (Zhuhai and Zhanjiang), Guangxi Province, Shandong Province, and Zhejiang Province are among key farming areas.
Manufacturers in China are striving for vertical integration to ensure quality standards are achieved at every stage of the supply chain. The country is also striving to achieve the maximum level of sustainability to strengthen its market position.
What Lucrative are Prospects for Australia Market?
Australia is the hot spot for Asian sea bass in the global market, in terms of both productions and consumption. The region is equipped with high end technology for Asian sea bass aquaculture. The country is extensively developing its infrastructure for Asian sea bass production by providing training to the workers, building capacity, and more to further strengthen its market position.
Australia and African countries are partnering for Asian sea bass production for the development of the industry by joint research projects. The country exports its products at a much cheaper rate than other countries such as China.
What is Driving the U.S. Market for Asian Sea Bass?
The United States is anticipated to register rapid growth in the consumption of Asian sea bass. Increasing demand for packaged food and inclusion of Asian sea bass dishes on the menu are primary factors enabling growth in the U.S. Regional consumers are specifically concerned about the labels for instance, non-GMO, organic, eco-friendly, and many more, which is a key trend followed by players in the U.S. market for Asian sea bass, as them at avoiding potential risk of adverse effect.
Category-wise Insights
Which is the Preferred Source for Asian Sea Bass?
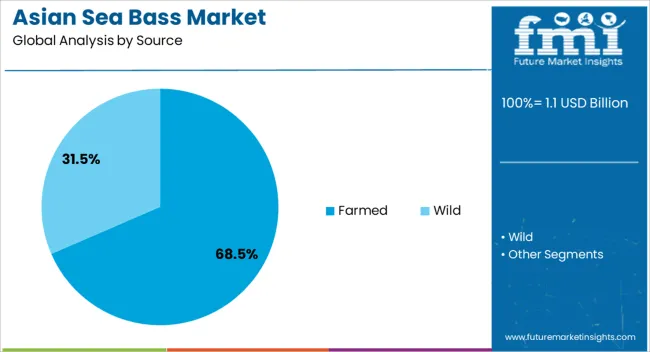
The farmed segment holds the largest share in the Asian sea bass market. The implementation of cage culture technologies and deep sea farming have been aiding Asian sea bass farming in both freshwater and brakish water, hence the demand for farmed Asian sea bass is increasing globally.
Why is the Top-selling Form of Asian Sea Bass?
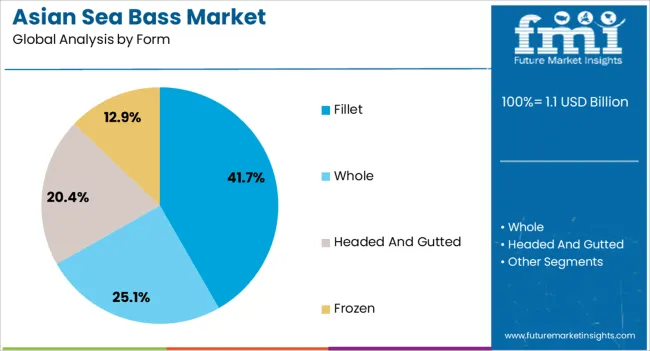
Due to the rising demand for packaged food and the food with greater shelf life, the fillet form of Asian sea bass is in great demand. Asian sea bass is traded globally in various countries in form of fillet due to convenient storage with extended shelf life.
Which is the Preferred Sales Channel for Asian Sea Bass?
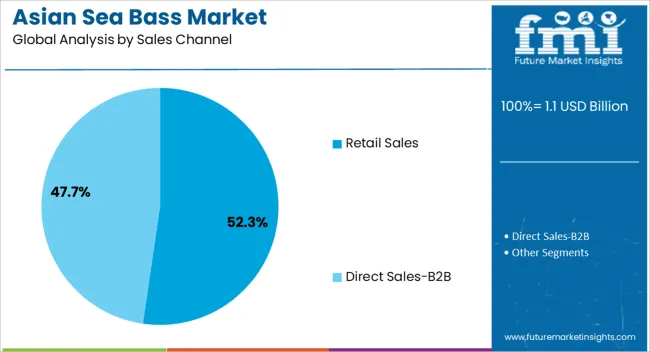
Online retail channels are anticipated to emerge as preferred sales channels. They are considered very convenient. Besides this, online channels offer greater transparency in terms of choice of products and price comparisons. However, discount stores and specialty food stores are also growing at a considerable rate.
Competitive Landscape
Key manufacturers in the Asian sea bass market are heavily investing in the research & development of improved Asian sea bass. Research & development is done with the aim of finding the appropriate farming practices to ascertain better yield with improved nutrients quantities. With changing climatic conditions, preservation of fingerlings for a long time is very essential so as to assure better fillet quality and quantity for worldwide export. Hence, research & development in the Asian sea bass market is essential.
Producers and processors are functioning together more narrowly to improve the product mix, achieve improved yields and react to progressing safety and quality requirements in introducing countries as well as consumers’ sustainability concerns. In addition, the outsourcing of processing activities to other countries and regions is common, although its extent depends on the species, product form, cost of labor and transportation.
For instance, scientists at Temasek Life Sciences and Singapore Food Agency have been successful in producing a new breed of Asian sea bass that is easy for rearing. Besides this, they are adopting various expansion strategies.
For instance, Allergo Aqua, which is a start-up, partnered with a Singapore based farm - Barramundi Asia to improve its capacity for the production of high quality bass.
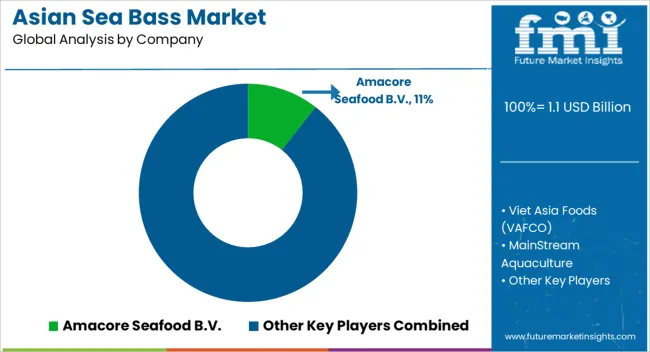
Some of the leading companies operating in the Asian sea bass market are:
- Amacore B.V.
- Viet Asia Foods (VAFCO)
- MainStream Aquaculture
- Shwe Yamone Manufacturing Co., Ltd.
- A.O.Kingdom.
- NGHI SON AQUATIC PRODUCT EXIM CO., LTD
- Oceanpick
- Barramundi Asia
- Allegro Aqua
- Mattes Seafood
- Ocean Treasure
*The list is not exhaustive, and only for representational purposes. Full competitive intelligence with SWOT analysis available in the report.
Scope of the Report
Attribute |
Details |
Forecast Period |
2021-2031 |
Historical Data Available for |
2016-2020 |
Market Analysis |
USD Million for Value and MT for Volume |
Key Regions Covered |
North America, Latin America, Europe, East Asia, South Asia, Oceania, MEA |
Key Countries Covered |
US, Canada, Brazil, Mexico, Rest of Latin America, Germany, Italy, France, U.K., Spain, BENELUX, Nordic, Russia, Poland, Rest of Europe, Japan, China, South Korea, India, Thailand, Indonesia, Malaysia, Singapore, Rest of South Asia, Australia, New Zealand, GCC Countries, South Africa, Rest of MEA |
Key Segments Covered |
Source, Form, Sales Channel, and Region |
Key Companies Profiled |
|
Report Coverage |
Market Forecast, brand share analysis, competition intelligence, Drivers, Restraints, Opportunities and Threats analysis, Key factors, Market Dynamics and Challenges, Strategic Growth Initiatives |
Customization & Pricing |
Asian sea bass Market by Category
By Source
- Farmed Asian Sea Bass
- Freshwater Asian Sea Bass
- Brakishwater Asian Sea Bass
- Wild Asian Sea Bass
By Form
- Whole Asian Sea Bass
- Headed and Gutted Asian Sea Bass
- Fillet Asian Sea Bass
- Frozen Asian Sea Bass
By Sales Channel
- Direct Sales-B2B
- Food Service
- Retail Sales
- Modern Trade
- Convenience Store
- Specialty Food Stores
- Wholesale Store
- Discount Stores
- Online Retail
- Other Retail Platform
By Region
- North America
- Latin America
- Europe
- East Asia
- South Asia
- Oceania
- Middle East & Africa
Frequently Asked Questions
At what rate is the demand for Asian sea bass is expected to grow?
The global Asian sea bass market is estimated to grow at CAGR of 5.0% over the next 5 years.
Which is the preferred Asian sea bass form?
Asian sea basses are more preferred in fillet form owing to increasing demand for extended shelf-life and ease of storage and handling.
Which are the leading companies in the Asian sea bass market?
Some of the leading companies operating in the market are Amacore B.V., Viet Asia Foods (VAFCO), MainStream Aquaculture, Shwe Yamone Manufacturing Co., Ltd., A.O.Kingdom., NGHI SON AQUATIC PRODUCT EXIM CO., LTD, Oceanpick, Barramundi Asia, Allegro Aqua, Mattes Seafood, Ocean Treasure among others.
Which is the Preferred Source of Asian Sea Bass?
Asian sea bass is primarily farmed in freshwater and brakishwater.
Table of Content
1. Executive Summary 1.1. Global Market Outlook 1.2. Demand-side Trends 1.3. Supply-side Trends 1.4. Analysis and Recommendations 2. Market Overview 2.1. Market Coverage / Taxonomy 2.2. Market Definition / Scope / Limitations 3. Asian Sea Bass Industry Needs Demand Growth to Absorb Expected Production Boost 3.1. Production Trend, 2015-2019 and Forecast, 2030 3.2. Inland Asian Sea Bass vs. Traditional Asian Sea Bass Farms (Category Wise) 4. Production Cost Analysis 4.1. Impact of Asian Sea Bass Culture Techniques 4.2. Profitability of Indoor Production of Asian Sea Bass 5. Market-Customer View Point 5.1. Product Innovation / Development Trends 5.2. Product Oriented Market Buzz 6. Market Dynamics 6.1. Drivers 6.2. Restraints 6.3. Trends 6.4. Macro-Economic Factors 6.5. Forecast Factors 7. Value Chain Analysis 7.1. Profit Margin Analysis 7.2. List of Active Participants 7.2.1. Key Manufacturers 7.2.2. Key Processed Asian Sea Bass Brands 8. Policy and Regulatory Landscape 9. Key Success Factors 9.1. Powerful Portfolio of Brands 9.2. Nuanced Marketing Campaigns 9.3. Exploiting Economies of Scale 9.4. Establishing Flexible Supply Chain to Optimize on Miracle Ingredients/ Products 9.5. Working in Close Vicinity of Policy 9.6. Strategic Promotional Activity 10. Consumer Behavior Analysis 10.1. Value Spend of Asian Sea Bass Product 10.2. Path to Purchase: Paved with Digitization 10.3. Influence of Packaging on Purchasing 10.4. Brand Loyalty: Head Vs Heart 10.5. Quest for Quality 10.6. Frugality: Product Habit or Passing Fad 10.7. Factors Influencing Market Behavior by the Costumers of all Age Group 10.8. Most Effective Advertising Format Today 10.9. Social Media Influencing Customer’s Decision Making 10.10. Preferred Social media Platforms for Branding 10.11. Key Challenges Associated with the Market Suppliers 10.12. Concerned Consumers towards Private Label Brands 11. Global Asian Sea Bass Market - Production and Trade Analysis 11.1. Global Asian Sea Bass Production Scenario By Region, 2020E 11.1.1. Capture 11.1.2. Aquaculture 11.2. Global Asian Sea Bass Production by Country (Capture Vs Aquaclture), 2020E 11.3. Asian Sea Bass Market – Exports to the World, 2019 11.4. Asian Sea Bass Market – Imports to the World, 2019 12. Global Asian Sea Bass Market Demand Analysis 2016-2020 and Forecast, 2021-2031 12.1. Historical Market Volume (Metric Tons) Analysis, 2016-2020 12.2. Current and Future Market Volume (Metric Tons) Projections, 2021-2031 12.3. Y-o-Y Growth Trend Analysis 13. Global Asian Sea Bass Market - Pricing Analysis 13.1. Global Price Point Assessment by Region (US$/MT), 2021 13.2. Global Price Point Assessment by Source (US$/MT), 2021 13.3. What are the factors effecting the prices? 13.4. Price Assessment- Factor Influencing Pricing 14. Global Asian Sea Bass Market Demand Analysis 2016-2020 and Forecast, 2021-2031 14.1. Global Market Size and Absolute $ Opportunity 14.2. Global Asian Sea Bass Market Snapshot 15. Global Asian Sea Bass Market Analysis 2016-2020 and Forecast 2021-2031, By Source 15.1. Global Asian Sea Bass Market Share and BPS Analysis by Source– 2021 & 2031 15.2. Global Asian Sea Bass Market Attractiveness Analysis by Source, 2021-2031 15.2.1. Farmed 15.2.1.1. Freshwater 15.2.1.2. Brakishwater 15.2.2. Wild 16. Global Asian Sea Bass Market Analysis 2016-2020 and Forecast 2021-2031, By Form 16.1. Global Asian Sea Bass Market Share and BPS Analysis by Form– 2021 & 2031 16.2. Global Asian Sea Bass Market Attractiveness Analysis by Form, 2021-2031 16.2.1. Whole 16.2.2. Headed and Gutted 16.2.3. Fillet 16.2.4. Frozen 17. Global Asian Sea Bass Market Analysis 2016-2020 and Forecast 2021-2031, By Sales Channel 17.1. Global Asian Sea Bass Market Share and BPS Analysis by Sales Channel – 2021 & 2031 17.2. Global Asian Sea Bass Market Attractiveness Analysis by Sales Channel, 2021-2031 17.2.1. Direct Sales-B2B 17.2.2. Food Service 17.2.3. Retail Sales 17.2.3.1. Modern Trade 17.2.3.2. Convenience Stores 17.2.3.3. Specialty Food Stores 17.2.3.4. Wholesale Stores 17.2.3.5. Discount Stores 17.2.3.6. Online Retail 17.2.3.7. Other Retail Stores 18. Global Asian Sea Bass Market Analysis 2016-2020 and Forecast 2021-2031, By Region 18.1. Global Asian Sea Bass Market Value Share (%) and BPS Analysis by Region, 2016, 2021 & 2031 18.2. Global Asian Sea Bass Market Y-o-Y Growth (%) Projections by Segment, 2021-2031 18.2.1. North America 18.2.2. Latin America 18.2.3. Europe 18.2.4. East Asia 18.2.5. South Asia 18.2.6. Oceania 18.2.7. Middle East and Africa (MEA) 19. North America Asian Sea Bass Market Analysis 2016-2020 and Forecast 2021-2031 19.1. Historical Market Size (US$ Mn) and Volume Trend Analysis By Market Taxonomy, 2016-2020 19.2. Market Size (US$ Mn) and Volume Forecast By Market Taxonomy, 2021-2031 19.2.1. By Country 19.2.1.1. U.S. 19.2.1.2. Canada 19.2.2. By Source 19.2.3. By Form 19.2.4. By Sales Channel 19.3. Market Attractiveness Analysis 19.3.1. By Source 19.3.2. By Form 19.3.3. By Sales Channel 19.4. Market Share (%) Analysis, 2020 19.4.1. U.S. 19.4.1.1. By Source 19.4.1.2. By Form 19.4.1.3. By Sales Channel 19.4.2. Canada 19.4.2.1. By Source 19.4.2.2. By Form 19.4.2.3. By Sales Channel 20. Latin America Asian Sea Bass Market Analysis 2016-2020 and Forecast 2021-2031 20.1. Historical Market Size (US$ Mn) and Volume Trend Analysis By Market Taxonomy, 2016-2020 20.2. Market Size (US$ Mn) and Volume Forecast By Market Taxonomy, 2021-2031 20.2.1. By Country 20.2.1.1. Brazil 20.2.1.2. Mexico 20.2.1.3. Rest of Latin America 20.2.2. By Source 20.2.3. By Form 20.2.4. By Sales Channel 20.3. Market Attractiveness Analysis 20.3.1. By Source 20.3.2. By Form 20.3.3. By Sales Channel 20.4. Market Share (%) Analysis, 2020 20.4.1. Brazil 20.4.1.1. By Source 20.4.1.2. By Form 20.4.1.3. By Sales Channel 20.4.2. Mexico 20.4.2.1. By Source 20.4.2.2. By Form 20.4.2.3. By Sales Channel 20.4.3. Rest of Latin America 20.4.3.1. By Source 20.4.3.2. By Form 20.4.3.3. By Sales Channel 21. Europe Asian Sea Bass Market Analysis 2016-2020 and Forecast 2021-2031 21.1. Historical Market Size (US$ Mn) and Volume Trend Analysis By Market Taxonomy, 2016-2020 21.2. Market Size (US$ Mn) and Volume Forecast By Market Taxonomy, 2021-2031 21.2.1. By Country 21.2.1.1. Germany 21.2.1.2. Italy 21.2.1.3. France 21.2.1.4. U.K. 21.2.1.5. Spain 21.2.1.6. BENELUX 21.2.1.7. Nordic 21.2.1.8. Russia 21.2.1.9. Poland 21.2.1.10. Rest of Europe 21.2.2. By Source 21.2.3. By Form 21.2.4. By Sales Channel 21.3. Market Attractiveness Analysis 21.3.1. By Source 21.3.2. By Form 21.3.3. By Sales Channel 21.4. Market Share (%) Analysis, 2020 21.4.1. Germany 21.4.1.1. By Source 21.4.1.2. By Form 21.4.1.3. By Sales Channel 21.4.2. Italy 21.4.2.1. By Source 21.4.2.2. By Form 21.4.2.3. By Sales Channel 21.4.3. France 21.4.3.1. By Source 21.4.3.2. By Form 21.4.3.3. By Sales Channel 21.4.4. U.K. 21.4.4.1. By Source 21.4.4.2. By Form 21.4.4.3. By Sales Channel 21.4.5. Spain 21.4.5.1. By Source 21.4.5.2. By Form 21.4.5.3. By Sales Channel 21.4.6. BENELUX 21.4.6.1. By Source 21.4.6.2. By Form 21.4.6.3. By Sales Channel 21.4.7. Nordic 21.4.7.1. By Source 21.4.7.2. By Form 21.4.7.3. By Sales Channel 21.4.8. Russia 21.4.8.1. By Source 21.4.8.2. By Form 21.4.8.3. By Sales Channel 21.4.9. Poland 21.4.9.1. By Source 21.4.9.2. By Form 21.4.9.3. By Sales Channel 21.4.10. Rest of Europe 21.4.10.1. By Source 21.4.10.2. By Form 21.4.10.3. By Sales Channel 22. East Asia Asian Sea Bass Market Analysis 2016-2020 and Forecast 2021-2031 22.1. Historical Market Size (US$ Mn) and Volume Trend Analysis By Market Taxonomy, 2016-2020 22.2. Market Size (US$ Mn) and Volume Forecast By Market Taxonomy, 2021-2031 22.2.1. By Country 22.2.1.1. China 22.2.1.2. Japan 22.2.1.3. South Korea 22.2.2. By Source 22.2.3. By Form 22.2.4. By Sales Channel 22.3. Market Attractiveness Analysis 22.3.1. By Source 22.3.2. By Form 22.3.3. By Sales Channel 22.4. Market Share (%) Analysis, 2020 22.4.1. China 22.4.1.1. By Source 22.4.1.2. By Form 22.4.1.3. By Sales Channel 22.4.2. Japan 22.4.2.1. By Source 22.4.2.2. By Form 22.4.2.3. By Sales Channel 22.4.3. South Korea 22.4.3.1. By Source 22.4.3.2. By Form 22.4.3.3. By Sales Channel 23. South Asia Asian Sea Bass Market Analysis 2016-2020 and Forecast 2021-2031 23.1. Historical Market Size (US$ Mn) and Volume Trend Analysis By Market Taxonomy, 2016-2020 23.2. Market Size (US$ Mn) and Volume Forecast By Market Taxonomy, 2021-2031 23.2.1. By Country 23.2.1.1. India 23.2.1.2. Thailand 23.2.1.3. Indonesia 23.2.1.4. Malaysia 23.2.1.5. Singapore 23.2.1.6. Rest of South Asia 23.2.2. By Source 23.2.3. By Form 23.2.4. By Sales Channel 23.3. Market Attractiveness Analysis 23.3.1. By Source 23.3.2. By Form 23.3.3. By Sales Channel 23.4. Market Share (%) Analysis, 2020 23.4.1. India 23.4.1.1. By Source 23.4.1.2. By Form 23.4.1.3. By Sales Channel 23.4.2. Thailand 23.4.2.1. By Source 23.4.2.2. By Form 23.4.2.3. By Sales Channel 23.4.3. Indonesia 23.4.3.1. By Source 23.4.3.2. By Form 23.4.3.3. By Sales Channel 23.4.4. Malaysia 23.4.4.1. By Source 23.4.4.2. By Form 23.4.4.3. By Sales Channel 23.4.5. Singapore 23.4.5.1. By Source 23.4.5.2. By Form 23.4.5.3. By Sales Channel 23.4.6. Rest of South Asia 23.4.6.1. By Source 23.4.6.2. By Form 23.4.6.3. By Sales Channel 24. Oceania Asian Sea Bass Market Analysis 2016-2020 and Forecast 2021-2031 24.1. Historical Market Size (US$ Mn) and Volume Trend Analysis By Market Taxonomy, 2016-2020 24.2. Market Size (US$ Mn) and Volume Forecast By Market Taxonomy, 2021-2031 24.2.1. By Country 24.2.1.1. Australia 24.2.1.2. New Zealand 24.2.2. By Source 24.2.3. By Form 24.2.4. By Sales Channel 24.3. Market Attractiveness Analysis 24.3.1. By Source 24.3.2. By Form 24.3.3. By Sales Channel 24.4. Market Share (%) Analysis, 2020 24.4.1. Australia 24.4.1.1. By Source 24.4.1.2. By Form 24.4.1.3. By Sales Channel 24.4.2. New Zealand 24.4.2.1. By Source 24.4.2.2. By Form 24.4.2.3. By Sales Channel 25. Middle East and Africa Asian Sea Bass Market Analysis 2016-2020 and Forecast 2021-2031 25.1. Historical Market Size (US$ Mn) and Volume Trend Analysis By Market Taxonomy, 2016-2020 25.2. Market Size (US$ Mn) and Volume Forecast By Market Taxonomy, 2021-2031 25.2.1. By Country 25.2.1.1. GCC Countries 25.2.1.2. South Africa 25.2.1.3. Rest of Middle East and Africa 25.2.2. By Source 25.2.3. By Form 25.2.4. By Sales Channel 25.3. Market Attractiveness Analysis 25.3.1. By Source 25.3.2. By Form 25.3.3. By Sales Channel 25.4. Market Share (%) Analysis, 2020 25.4.1. GCC Countries 25.4.1.1. By Source 25.4.1.2. By Form 25.4.1.3. By Sales Channel 25.4.2. South Africa 25.4.2.1. By Source 25.4.2.2. By Form 25.4.2.3. By Sales Channel 25.4.3. Rest of Middle East & Africa 25.4.3.1. By Source 25.4.3.2. By Form 25.4.3.3. By Sales Channel 26. Emerging Countries 26.1. Market Value Proportion Analysis, By Key Countries, 2021 26.2. Asian Sea Bass Pricing analysis US$/MT (2021) 26.3. Growth Comparison of Global Market v/s Emerging Countries, 2021-2031 26.4. India Asian Sea Bass Market Analysis by Source 26.5. India Asian Sea Bass Market Analysis by Form 26.6. India Asian Sea Bass Market Analysis by Sales Channel 26.7. Thailand Asian Sea Bass Market Analysis by Source 26.8. Thailand Asian Sea Bass Market Analysis by Form 26.9. Thailand Asian Sea Bass Market Analysis by Sales Channel 27. Competition Analysis 27.1. Competition Dashboard 27.2. Competition Deep Dive (Tentative List) 27.2.1. Amacore B.V. 27.2.1.1. Overview 27.2.1.2. Product Portfolio 27.2.1.3. Profitability by Market Segments (Product/Channel/Region) 27.2.1.4. Sales Footprint 27.2.1.5. Strategy Overview 27.2.1.5.1. Marketing Strategy 27.2.1.5.2. Product Strategy 27.2.1.5.3. Channel Strategy 27.2.2. Viet Asia Foods (VAFCO) 27.2.2.1. Overview 27.2.2.2. Product Portfolio 27.2.2.3. Profitability by Market Segments (Product/Channel/Region) 27.2.2.4. Sales Footprint 27.2.2.5. Strategy Overview 27.2.2.5.1. Marketing Strategy 27.2.2.5.2. Product Strategy 27.2.2.5.3. Channel Strategy 27.2.3. MainStream Aquaculture 27.2.3.1. Overview 27.2.3.2. Product Portfolio 27.2.3.3. Profitability by Market Segments (Product/Channel/Region) 27.2.3.4. Sales Footprint 27.2.3.5. Strategy Overview 27.2.3.5.1. Marketing Strategy 27.2.3.5.2. Product Strategy 27.2.3.5.3. Channel Strategy 27.2.4. Shwe Yamone Manufacturing Co., Ltd. 27.2.4.1. Overview 27.2.4.2. Product Portfolio 27.2.4.3. Profitability by Market Segments (Product/Channel/Region) 27.2.4.4. Sales Footprint 27.2.4.5. Strategy Overview 27.2.4.5.1. Marketing Strategy 27.2.4.5.2. Product Strategy 27.2.4.5.3. Channel Strategy 27.2.5. A.O.Kingdom 27.2.5.1. Overview 27.2.5.2. Product Portfolio 27.2.5.3. Profitability by Market Segments (Product/Channel/Region) 27.2.5.4. Sales Footprint 27.2.5.5. Strategy Overview 27.2.5.5.1. Marketing Strategy 27.2.5.5.2. Product Strategy 27.2.5.5.3. Channel Strategy 27.2.6. NGHI SON AQUATIC PRODUCT EXIM CO., LTD 27.2.6.1. Overview 27.2.6.2. Product Portfolio 27.2.6.3. Profitability by Market Segments (Product/Channel/Region) 27.2.6.4. Sales Footprint 27.2.6.5. Strategy Overview 27.2.6.5.1. Marketing Strategy 27.2.6.5.2. Product Strategy 27.2.6.5.3. Channel Strategy 27.2.7. Oceanpick 27.2.7.1. Overview 27.2.7.2. Product Portfolio 27.2.7.3. Profitability by Market Segments (Product/Channel/Region) 27.2.7.4. Sales Footprint 27.2.7.5. Strategy Overview 27.2.7.5.1. Marketing Strategy 27.2.7.5.2. Product Strategy 27.2.7.5.3. Channel Strategy 27.2.8. Barramundi Asia 27.2.8.1. Overview 27.2.8.2. Product Portfolio 27.2.8.3. Profitability by Market Segments (Product/Channel/Region) 27.2.8.4. Sales Footprint 27.2.8.5. Strategy Overview 27.2.8.5.1. Marketing Strategy 27.2.8.5.2. Product Strategy 27.2.8.5.3. Channel Strategy 27.2.9. Allegro Aqua 27.2.9.1. Overview 27.2.9.2. Product Portfolio 27.2.9.3. Profitability by Market Segments (Product/Channel/Region) 27.2.9.4. Sales Footprint 27.2.9.5. Strategy Overview 27.2.9.5.1. Marketing Strategy 27.2.9.5.2. Product Strategy 27.2.9.5.3. Channel Strategy 27.2.10. Mattes Seafood 27.2.10.1. Overview 27.2.10.2. Product Portfolio 27.2.10.3. Profitability by Market Segments (Product/Channel/Region) 27.2.10.4. Sales Footprint 27.2.10.5. Strategy Overview 27.2.10.5.1. Marketing Strategy 27.2.10.5.2. Product Strategy 27.2.10.5.3. Channel Strategy 27.2.11. Ocean Treasure 27.2.11.1. Overview 27.2.11.2. Product Portfolio 27.2.11.3. Profitability by Market Segments (Product/Channel/Region) 27.2.11.4. Sales Footprint 27.2.11.5. Strategy Overview 27.2.11.5.1. Marketing Strategy 27.2.11.5.2. Product Strategy 27.2.11.5.3. Channel Strategy 28. Assumptions & Acronyms Used 29. Research Methodology
Let us know your requirement to get
100% FREE customization
List of Tables
Table 1: Global Asian Sea Bass Market Value (US$ Mn) and Forecast by Region, 2016 – 2020 Table 2: Global Asian Sea Bass Market Value (US$ Mn) and Forecast by Region, 2021 – 2031 Table 3: Global Asian Sea Bass Market Volume (Metric Tons) and Forecast by Region, 2016 – 2020 Table 4: Global Asian Sea Bass Market Volume (Metric Tons) and Forecast by Region, 2021 – 2031 Table 5: Global Asian Sea Bass Market Value (US$ Mn) and Forecast by Source, 2016 – 2020 Table 6: Global Asian Sea Bass Market Value (US$ Mn) and Forecast by Source, 2021 – 2031 Table 7: Global Asian Sea Bass Market Volume (Metric Tons) and Forecast by Source, 2016 – 2020 Table 8: Global Asian Sea Bass Market Volume (Metric Tons) and Forecast by Source, 2021 – 2031 Table 9: Global Asian Sea Bass Market Value (US$ Mn) and Forecast by Form, 2016 – 2020 Table 10: Global Asian Sea Bass Market Value (US$ Mn) and Forecast by Form, 2021 – 2031 Table 11: Global Asian Sea Bass Market Volume (Metric Tons) and Forecast by Form, 2016 – 2020 Table 12: Global Asian Sea Bass Market Volume (Metric Tons) and Forecast by Form, 2021 – 2031 Table 13: Global Asian Sea Bass Market Value (US$ Mn) and Forecast by Sales Channel, 2016 – 2020 Table 14: Global Asian Sea Bass Market Value (US$ Mn) and Forecast by Sales Channel, 2021 – 2031 Table 15: Global Asian Sea Bass Market Volume (Metric Tons) and Forecast by Sales Channel, 2016 – 2020 Table 16: Global Asian Sea Bass Market Volume (Metric Tons) and Forecast by Sales Channel, 2021 – 2031 Table 17: North America Asian Sea Bass Market Value (US$ Mn) and Forecast by Country, 2016 – 2020 Table 18: North America Asian Sea Bass Market Value (US$ Mn) and Forecast by Country, 2021 – 2031 Table 19: North America Asian Sea Bass Market Volume (Metric Tons) and Forecast by Country, 2016 – 2020 Table 20: North America Asian Sea Bass Market Volume (Metric Tons) and Forecast by Country, 2021 – 2031 Table 21: North America Asian Sea Bass Market Value (US$ Mn) and Forecast by Source, 2016 – 2020 Table 22: North America Asian Sea Bass Market Value (US$ Mn) and Forecast by Source, 2021 – 2031 Table 23: North America Asian Sea Bass Market Volume (Metric Tons) and Forecast by Source, 2016 – 2020 Table 24: North America Asian Sea Bass Market Volume (Metric Tons) and Forecast by Source, 2021 – 2031 Table 25: North America Asian Sea Bass Market Value (US$ Mn) and Forecast by Form, 2016 – 2020 Table 26: North America Asian Sea Bass Market Value (US$ Mn) and Forecast by Form, 2021 – 2031 Table 27: North America Asian Sea Bass Market Volume (Metric Tons) and Forecast by Form, 2016 – 2020 Table 28: North America Asian Sea Bass Market Volume (Metric Tons) and Forecast by Form, 2021 – 2031 Table 29: North America Asian Sea Bass Market Value (US$ Mn) and Forecast by Sales Channel, 2016 – 2020 Table 30: North America Asian Sea Bass Market Value (US$ Mn) and Forecast by Sales Channel, 2021 – 2031 Table 31: North America Asian Sea Bass Market Volume (Metric Tons) and Forecast by Sales Channel, 2016 – 2020 Table 32: North America Asian Sea Bass Market Volume (Metric Tons) and Forecast by Sales Channel, 2021 – 2031 Table 33: Latin America Asian Sea Bass Market Value (US$ Mn) and Forecast by Country, 2016 – 2020 Table 34: Latin America Asian Sea Bass Market Value (US$ Mn) and Forecast by Country, 2021 – 2031 Table 35: Latin America Asian Sea Bass Market Volume (Metric Tons) and Forecast by Country, 2016 – 2020 Table 36: Latin America Asian Sea Bass Market Volume (Metric Tons) and Forecast by Country, 2021 – 2031 Table 37: Latin America Asian Sea Bass Market Value (US$ Mn) and Forecast by Source, 2016 – 2020 Table 38: Latin America Asian Sea Bass Market Value (US$ Mn) and Forecast by Source, 2021 – 2031 Table 39: Latin America Asian Sea Bass Market Volume (Metric Tons) and Forecast by Source, 2016 – 2020 Table 40: Latin America Asian Sea Bass Market Volume (Metric Tons) and Forecast by Source, 2021 – 2031 Table 41: Latin America Asian Sea Bass Market Value (US$ Mn) and Forecast by Form, 2016 – 2020 Table 42: Latin America Asian Sea Bass Market Value (US$ Mn) and Forecast by Form, 2021 – 2031 Table 43: Latin America Asian Sea Bass Market Volume (Metric Tons) and Forecast by Form, 2016 – 2020 Table 44: Latin America Asian Sea Bass Market Volume (Metric Tons) and Forecast by Form, 2021 – 2031 Table 45: Latin America Asian Sea Bass Market Value (US$ Mn) and Forecast by Sales Channel, 2016 – 2020 Table 46: Latin America Asian Sea Bass Market Value (US$ Mn) and Forecast by Sales Channel, 2021 – 2031 Table 47: Latin America Asian Sea Bass Market Volume (Metric Tons) and Forecast by Sales Channel, 2016 – 2020 Table 48: Latin America Asian Sea Bass Market Volume (Metric Tons) and Forecast by Sales Channel, 2021 – 2031 Table 49: Europe Asian Sea Bass Market Value (US$ Mn) and Forecast by Country, 2016 – 2020 Table 50: Europe Asian Sea Bass Market Value (US$ Mn) and Forecast by Country, 2021 – 2031 Table 51: Europe Asian Sea Bass Market Volume (Metric Tons) and Forecast by Country, 2016 – 2020 Table 52: Europe Asian Sea Bass Market Volume (Metric Tons) and Forecast by Country, 2021 – 2031 Table 53: Europe Asian Sea Bass Market Value (US$ Mn) and Forecast by Source, 2016 – 2020 Table 54: Europe Asian Sea Bass Market Value (US$ Mn) and Forecast by Source, 2021 – 2031 Table 55: Europe Asian Sea Bass Market Volume (Metric Tons) and Forecast by Source, 2016 – 2020 Table 56: Europe Asian Sea Bass Market Volume (Metric Tons) and Forecast by Source, 2021 – 2031 Table 57: Europe Asian Sea Bass Market Value (US$ Mn) and Forecast by Form, 2016 – 2020 Table 58: Europe Asian Sea Bass Market Value (US$ Mn) and Forecast by Form, 2021 – 2031 Table 59: Europe Asian Sea Bass Market Volume (Metric Tons) and Forecast by Form, 2016 – 2020 Table 60: Europe Asian Sea Bass Market Volume (Metric Tons) and Forecast by Form, 2021 – 2031 Table 61: Europe Asian Sea Bass Market Value (US$ Mn) and Forecast by Sales Channel, 2016 – 2020 Table 62: Europe Asian Sea Bass Market Value (US$ Mn) and Forecast by Sales Channel, 2021 – 2031 Table 63: Europe Asian Sea Bass Market Volume (Metric Tons) and Forecast by Sales Channel, 2016 – 2020 Table 64: Europe Asian Sea Bass Market Volume (Metric Tons) and Forecast by Sales Channel, 2021 – 2031 Table 65: South Asia Asian Sea Bass Market Value (US$ Mn) and Forecast by Country, 2016 – 2020 Table 66: South Asia Asian Sea Bass Market Value (US$ Mn) and Forecast by Country, 2021 – 2031 Table 67: South Asia Asian Sea Bass Market Volume (Metric Tons) and Forecast by Country, 2016 – 2020 Table 68: South Asia Asian Sea Bass Market Volume (Metric Tons) and Forecast by Country, 2021 – 2031 Table 69: South Asia Asian Sea Bass Market Value (US$ Mn) and Forecast by Source, 2016 – 2020 Table 70: South Asia Asian Sea Bass Market Value (US$ Mn) and Forecast by Source, 2021 – 2031 Table 71: South Asia Asian Sea Bass Market Volume (Metric Tons) and Forecast by Source, 2016 – 2020 Table 72: South Asia Asian Sea Bass Market Volume (Metric Tons) and Forecast by Source, 2021 – 2031 Table 73: South Asia Asian Sea Bass Market Value (US$ Mn) and Forecast by Form, 2016 – 2020 Table 74: South Asia Asian Sea Bass Market Value (US$ Mn) and Forecast by Form, 2021 – 2031 Table 75: South Asia Asian Sea Bass Market Volume (Metric Tons) and Forecast by Form, 2016 – 2020 Table 76: South Asia Asian Sea Bass Market Volume (Metric Tons) and Forecast by Form, 2021 – 2031 Table 77: South Asia Asian Sea Bass Market Value (US$ Mn) and Forecast by Sales Channel, 2016 – 2020 Table 78: South Asia Asian Sea Bass Market Value (US$ Mn) and Forecast by Sales Channel, 2021 – 2031 Table 79: South Asia Asian Sea Bass Market Volume (Metric Tons) and Forecast by Sales Channel, 2016 – 2020 Table 80: South Asia Asian Sea Bass Market Volume (Metric Tons) and Forecast by Sales Channel, 2021 – 2031 Table 81: East Asia Asian Sea Bass Market Value (US$ Mn) and Forecast by Country, 2016 – 2020 Table 82: East Asia Asian Sea Bass Market Value (US$ Mn) and Forecast by Country, 2021 – 2031 Table 83: East Asia Asian Sea Bass Market Volume (Metric Tons) and Forecast by Country, 2016 – 2020 Table 84: East Asia Asian Sea Bass Market Volume (Metric Tons) and Forecast by Country, 2021 – 2031 Table 85: East Asia Asian Sea Bass Market Value (US$ Mn) and Forecast by Source, 2016 – 2020 Table 86: East Asia Asian Sea Bass Market Value (US$ Mn) and Forecast by Source, 2021 – 2031 Table 87: East Asia Asian Sea Bass Market Volume (Metric Tons) and Forecast by Source, 2016 – 2020 Table 88: East Asia Asian Sea Bass Market Volume (Metric Tons) and Forecast by Source, 2021 – 2031 Table 89: East Asia Asian Sea Bass Market Value (US$ Mn) and Forecast by Form, 2016 – 2020 Table 90: East Asia Asian Sea Bass Market Value (US$ Mn) and Forecast by Form, 2021 – 2031 Table 91: East Asia Asian Sea Bass Market Volume (Metric Tons) and Forecast by Form, 2016 – 2020 Table 92: East Asia Asian Sea Bass Market Volume (Metric Tons) and Forecast by Form, 2021 – 2031 Table 93: East Asia Asian Sea Bass Market Value (US$ Mn) and Forecast by Sales Channel, 2016 – 2020 Table 94: East Asia Asian Sea Bass Market Value (US$ Mn) and Forecast by Sales Channel, 2021 – 2031 Table 95: East Asia Asian Sea Bass Market Volume (Metric Tons) and Forecast by Sales Channel, 2016 – 2020 Table 96: East Asia Asian Sea Bass Market Volume (Metric Tons) and Forecast by Sales Channel, 2021 – 2031 Table 97: Oceania Asian Sea Bass Market Value (US$ Mn) and Forecast by Country, 2016 – 2020 Table 98: Oceania Asian Sea Bass Market Value (US$ Mn) and Forecast by Country, 2021 – 2031 Table 99: Oceania Asian Sea Bass Market Volume (Metric Tons) and Forecast by Country, 2016 – 2020 Table 100: Oceania Asian Sea Bass Market Volume (Metric Tons) and Forecast by Country, 2021 – 2031 Table 101: Oceania Asian Sea Bass Market Value (US$ Mn) and Forecast by Source, 2016 – 2020 Table 102: Oceania Asian Sea Bass Market Value (US$ Mn) and Forecast by Source, 2021 – 2031 Table 103: Oceania Asian Sea Bass Market Volume (Metric Tons) and Forecast by Source, 2016 – 2020 Table 104: Oceania Asian Sea Bass Market Volume (Metric Tons) and Forecast by Source, 2021 – 2031 Table 105: Oceania Asian Sea Bass Market Value (US$ Mn) and Forecast by Form, 2016 – 2020 Table 106: Oceania Asian Sea Bass Market Value (US$ Mn) and Forecast by Form, 2021 – 2031 Table 107: Oceania Asian Sea Bass Market Volume (Metric Tons) and Forecast by Form, 2016 – 2020 Table 108: Oceania Asian Sea Bass Market Volume (Metric Tons) and Forecast by Form, 2021 – 2031 Table 109: Oceania Asian Sea Bass Market Value (US$ Mn) and Forecast by Sales Channel, 2016 – 2020 Table 110: Oceania Asian Sea Bass Market Value (US$ Mn) and Forecast by Sales Channel, 2021 – 2031 Table 111: Oceania Asian Sea Bass Market Volume (Metric Tons) and Forecast by Sales Channel, 2016 – 2020 Table 112: Oceania Asian Sea Bass Market Volume (Metric Tons) and Forecast by Sales Channel, 2021 – 2031 Table 113: MEA Asian Sea Bass Market Value (US$ Mn) and Forecast by Country, 2016 – 2020 Table 114: MEA Asian Sea Bass Market Value (US$ Mn) and Forecast by Country, 2021 – 2031 Table 115: MEA Asian Sea Bass Market Volume (Metric Tons) and Forecast by Country, 2016 – 2020 Table 116: MEA Asian Sea Bass Market Volume (Metric Tons) and Forecast by Country, 2021 – 2031 Table 117: MEA Asian Sea Bass Market Value (US$ Mn) and Forecast by Source, 2016 – 2020 Table 118: MEA Asian Sea Bass Market Value (US$ Mn) and Forecast by Source, 2021 – 2031 Table 119: MEA Asian Sea Bass Market Volume (Metric Tons) and Forecast by Source, 2016 – 2020 Table 120: MEA Asian Sea Bass Market Volume (Metric Tons) and Forecast by Source, 2021 – 2031 Table 121: MEA Asian Sea Bass Market Value (US$ Mn) and Forecast by Form, 2016 – 2020 Table 122: MEA Asian Sea Bass Market Value (US$ Mn) and Forecast by Form, 2021 – 2031 Table 123: MEA Asian Sea Bass Market Volume (Metric Tons) and Forecast by Form, 2016 – 2020 Table 124: MEA Asian Sea Bass Market Volume (Metric Tons) and Forecast by Form, 2021 – 2031 Table 125: MEA Asian Sea Bass Market Value (US$ Mn) and Forecast by Sales Channel, 2016 – 2020 Table 126: MEA Asian Sea Bass Market Value (US$ Mn) and Forecast by Sales Channel, 2021 – 2031 Table 127: MEA Asian Sea Bass Market Volume (Metric Tons) and Forecast by Sales Channel, 2016 – 2020 Table 128: MEA Asian Sea Bass Market Volume (Metric Tons) and Forecast by Sales Channel, 2021 – 2031
Find your sweet spots for generating winning opportunities in this market.
Talk to AnalystList of Charts
Figure 01: Global Asian Sea Bass Market Size, Market Volume (MT), 2016-2031 Figure 02: Global Asian Sea Bass Market Size, Incremental $ Opportunity (US$ Mn) , 2016-2031 Figure 03: Global Asian Sea Bass Market Share and BPS Analysis by Source – 2021 & 2031 Figure 04: Global Asian Sea Bass Market Attractiveness Analysis by Source, 2021-2031 Figure 05: Global Asian Sea Bass Market Farmed Source Market Value (US$ Mn), Volume (MT) and Forecast, 2016-2031 Figure 06: Global Asian Sea Bass Market Farmed Source Incremental $ Opportunity, 2020-2031 Figure 07: Global Asian Sea Bass Market Wild Source Market Value (US$ Mn), Volume (MT) and Forecast, 2016-2031 Figure 08: Global Asian Sea Bass Market Wild Source Incremental $ Opportunity, 2020-2031 Figure 09: Global Asian Sea Bass Market Share and BPS Analysis by Form – 2021 & 2031 Figure 10: Global Asian Sea Bass Market Attractiveness Analysis by Form, 2021-2031 Figure 11: Global Asian Sea Bass Market Whole Form Market Value (US$ Mn), Volume (MT) and Forecast, 2016-2031 Figure 12: Global Asian Sea Bass Market Whole Form Incremental $ Opportunity, 2020-2031 Figure 13: Global Asian Sea Bass Market Headed & Gutted Form Market Value (US$ Mn), Volume (MT) and Forecast, 2016-2031 Figure 14: Global Asian Sea Bass Market Headed & Gutted Form Incremental $ Opportunity, 2020-2031 Figure 15: Global Asian Sea Bass Market Fillet Form Market Value (US$ Mn), Volume (MT) and Forecast, 2016-2031 Figure 16: Global Asian Sea Bass Market Fillet Form Incremental $ Opportunity, 2020-2031 Figure 17: Global Asian Sea Bass Market Frozen Form Market Value (US$ Mn), Volume (MT) and Forecast, 2016-2031 Figure 18: Global Asian Sea Bass Market Frozen Form Incremental $ Opportunity, 2020-2031 Figure 19: Global Asian Sea Bass Market Share and BPS Analysis by Sales Channel– 2021 & 2031 Figure 20: Global Asian Sea Bass Market Attractiveness Analysis by Sales Channel, 2021-2031 Figure 21: Global Asian Sea Bass Market Direct Sales-B2B Market Value (US$ Mn), Volume (MT) and Forecast, 2016-2031 Figure 22: Global Asian Sea Bass Market Direct Sales-B2B Incremental $ Opportunity, 2020-2031 Figure 23: Global Asian Sea Bass Market Food Service Market Value (US$ Mn), Volume (MT) and Forecast, 2016-2031 Figure 24: Global Asian Sea Bass Market Food Service Incremental $ Opportunity, 2020-2031 Figure 25: Global Asian Sea Bass Market Retail Sales Market Value (US$ Mn), Volume (MT) and Forecast, 2016-2031 Figure 26: Global Asian Sea Bass Market Retail Sales Incremental $ Opportunity, 2020-2031 Figure 27: Global Asian Sea Bass Market Value Share (%) and BPS Analysis by Region, 2016, 2021 & 2031 Figure 28: Global Asian Sea Bass Market Y-o-Y Growth (%) Projections by Segment, 2021-2031 Figure 29: North America Asian Sea Bass Absolute $ Opportunity Analysis, 2021-2031 Figure 30: Latin America Asian Sea Bass Absolute $ Opportunity Analysis, 2021-2031 Figure 31: Europe Asian Sea Bass Absolute $ Opportunity Analysis, 2021-2031 Figure 32: South Asia Asian Sea Bass Absolute $ Opportunity Analysis, 2021-2031 Figure 33: East Asia Asian Sea Bass Absolute $ Opportunity Analysis, 2021-2031 Figure 34: Oceania Asian Sea Bass Absolute $ Opportunity Analysis, 2021-2031 Figure 35: Middle East & Africa Asian Sea Bass Absolute $ Opportunity Analysis, 2021-2031 Figure 36: Global Asian Sea Bass Market Attractiveness Analysis, 2021-2031 Figure 37: North America Asian Sea Bass Market Value (US$ Mn), Volume (MT) Forecast and Analysis, 2021-2031 Figure 38: U.S. Asian Sea Bass Market Incremental $ Opportunity, 2021-2031 Figure 39: Canada Asian Sea Bass Market Incremental $ Opportunity, 2021-2031 Figure 40: North America Asian Sea Bass Market Share and BPS Analysis by Source – 2021 & 2031 Figure 41: North America Asian Sea Bass Market Attractiveness Analysis by Source, 2021-2031 Figure 42: North America Asian Sea Bass Market Share and BPS Analysis by Form – 2021 & 2031 Figure 43: North America Asian Sea Bass Market Attractiveness Analysis by Form, 2021-2031 Figure 44: North America Asian Sea Bass Market Share and BPS Analysis by Sales Channel – 2021 & 2031 Figure 45: North America Asian Sea Bass Market Attractiveness Analysis by Sales Channel, 2021-2031 Figure 46: U.S. Market Value Share Analysis by Source, 2021 Figure 47: U.S. Market Value Share Analysis by Form, 2021 Figure 48: U.S. Market Value Share Analysis by Sales Channel, 2021 Figure 49: Canada Market Value Share Analysis by Source, 2021 Figure 50: Canada Market Value Share Analysis by Form, 2021 Figure 51: Canada Market Value Share Analysis by Sales Channel, 2021 Figure 52: Latin America Asian Sea Bass Market Value (US$ Mn), Volume (MT) Forecast and Analysis, 2021-2031 Figure 53: Brazil Asian Sea Bass Market Incremental $ Opportunity, 2021-2031 Figure 54: Mexico Asian Sea Bass Market Incremental $ Opportunity, 2021-2031 Figure 55: Rest of Latin America Asian Sea Bass Market Incremental $ Opportunity, 2021-2031 Figure 56: Latin America Asian Sea Bass Market Share and BPS Analysis by Source – 2021 & 2031 Figure 57: Latin America Asian Sea Bass Market Attractiveness Analysis by Source, 2021-2031 Figure 58: Latin America Asian Sea Bass Market Share and BPS Analysis by Form – 2021 & 2031 Figure 59: Latin America Asian Sea Bass Market Attractiveness Analysis by Form, 2021-2031 Figure 60: Latin America Asian Sea Bass Market Share and BPS Analysis by Sales Channel – 2021 & 2031 Figure 61: Latin America Asian Sea Bass Market Attractiveness Analysis by Sales Channel, 2021-2031 Figure 62: Brazil Market Value Share Analysis by Source, 2021 Figure 63: Brazil Market Value Share Analysis by Form, 2021 Figure 64: Brazil Market Value Share Analysis by Sales Channel, 2021 Figure 65: Mexico Market Value Share Analysis by Source, 2021 Figure 66: Mexico Market Value Share Analysis by Form, 2021 Figure 67: Mexico Market Value Share Analysis by Sales Channel, 2021 Figure 68: Rest of Latin America Market Value Share Analysis by Source, 2021 Figure 69: Rest of Latin America Market Value Share Analysis by Form, 2021 Figure 70: Rest of Latin America Market Value Share Analysis by Sales Channel, 2021 Figure 71: Europe Asian Sea Bass Market Value (US$ Mn), Volume (MT) Forecast and Analysis, 2021-2031 Figure 72: Germany Asian Sea Bass Market Incremental $ Opportunity, 2021-2031 Figure 73: Italy Asian Sea Bass Market Incremental $ Opportunity, 2021-2031 Figure 74: France Asian Sea Bass Market Incremental $ Opportunity, 2021-2031 Figure 75: U.K. Asian Sea Bass Market Incremental $ Opportunity, 2021-2031 Figure 76: Spain Asian Sea Bass Market Incremental $ Opportunity, 2021-2031 Figure 77: BENELUX Asian Sea Bass Market Incremental $ Opportunity, 2021-2031 Figure 78: Nordic Asian Sea Bass Market Incremental $ Opportunity, 2021-2031 Figure 79: Russia Asian Sea Bass Market Incremental $ Opportunity, 2021-2031 Figure 80: Poland Asian Sea Bass Market Incremental $ Opportunity, 2021-2031 Figure 81: Rest of Europe Asian Sea Bass Market Incremental $ Opportunity, 2021-2031 Figure 82: Europe Asian Sea Bass Market Share and BPS Analysis by Source – 2021 & 2031 Figure 83: Europe Asian Sea Bass Market Attractiveness Analysis by Source, 2021-2031 Figure 84: Europe Asian Sea Bass Market Share and BPS Analysis by Form – 2021 & 2031 Figure 85: Europe Asian Sea Bass Market Attractiveness Analysis by Form, 2021-2031 Figure 86: Europe Asian Sea Bass Market Share and BPS Analysis by Sales Channel – 2021 & 2031 Figure 87: Europe Asian Sea Bass Market Attractiveness Analysis by Sales Channel, 2021-2031 Figure 88: Germany Market Value Share Analysis by Source, 2021 Figure 89: Germany Market Value Share Analysis by Form, 2021 Figure 90: Germany Market Value Share Analysis by Sales Channel, 2021 Figure 91: Italy Market Value Share Analysis by Source, 2021 Figure 92: Italy Market Value Share Analysis by Form, 2021 Figure 93: Italy Market Value Share Analysis by Sales Channel, 2021 Figure 94: France Market Value Share Analysis by Source, 2021 Figure 95: France Market Value Share Analysis by Form, 2021 Figure 96: France Market Value Share Analysis by Sales Channel, 2021 Figure 97: Spain Market Value Share Analysis by Source, 2021 Figure 98: Spain Market Value Share Analysis by Form, 2021 Figure 99: Spain Market Value Share Analysis by Sales Channel, 2021 Figure 100: U.K. Market Value Share Analysis by Source, 2021 Figure 101: U.K. Market Value Share Analysis by Form, 2021 Figure 102: U.K. Market Value Share Analysis by Sales Channel, 2021 Figure 103: BENELUX Market Value Share Analysis by Source, 2021 Figure 104: BENELUX Market Value Share Analysis by Form, 2021 Figure 105: BENELUX Market Value Share Analysis by Sales Channel, 2021 Figure 106: Nordic Market Value Share Analysis by Source, 2021 Figure 107: Nordic Market Value Share Analysis by Form, 2021 Figure 108: Nordic Market Value Share Analysis by Sales Channel, 2021 Figure 109: Russia Market Value Share Analysis by Source, 2021 Figure 110: Russia Market Value Share Analysis by Form, 2021 Figure 111: Russia Market Value Share Analysis by Sales Channel, 2021 Figure 112: Poland Market Value Share Analysis by Source, 2021 Figure 113: Poland Market Value Share Analysis by Form, 2021 Figure 114: Poland Market Value Share Analysis by Sales Channel, 2021 Figure 115: Rest of Europe Market Value Share Analysis by Source, 2021 Figure 116: Rest of Europe Market Value Share Analysis by Form, 2021 Figure 117: Rest of Europe Market Value Share Analysis by Sales Channel, 2021 Figure 118: South Asia Asian Sea Bass Market Value (US$ Mn), Volume (MT) Forecast and Analysis, 2021-2031 Figure 119: India Asian Sea Bass Market Incremental $ Opportunity, 2021-2031 Figure 120: Thailand Asian Sea Bass Market Incremental $ Opportunity, 2021-2031 Figure 121: Indonesia Asian Sea Bass Market Incremental $ Opportunity, 2021-2031 Figure 122: Malaysia Asian Sea Bass Market Incremental $ Opportunity, 2021-2031 Figure 123: Singapore Asian Sea Bass Market Incremental $ Opportunity, 2021-2031 Figure 124: Rest of South Asia Asian Sea Bass Market Incremental $ Opportunity, 2021-2031 Figure 125: South Asia Asian Sea Bass Market Share and BPS Analysis by Source – 2021 & 2031 Figure 126: South Asia Asian Sea Bass Market Attractiveness Analysis by Source, 2021-2031 Figure 127: South Asia Asian Sea Bass Market Share and BPS Analysis by Form – 2021 & 2031 Figure 128: South Asia Asian Sea Bass Market Attractiveness Analysis by Form, 2021-2031 Figure 129: South Asia Asian Sea Bass Market Share and BPS Analysis by Sales Channel – 2021 & 2031 Figure 130: South Asia Asian Sea Bass Market Attractiveness Analysis by Sales Channel, 2021-2031 Figure 131: India Market Value Share Analysis by Source, 2021 Figure 132: India Market Value Share Analysis by Form, 2021 Figure 133: India Market Value Share Analysis by Sales Channel, 2021 Figure 134: Thailand Market Value Share Analysis by Source, 2021 Figure 135: Thailand Market Value Share Analysis by Form, 2021 Figure 136: Thailand Market Value Share Analysis by Sales Channel, 2021 Figure 137: Indonesia Market Value Share Analysis by Source, 2021 Figure 138: Indonesia Market Value Share Analysis by Form, 2021 Figure 139: Indonesia Market Value Share Analysis by Sales Channel, 2021 Figure 140: Malaysia Market Value Share Analysis by Source, 2021 Figure 141: Malaysia Market Value Share Analysis by Form, 2021 Figure 142: Malaysia Market Value Share Analysis by Sales Channel, 2021 Figure 143: Singapore Market Value Share Analysis by Source, 2021 Figure 144: Singapore Market Value Share Analysis by Form, 2021 Figure 145: Singapore Market Value Share Analysis by Sales Channel, 2021 Figure 146: Rest of South Asia Market Value Share Analysis by Source, 2021 Figure 147: Rest of South Asia Market Value Share Analysis by Form, 2021 Figure 148: Rest of South Asia Market Value Share Analysis by Sales Channel, 2021 Figure 149: East Asia Asian Sea Bass Market Value (US$ Mn), Volume (MT) Forecast and Analysis, 2021-2031 Figure 150: China Asian Sea Bass Market Incremental $ Opportunity, 2021-2031 Figure 151: Japan Asian Sea Bass Market Incremental $ Opportunity, 2021-2031 Figure 152: South Korea Asian Sea Bass Market Incremental $ Opportunity, 2021-2031 Figure 153: East Asia Asian Sea Bass Market Share and BPS Analysis by Source – 2021 & 2031 Figure 154: East Asia Asian Sea Bass Market Attractiveness Analysis by Source, 2021-2031 Figure 155: East Asia Asian Sea Bass Market Share and BPS Analysis by Form – 2021 & 2031 Figure 156: East Asia Asian Sea Bass Market Attractiveness Analysis by Form, 2021-2031 Figure 157: East Asia Asian Sea Bass Market Share and BPS Analysis by Sales Channel – 2021 & 2031 Figure 158: East Asia Asian Sea Bass Market Attractiveness Analysis by Sales Channel, 2021-2031 Figure 159: China Market Value Share Analysis by Source, 2021 Figure 160: China Market Value Share Analysis by Form, 2021 Figure 161: China Market Value Share Analysis by Sales Channel, 2021 Figure 162: Japan Market Value Share Analysis by Source, 2021 Figure 163: Japan Market Value Share Analysis by Form, 2021 Figure 164: Japan Market Value Share Analysis by Sales Channel, 2021 Figure 165: South Korea Market Value Share Analysis by Source, 2021 Figure 166: South Korea Market Value Share Analysis by Form, 2021 Figure 167: South Korea Market Value Share Analysis by Sales Channel, 2021 Figure 168: Oceania Asian Sea Bass Market Value (US$ Mn), Volume (MT) Forecast and Analysis, 2021-2031 Figure 169: Australia Asian Sea Bass Market Incremental $ Opportunity, 2021-2031 Figure 170: New Zealand Asian Sea Bass Market Incremental $ Opportunity, 2021-2031 Figure 171: Oceania Asian Sea Bass Market Share and BPS Analysis by Source – 2021 & 2031 Figure 172: Oceania Asian Sea Bass Market Attractiveness Analysis by Source, 2021-2031 Figure 173: Oceania Asian Sea Bass Market Share and BPS Analysis by Form – 2021 & 2031 Figure 174: Oceania Asian Sea Bass Market Attractiveness Analysis by Form, 2021-2031 Figure 175: Oceania Asian Sea Bass Market Share and BPS Analysis by Sales Channel – 2021 & 2031 Figure 176: Oceania Asian Sea Bass Market Attractiveness Analysis by Sales Channel, 2021-2031 Figure 177: Australia Market Value Share Analysis by Source, 2021 Figure 178: Australia Market Value Share Analysis by Form, 2021 Figure 179: Australia Market Value Share Analysis by Sales Channel, 2021 Figure 180: New Zealand Market Value Share Analysis by Source, 2021 Figure 181: New Zealand Market Value Share Analysis by Form, 2021 Figure 182: New Zealand Market Value Share Analysis by Sales Channel, 2021 Figure 183: Middle East & Africa Asian Sea Bass Market Value (US$ Mn), Volume (MT) Forecast and Analysis, 2021-2031 Figure 184: GCC Countries Asian Sea Bass Market Incremental $ Opportunity, 2021-2031 Figure 185: South Africa Asian Sea Bass Market Incremental $ Opportunity, 2021-2031 Figure 186: Rest of Middle East & Africa Asian Sea Bass Market Incremental $ Opportunity, 2021-2031 Figure 187: Middle East & Africa Asian Sea Bass Market Share and BPS Analysis by Source – 2021 & 2031 Figure 188: Middle East & Africa Asian Sea Bass Market Attractiveness Analysis by Source, 2021-2031 Figure 189: Middle East & Africa Asian Sea Bass Market Share and BPS Analysis by Form – 2021 & 2031 Figure 190: Middle East & Africa Asian Sea Bass Market Attractiveness Analysis by Form, 2021-2031 Figure 191: Middle East & Africa Asian Sea Bass Market Share and BPS Analysis by Sales Channel – 2021 & 2031 Figure 192: Middle East & Africa Asian Sea Bass Market Attractiveness Analysis by Sales Channel, 2021-2031 Figure 193: GCC Countries Market Value Share Analysis by Source, 2021 Figure 194: GCC Countries Market Value Share Analysis by Form, 2021 Figure 195: GCC Countries Market Value Share Analysis by Sales Channel, 2021 Figure 196: South Africa Market Value Share Analysis by Source, 2021 Figure 197: South Africa Market Value Share Analysis by Form, 2021 Figure 198: South Africa Market Value Share Analysis by Sales Channel, 2021 Figure 199: Rest of Middle East & Africa Market Value Share Analysis by Source, 2021 Figure 200: Rest of Middle East & Africa Market Value Share Analysis by Form, 2021 Figure 201: Rest of Middle East & Africa Market Value Share Analysis by Sales Channel, 2021 Figure 202: India Asian Sea Bass Market Y-o-Y Growth Analysis, 2021 to 2031 Figure 203: India Asian Sea Bass Market Value and Volume Analysis, 2016 -2031 Figure 204: India Asian Sea Bass Market Incremental Value (US$ Mn), 2021 to 2031 Figure 205: India Asian Sea Bass Market Incremental Volume (Metric Tons), 2021 to 2031 Figure 206: India Asian Sea Bass Market Share and BPS Analysis by Source – 2021 & 2031 Figure 207: India Asian Sea Bass Market Attractiveness Analysis by Source, 2021-2031 Figure 208: India Asian Sea Bass Market Share and BPS Analysis by Form – 2021 & 2031 Figure 209: India Asian Sea Bass Market Attractiveness Analysis by Form, 2021-2031 Figure 210: India Asian Sea Bass Market Share and BPS Analysis by Sales Channel – 2021 & 2031 Figure 211: India Asian Sea Bass Market Attractiveness Analysis by Sales Channel, 2021-2031 Figure 212: Thailand Asian Sea Bass Market Y-o-Y Growth Analysis, 2021 to 2031 Figure 213: Thailand Asian Sea Bass Market Value and Volume Analysis, 2016 -2031 Figure 214: Thailand Asian Sea Bass Market Incremental Value (US$ Mn), 2021 to 2031 Figure 215: Thailand Asian Sea Bass Market Incremental Volume (Metric Tons), 2021 to 2031 Figure 216: Thailand Asian Sea Bass Market Share and BPS Analysis by Source – 2021 & 2031 Figure 217: Thailand Asian Sea Bass Market Attractiveness Analysis by Source, 2021-2031 Figure 218: Thailand Asian Sea Bass Market Share and BPS Analysis by Form – 2021 & 2031 Figure 219: Thailand Asian Sea Bass Market Attractiveness Analysis by Form, 2021-2031 Figure 220: Thailand Asian Sea Bass Market Share and BPS Analysis by Sales Channel – 2021 & 2031 Figure 221: Thailand Asian Sea Bass Market Attractiveness Analysis by Sales Channel, 2021-2031
Need specific information?
Request CustomizationExplore Food and Beverage Insights
View Reports