Plant Asset Management Market
Adoption of Digitalization in Industrial Processes to Generate a Dollar Opportunity
Plant Asset Management Market By Component, Deployment, Asset Type, End-User & Region - Forecast 2022-2032
Plant Asset Management Market Snapshot (2022-2032)
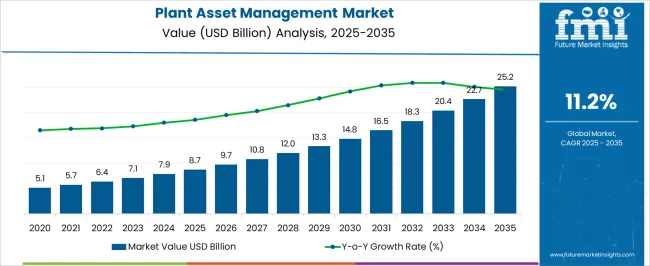
[296 Pages Report] The worldwide plant asset management market is forecasted to attain a valuation ofUS$ 6 billionby the end of 2022.The market is forecasted to reach a value pool ofUS$ 18 billionover the projection timeframe (2022-2032), registering a CAGR of11.6%by 2032.
Attributes |
Details |
Plant Asset Management Market CAGR (2022-2032) |
11.6% |
Plant Asset Management Market (2032) |
US$ 18 Billion |
Plant Asset Management Market Attraction |
Surging demand for asset management software and a souring desideratum for real-time data analytics will drive market growth during the forecast period. |
The increasing desire of several stakeholders to enhance numerous processes across industries and utility facilities to achieve more productivity along with less waste is driving the industry's growth.
With increased digitalization and the implementation of Industry 4.0, more and morestakeholders are embracing lean manufacturing techniques. Plants that use lean procedures have witnessed a 10% to 12% increase in production. The perks of these techniques encourage the adoption of digitalization in industrial processes, resulting in increased market demand.
Let us know your requirement to get
100% FREE customization
Plant Asset Management Demand Analysis (2017 to 2021) Vs Market Outlook (2022 to 2032)
During the historical period from 2017-2021, plant asset management market grew at a CAGR of 10%. The market is being driven by the implementation of lean manufacturing processes. Companies that apply lean manufacturing concepts should consider an asset management system to increase dependability while lowering maintenance and operational costs across various asset classes.
Furthermore, process facilities in the oil and gas sector are very complicated, with expensive and production crucial equipment. As the plant's health and performance deteriorate over time owing to wear from a variety of sources, production and related expenses suffer.
Asset management solutions seek to mitigate this impact by systematic equipment condition monitoring, the avoidance of unscheduled production downtime, and the reduction of operating expenditures through better maintenance planning. All these factors are anticipated to grow at a CAGR of 11.6% over the assessment period from 2022 to 2032.
What are the Factors Driving Global Plant Asset Management Market?
Increasing Adoption of Cloud-based Technologies to Boost the Market
The plant asset management strategy calls for the use of several measuring methods to safeguard and forecast the health of plant assets. It gives useful information regarding the condition of assets throughout their life cycle. This data is utilized to optimize plant operations and maintenance, boost production capacity, and adopt predictive maintenance and operational plans.
Furthermore, increasing adoption of lean manufacturing practices by several organizations, increased emphasis on providing cloud-based PAM solutions to meet customer demands, rising demand for asset management software that can identify potential failures to avoid future losses, and growing need for real-time data analytics are the major factors driving the market growth.
Automotive Industry to Create an Abundance of Investment Opportunities
To secure its growth, the automobile sector is increasingly reliant on digital technology. Massive capital investments by market participants in undeveloped areas in emerging nations are also driving the rise of the automobile sector.
Technological advancements such as electric and gas-powered vehicles cause infrastructure changes in the automotive industry; additionally, new machines and equipment have replaced the need for human operators for most of the critical processes in the automotive industry for precise accuracy, which accelerates the demand for PAM solutions for automation assets used in automobile manufacturing plants.
Find your sweet spots for generating winning opportunities in this market.
Talk to AnalystWhat are the Challenges of the Global Plant Asset Management Market?
Dearth of Trained Professionals may impede the Market’s Growth
The market's expansion is being hampered by a shortage of trained workers. The World Economic Forum (WEF) stated in its study titled 'The Future of Jobs 2018' that around 54% of the global workforce will need to be re-skilled or up-skilled to work in disruptive and digital technologies producing the virtual world. Because of a lack of technical understanding, operators are less accepting.
Region-Wise Insights
Why is the U.S. Considered the Most Lucrative Plant Asset Management Market?
Availability of Sophisticated IT infrastructure and supporting government actions to promotes the market growth.
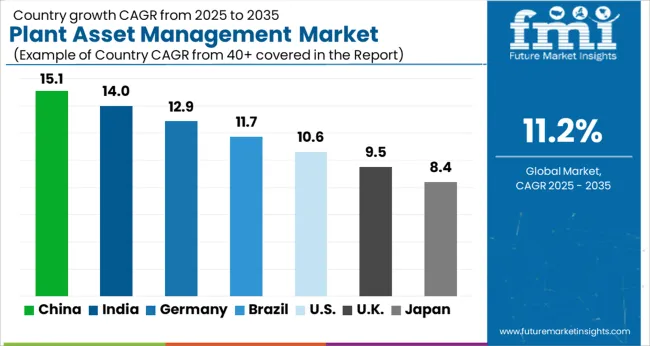
As per the analysis, the United States is likely to be the most profitable market for Plant Asset Management during the forecast period. The United States plant asset management industry is estimated to skyrocket at a CAGR of 10.6%, driven by the region’s advanced factory solutions.
The fast adoption of IoT/IIoT across various industries, including manufacturing, automotive, and healthcare, can be attributed to increased internet penetration, the availability of low-cost IoT sensors, and the proliferation of smart-linked devices. The availability of sophisticated IT infrastructure and supporting government actions to promote the region's transition to Industry 4.0 will fuel the market's growth.
What Drives the Expansion of Plant Asset Management Market in China?
Low Labor Costs and Availability of Trained Workers
China is predicted to be the fastest-growing market during the forecast period. As per the estimations, the aerospace and military sector in China is expected to grow by roughly 15% between 2022 and 2032, owing to investments in sophisticated technology in the aerospace and defense sector.
Manufacturing cost control is becoming a top focus for aerospace companies, prompting them to invest in asset management technology for their operations. With the use of sophisticated technologies like predictive maintenance and AI, the aircraft industry is deploying PAM solutions to minimize operating expenses.
Analysis reveals that owing to the increasing industrial industry, PAM solutions are widely used throughout china. Because of the low labor costs and availability of trained workers, most of the major firms from various sectors have relocated their manufacturing units to China. These industrial facilities are utilizing asset management solutions to enhance overall manufacturing processes, which is projected to boost the growth of the PAM market in the area.

An unified Market Research Subscription Platform, built for today’s disparate research needs.
Category-Wise Insights
How will Surging Demand for Oil & Gas Push Plant Asset Management Sales?
Oil & Gas Industry will help the Market to Gain Traction
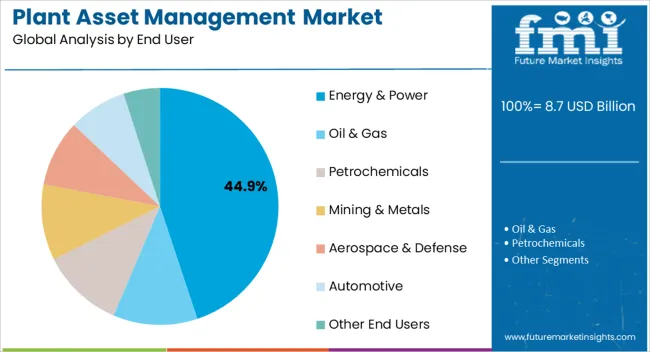
By end-user, the global Plant Asset Management market can be segmented into energy & power, oil & gas, petrochemical, mining & metal, aerospace & defense, automotive and others.
Process facilities in the oil and gas sector are very complicated, with expensive and production crucial equipment. As the plant's health and performance deteriorate over time owing to wear from a variety of sources, production and related expenses suffer.
Asset management solutions seek to mitigate this impact by systematic equipment condition monitoring, the avoidance of unscheduled production downtime, and the reduction of operating expenditures through better maintenance planning.
Which is the Most Lucrative Asset Type in the Plant Asset Management Market?
Automation Assets Will Exhibit Rapid Growth in the PAM Market during the Forecast Period
By asset type, the global plant asset management market can be segmented into production assets and automation assets. During the forecast period, the plant asset management market for automation assets is predicted to grow at the fastest rate. Increased use of automation technology to boost production capacity in the process industries.
However, other types of automation systems, such as programmable logic controllers (PLCs) and distributed control systems (DCSs), find applications in discrete sectors, fuelling need for PAM solutions for effective automation asset management.
The Start-Up Ecosystem: How opportunistic will the Plant Asset Management Market Become?
FMI highlights top Asset Management startups in the market. These startups are pioneering in a number of ways inside the Plant Asset Management business and throughout the world. They are all outstanding startups worth following. Few of these startups are mentioned below:
- Neer: NEER is founded by Elango Thevar in 2020. It is located in Washington. It is a cloud-based Machine Learning Platform that assists communities in optimizing current water infrastructure and developing an efficient system. It's a tool for everyone, from engineers managing extremely complex systems to communities beginning to develop new infrastructure.
- Fincovi: Fincovi is founded by Ray O Neill, Damian Malone, and Jayesh Shah in 2019. It is located in Athlone, Westmeath, Ireland. It is a renewable energy-focused technology-enabled back and middle office solution provider.
Which are the Most Significant Players in the Global Plant Asset Management Market?
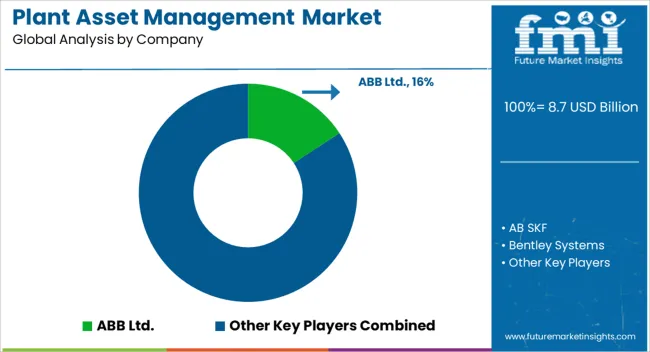
To acquire a competitive advantage in the market, companies are focusing on various merger and acquisition methods. The key players in the plant asset management include:
- ABB Ltd.
- AB SKF
- Bentley Systems
- CGI Group, Inc.
- Dassault Systèmes
- Emerson
- Endress+Hauser Management AG
- General Electrical
- Hitachi
- Honeywell
- IBM Corporation
- IFS AB
- Ing. Punzenberger COPA-DATA GmbH
- Maxwell Technologies Inc
- Oracle Corporation
- Ramco Systems Ltd.
- Rockwell Automation
- SAP SE
- Siemens
- Schneider Electric SA
- Yokogawa Electric Corporation
Recent key developments among players are:
- In July 2022, ABB introduced a small high-power charger best suited for urban consumers.
- In July 2022, SKF and Quaker Houghton collaborated to provide circular oil use
- In July 2022, IGM Financial appointed CGI to operate and upgrade its transfer agency platform.
- In July 2022, GE revealed the brand names of the new firms that will be formed as a result of its planned split into three industry-leading, worldwide, investment-grade public companies focused on the expansion sectors of healthcare, energy, and aviation.
- In July 2022, Hitachi High-Tech Corporation announced the development of a remote diagnostic service for on-board automobile lithium-ion batteries. The achievement of steady and efficient battery operation is becoming more critical for the deployment of electric cars. Hitachi High-Tech will begin recommending this service to worldwide clients via various networks in order to contribute to a circular society by resolving customer difficulties.
- In Feb. 2022, Emerson announced strategies for expansion as well as the inauguration of a new integrated manufacturing facility in Chennai
Report Scope
Report Attribute |
Details |
Market Value in 2022 |
US$ 6 Billion |
Market Value in 2032 |
US$ 18 Billion |
Growth Rate |
CAGR of 11.6% from 2022 to 2032 |
Base Year for Estimation |
2021 |
Historical Data |
2017-2021 |
Forecast Period |
2022-2032 |
Quantitative Units |
Revenue in US$ Million and CAGR from 2022-2032 |
Report Coverage |
Revenue Forecast, Volume Forecast, Company Ranking, Competitive Landscape, Growth Factors, Trends and Pricing Analysis |
Segments Covered |
|
Regions Covered |
|
Key Countries Profiled |
|
Key Companies Profiled |
|
Customization |
Available Upon Request |
Key Segments Covered in the Plant Asset Management Industry Survey
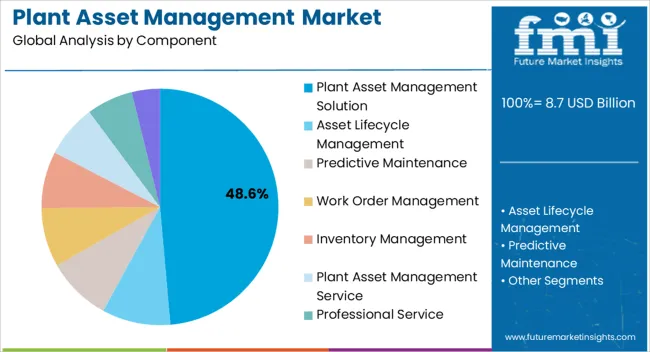
Plant Asset Management Market by Component:
- Plant Asset Management Solution
- Asset Lifecycle Management
- Predictive Maintenance
- Work Order Management
- Inventory Management
- Plant Asset Management Service
- Professional Service
- Managed Service
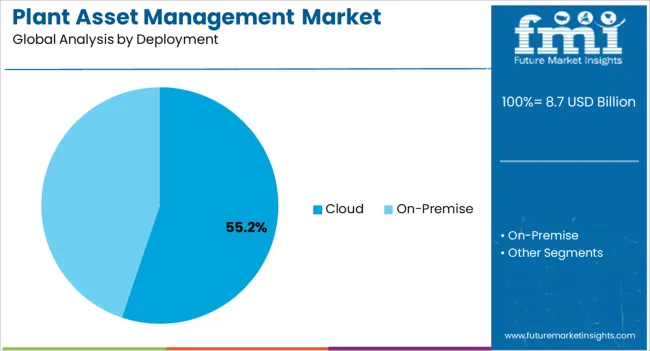
Plant Asset Management Market by Deployment:
- Cloud Plant Asset Management
- On-premise Plant Asset Management
Plant Asset Management Market by Asset Type:
- Production Plant Asset Management
- Automation Plant Asset Management
Plant Asset Management Market by End User:
- Plant Asset Management for Energy & Power
- Plant Asset Management for Oil & Gas
- Plant Asset Management for Petrochemicals
- Plant Asset Management for Mining & Metals
- Plant Asset Management for Aerospace & Defense
- Plant Asset Management for Automotive
- Plant Asset Management for Other End Users
Plant Asset Management Market by Region:
- North America Plant Asset Management Market
- Europe Plant Asset Management Market
- East Asia Plant Asset Management Market
- South Asia Plant Asset Management Market
- Oceania Plant Asset Management Market
- Latin America Plant Asset Management Market
- Middle East & Africa Plant Asset Management Market
Frequently Asked Questions
The global Plant Asset Management market is estimated at US$ 5 Billion in 2021
The global Plant Asset Management market is estimated at US$ 18 Billion by 2032
The global Plant Asset Management market is expected to expand at an 11.6% growth rate till 2032
The U.S market is anticipated to exhibit a 10.6% CAGR from 2022 to 2032
India is projected to record a 9% CAGR during the forecast period
The cloud segment is likely to expand at 10.2% CAGR in the forecast period.
Table of Content
1. Executive Summary
1.1. Key Findings
1.1.1. Overall Plant Asset Management Market
1.1.2. Segment Overview
1.1.3. Regional Overview
1.1.4. Competitor’s Focus
1.1.5. Consumer’s Perception
1.2. Summary of Statistics
1.3. Market Characteristics and Attributes
2. Market Overview
2.1. Introduction and Definition
2.2. Research Scope
3. Market Background
3.1. Country wise Market Attractiveness Index
3.2. Plant Asset Management Market Scenario-based Forecast
3.3. Value Chain Analysis
3.3.1. List of Manufacturers
3.3.2. List of Online Retailers
3.3.3. List of End-Use Industries
3.4. Investment Feasibility Assessment
3.4.1. Investment Feasibility for Plant Asset Management Market
3.5. Porter’s Five Forces Analysis
3.5.1. Bargaining Power of Buyers
3.5.2. Bargaining Power of Suppliers
3.5.3. Threat of Substitute Deployments
3.5.4. Threat of New Entrants
3.5.5. Intensity of Rivalry
3.5.6. 5 Forces Acting Upon Plant Asset Management Market
3.6. PESTEL Analysis
3.7. Forecast Factors
3.7.1. Increasing Government Regulations
3.7.2. Expansion of Industry
3.7.3. Compliance to Insurance Regulations
3.7.4. Advancements in Market
3.7.5. Increasing Global Temperature
3.7.6. Technological Advancements
3.8. Market Dynamics
3.8.1. Market Drivers
3.8.2. Market Restraints
3.8.3. Opportunity Windows
3.8.4. Key Trends
4. Global Plant Asset Management Market Pricing Analysis
4.1. Price Point Assessment
4.1.1. Weighted Average Pricing (2020), by Region
4.1.2. Key Factors Influencing Pricing
4.1.3. Price Benchmark by Region
4.1.4. Price Benchmark by Component
5. Global Plant Asset Management Market Analysis (2017-2021) and Forecast (2022–2032)
5.1. Market Overview
5.2. Introduction to Market Statistics
5.2.1. Global Plant Asset Management Market Volume (Units)
5.2.2. Global Plant Asset Management Market Value (US$ Th.)
5.2.3. Global Plant Asset Management Cumulative Historical Market and Absolute $ Opportunity
5.3. Y-o-Y Growth and Incremental Opportunity
5.4. Absolute Dollar Historical Market and Absolute Dollar Opportunity
6. Global Plant Asset Management Market Analysis (2017-2021) and Forecast (2022–2032), by Component
6.1. Introduction
6.1.1. Plant Asset Management Component Definition
6.1.1.1. Solution
6.1.1.1.1. Asset Lifecycle Management
6.1.1.1.2. Predictive Maintenance
6.1.1.1.3. Work Order Management
6.1.1.1.4. Inventory Management
6.1.1.2. Service
6.1.1.2.1. Professional
6.1.1.2.2. Managed
6.1.2. Plant Asset Management Market Key Findings, by Component
6.1.2.1. Absolute $ Opportunity (2022–2032)
6.1.2.2. Market Share and BPS Analysis
6.1.2.3. Y-o-Y Growth Projections
6.1.2.4. Market Attractiveness Analysis
6.2. Global Plant Asset Management Market Regional Market Share Comparison, by Component
7. Global Plant Asset Management Market Analysis (2017-2021) and Forecast (2022–2032), by Deployment
7.1. Introduction
7.1.1. Plant Asset Management Deployment Definition
7.1.1.1. Cloud
7.1.1.2. On-Premise
7.1.1. Plant Asset Management Market Key Findings, by Deployment
7.1.1.1. Absolute $ Opportunity (2022–2032)
7.1.1.2. Market Share and BPS Analysis
7.1.1.3. Y-o-Y Growth Projections
7.1.1.4. Market Attractiveness Analysis
7.2. Global Plant Asset Management Market Regional Market Share Comparison, by Deployment
8. Global Plant Asset Management Market Analysis (2017-2021) and Forecast (2022–2032), by Asset Type
8.1. Introduction
8.1.1. Plant Asset Management End User Definition
8.1.1.1. Production Asset
8.1.1.2. Automation Asset
8.1.1.3. Squeeze Pouches
8.1.2. Plant Asset Management Market Key Findings, by Asset Type
8.1.2.1. Absolute $ Opportunity (2022–2032)
8.1.2.2. Market Share and BPS Analysis
8.1.2.3. Y-o-Y Growth Projections
8.1.2.4. Market Attractiveness Analysis
8.2. Global Plant Asset Management Market Regional Market Share Comparison, by Asset Type
9. Global Plant Asset Management Market Analysis (2017-2021) and Forecast (2022–2032), by End User
9.1. Introduction
9.1.1. Plant Asset Management End User Definition
9.1.1.1. Energy & Power
9.1.1.2. Oil & Gas
9.1.1.3. Petrochemical
9.1.1.4. Mining & Metal
9.1.1.5. Aerospace & Defense
9.1.1.6. Automotive
9.1.1.7. Others
9.1.2. Plant Asset Management Market Key Findings, by End User
9.1.2.1. Absolute $ Opportunity (2022–2032)
9.1.2.2. Market Share and BPS Analysis
9.1.2.3. Y-o-Y Growth Projections
9.1.2.4. Market Attractiveness Analysis
9.2. Global Plant Asset Management Market Regional Market Share Comparison, by End User
10. Global Plant Asset Management Market Analysis (2017-2021) and Forecast (2022–2032), by Region
10.1. Introductio
10.1.1. Plant Asset Management Regional Coverage
10.1.1.1. North America
10.1.1.2. Europe
10.1.1.3. East Asia
10.1.1.4. South Asia
10.1.1.5. Latin America
10.1.1.6. Middle East & Africa (MEA)
10.1.1.7. Oceania
10.1.2. Plant Asset Management Market Key Findings, by Region
10.1.2.1. Absolute $ Opportunity (2022–2032)
10.1.2.2. Market Share and BPS Analysis
10.1.2.3. Y-o-Y Growth Projections
10.1.2.4. Market Attractiveness Analysis
10.2. Global Plant Asset Management Market Regional Market Share Comparison, by Region
11. North America Plant Asset Management Market Analysis and Forecast
11.1. Overview
11.1.1. North America Share in Global Plant Asset Management Market
11.2. Market Value & Volume Forecast and Analysis
11.2.1. By Country
11.2.1.1. U.S.
11.2.1.2. Canada
11.2.2. By Component
11.2.3. By Deployment
11.2.4. By End User
11.2.5. By End User
11.3. Market Attractiveness Analysis
11.3.1. By Country
11.3.1.1. U.S.
11.3.1.2. Canada
11.3.2. By Component
11.3.3. By Deployment
11.3.4. By End User
11.3.5. By End User
11.4. Y-o-Y Growth Comparison
12. Europe Plant Asset Management Market Analysis and Forecast
12.1. Overview
12.1.1. Europe Share in Global Plant Asset Management Market
12.2. Market Value & Volume Forecast and Analysis
12.2.1. By Country
12.2.1.1. Germany
12.2.1.2. United Kingdom
12.2.1.3. France
12.2.1.4. Russia
12.2.1.5. Spain
12.2.1.6. Italy
12.2.1.7. Rest of Europe
12.2.2. By Component
12.2.3. By Deployment
12.2.4. By End User
12.2.5. By End User
12.3. Market Attractiveness Analysis
12.3.1. By Country
12.3.1.1. Germany
12.3.1.2. United Kingdom
12.3.1.3. France
12.3.1.4. Russia
12.3.1.5. Spain
12.3.1.6. Italy
12.3.1.7. Rest of Europe
12.3.2. By Component
12.3.3. By Deployment
12.3.4. By End User
12.3.5. By End User
12.4. Y-o-Y Growth Comparison
13. East Asia Plant Asset Management Market Analysis and Forecast
13.1. Overview
13.1.1. East Asia Share in Global Plant Asset Management Market
13.2. Market Value & Volume Forecast and Analysis
13.2.1. By Country
13.2.1.1. China
13.2.1.2. Japan
13.2.1.3. South Korea
13.2.2. By Component
13.2.3. By Deployment
13.2.4. By End User
13.2.5. By End User
13.3. Market Attractiveness Analysis
13.3.1. By Country
13.3.1.1. China
13.3.1.2. Japan
13.3.1.3. South Korea
13.3.2. By Component
13.3.3. By Deployment
13.3.4. By End User
13.3.5. By End User
13.4. Y-o-Y Growth Comparison
14. South Asia Plant Asset Management Market Analysis and Forecast
14.1. Overview
14.1.1. South Asia Share in Global Plant Asset Management Market
14.2. Market Value & Volume Forecast and Analysis
14.2.1. By Country
14.2.1.1. India
14.2.1.2. Singapore
14.2.1.3. Indonesia
14.2.1.4. Thailand
14.2.1.5. Rest of South Asia
14.2.2. By Component
14.2.3. By Deployment
14.2.4. By End User
14.2.5. By End User
14.3. Market Attractiveness Analysis
14.3.1. By Country
14.3.1.1. India
14.3.1.2. Singapore
14.3.1.3. Indonesia
14.3.1.4. Thailand
14.3.1.5. Rest of South Asia
14.3.2. By Component
14.3.3. By Deployment
14.3.4. By End User
14.3.5. By End User
14.4. Y-o-Y Growth Comparison
15. Latin America Plant Asset Management Market Analysis and Forecast
15.1. Overview
15.1.1. Latin America Share in Global Plant Asset Management Market
15.2. Market Value & Volume Forecast and Analysis
15.2.1. By Country
15.2.1.1. Brazil
15.2.1.2. Mexico
15.2.1.3. Rest of LATAM
15.2.2. By Component
15.2.3. By Deployment
15.2.4. By End User
15.2.5. By End User
15.3. Market Attractiveness Analysis
15.3.1. By Country
15.3.1.1. Brazil
15.3.1.2. Mexico
15.3.1.3. Rest of LATAM
15.3.2. By Component
15.3.3. By Deployment
15.3.4. By End User
15.3.5. By End User
15.4. Y-o-Y Growth Comparison
16. Middle East & Africa Plant Asset Management Market Analysis and Forecast
16.1. Overview
16.1.1. Middle East & Africa Share in Global Plant Asset Management Market
16.2. Market Value & Volume Forecast and Analysis
16.2.1. By Country
16.2.1.1. Turkey
16.2.1.2. GCC Countries
16.2.1.3. South Asia
16.2.1.4. Rest of MEA
16.2.2. By Component
16.2.3. By Deployment
16.2.4. By End User
16.2.5. By End User
16.3. Market Attractiveness Analysis
16.3.1. By Country
16.3.1.1. Turkey
16.3.1.2. GCC Countries
16.3.1.3. South Asia
16.3.1.4. Rest of MEA
16.3.2. By Component
16.3.3. By Deployment
16.3.4. By End User
16.3.5. By End User
16.4. Y-o-Y Growth Comparison
17. Oceania Plant Asset Management Market Analysis and Forecast
17.1. Overview
17.1.1. Oceania Share in Global Plant Asset Management Market
17.2. Market Value & Volume Forecast and Analysis
17.2.1. By Country
17.2.1.1. Australia
17.2.1.2. New Zealand
17.2.2. By Component
17.2.3. By Deployment
17.2.4. By End User
17.2.5. By End User
17.3. Market Attractiveness Analysis
17.3.1. By Country
17.3.1.1. Australia
17.3.1.2. New Zealand
17.3.2. By Component
17.3.3. By Deployment
17.3.4. By End User
17.3.5. By End User
17.4. Y-o-Y Growth Comparison
18. Global Plant Asset Management Market Analysis Key Countries
18.1.1. US
18.1.1.1. Share of North American Market
18.1.1.2. Market Share, by Component, 2021
18.1.1.3. Market Share, by Deployment, 2021
18.1.1.4. Market Value (US$ Th.) and Forecast 2022–2032
18.1.1.5. Market Share, by End User, 2021
18.1.2. Canada
18.1.2.1. Share of North American Market
18.1.2.2. Market Share, by Component, 2021
18.1.2.3. Market Share, by Deployment, 2021
18.1.2.4. Market Value (US$ Th.) and Forecast 2022–2032
18.1.2.5. Market Share, by End User, 2021
18.1.3. Germany
18.1.3.1. Share of European Market
18.1.3.2. Market Share, by Component, 2021
18.1.3.3. Market Share, by Deployment, 2021
18.1.3.4. Market Value (US$ Th.) and Forecast 2022–2032
18.1.3.5. Market Share, by End User, 2021
18.1.4. United Kingdom
18.1.4.1. Share of European Market
18.1.4.2. Market Share, by Component, 2021
18.1.4.3. Market Share, by Deployment, 2021
18.1.4.4. Market Value (US$ Th.) and Forecast 2022–2032
18.1.4.5. Market Share, by End User, 2021
18.1.5. France
18.1.5.1. Share of European Market
18.1.5.2. Market Share, by Component, 2021
18.1.5.3. Market Share, by Deployment, 2021
18.1.5.4. Market Value (US$ Th.) and Forecast 2022–2032
18.1.5.5. Market Share, by End User, 2021
18.1.6. Russia
18.1.6.1. Share of European Market
18.1.6.2. Market Share, by Component, 2021
18.1.6.3. Market Share, by Deployment, 2021
18.1.6.4. Market Value (US$ Th.) and Forecast 2022–2032
18.1.6.5. Market Share, by End User, 2021
18.1.7. Spain
18.1.7.1. Share of European Market
18.1.7.2. Market Share, by Component, 2021
18.1.7.3. Market Share, by Deployment, 2021
18.1.7.4. Market Value (US$ Th.) and Forecast 2022–2032
18.1.7.5. Market Share, by End User, 2021
18.1.8. Italy
18.1.8.1. Share of European Market
18.1.8.2. Market Share, by Component, 2021
18.1.8.3. Market Share, by Deployment, 2021
18.1.8.4. Market Value (US$ Th.) and Forecast 2022–2032
18.1.8.5. Market Share, by End User, 2021
18.1.9. China
18.1.9.1. Share of East Asian Market
18.1.9.2. Market Share, by Component, 2021
18.1.9.3. Market Share, by Deployment, 2021
18.1.9.4. Market Value (US$ Th.) and Forecast 2022–2032
18.1.9.5. Market Share, by End User, 2021
18.1.10. Japan
18.1.10.1. Share of East Asian Market
18.1.10.2. Market Share, by Component, 2021
18.1.10.3. Market Share, by Deployment, 2021
18.1.10.4. Market Value (US$ Th.) and Forecast 2022–2032
18.1.10.5. Market Share, by End User, 2021
18.1.11. South Korea
18.1.11.1. Share of East Asian Market
18.1.11.2. Market Share, by Component, 2021
18.1.11.3. Market Share, by Deployment, 2021
18.1.11.4. Market Value (US$ Th.) and Forecast 2022–2032
18.1.11.5. Market Share, by End User, 2021
18.1.12. India
18.1.12.1. Share of South Asian Market
18.1.12.2. Market Share, by Component, 2021
18.1.12.3. Market Share, by Deployment, 2021
18.1.12.4. Market Value (US$ Th.) and Forecast 2022–2032
18.1.12.5. Market Share, by End User, 2021
18.1.13. Singapore
18.1.13.1. Share of South Asian Market
18.1.13.2. Market Share, by Component, 2021
18.1.13.3. Market Share, by Deployment, 2021
18.1.13.4. Market Value (US$ Th.) and Forecast 2022–2032
18.1.13.5. Market Share, by End User, 2021
18.1.14. Indonesia
18.1.14.1. Share of South Asian Market
18.1.14.2. Market Share, by Component, 2021
18.1.14.3. Market Share, by Deployment, 2021
18.1.14.4. Market Value (US$ Th.) and Forecast 2022–2032
18.1.14.5. Market Share, by End User, 2021
18.1.15. Thailand
18.1.15.1. Share of South Asian Market
18.1.15.2. Market Share, by Component, 2021
18.1.15.3. Market Share, by Deployment, 2021
18.1.15.4. Market Value (US$ Th.) and Forecast 2022–2032
18.1.15.5. Market Share, by End User, 2021
18.1.16. Brazil
18.1.16.1. Share of Latin American Market
18.1.16.2. Market Share, by Component, 2021
18.1.16.3. Market Share, by Deployment, 2021
18.1.16.4. Market Value (US$ Th.) and Forecast 2022–2032
18.1.16.5. Market Share, by End User, 2021
18.1.17. Mexico
18.1.17.1. Share of Latin American Market
18.1.17.2. Market Share, by Component, 2021
18.1.17.3. Market Share, by Deployment, 2021
18.1.17.4. Market Value (US$ Th.) and Forecast 2022–2032
18.1.17.5. Market Share, by End User, 2021
18.1.18. Turkey
18.1.18.1. Share of MEA Market
18.1.18.2. Market Share, by Component, 2021
18.1.18.3. Market Share, by Deployment, 2021
18.1.18.4. Market Value (US$ Th.) and Forecast 2022–2032
18.1.18.5. Market Share, by End User, 2021
18.1.19. GCC Countries
18.1.19.1. Share of MEA Market
18.1.19.2. Market Share, by Component, 2021
18.1.19.3. Market Share, by Deployment, 2021
18.1.19.4. Market Value (US$ Th.) and Forecast 2022–2032
18.1.19.5. Market Share, by End User, 2021
18.1.20. South Africa
18.1.20.1. Share of MEA Market
18.1.20.2. Market Share, by Component, 2021
18.1.20.3. Market Share, by Deployment, 2021
18.1.20.4. Market Value (US$ Th.) and Forecast 2022–2032
18.1.20.5. Market Share, by End User, 2021
18.1.21. Australia
18.1.21.1. Share of Oceania Market
18.1.21.2. Market Share, by Component, 2021
18.1.21.3. Market Share, by Deployment, 2021
18.1.21.4. Market Value (US$ Th.) and Forecast 2022–2032
18.1.21.5. Market Share, by End User, 2021
18.1.22. New Zealand
18.1.22.1. Share of Oceania Market
18.1.22.2. Market Share, by Component, 2021
18.1.22.3. Market Share, by Deployment, 2021
18.1.22.4. Market Value (US$ Th.) and Forecast 2022–2032
18.1.22.5. Market Share, by End User, 2021
19. Competition Landscape
19.1. Global Plant Asset Management Market Competition Dashboard
19.2. Global Plant Asset Management Market Tier Structure
19.2.1. Market Structure in 2020
19.2.2. Anticipated Market Structure in 2032
19.3. Global Plant Asset Management Market Share Analysis
20. Competition Analysis
20.1. ABB Ltd.
20.1.1. Company Overview
20.1.2. Deployment Portfolio
20.1.3. Key Strategies
20.1.4. Regional Presence
20.1.5. Key Developments
20.1.6. SWOT Analysis
20.2. AB SKF
20.2.1. Company Overview
20.2.2. Deployment Portfolio
20.2.3. Key Strategies
20.2.4. Regional Presence
20.2.5. Key Developments
20.2.6. SWOT Analysis
20.3. Bentley Systems
20.3.1. Company Overview
20.3.2. Deployment Portfolio
20.3.3. Key Strategies
20.3.4. Regional Presence
20.3.5. Key Developments
20.3.6. SWOT Analysis
20.4. CGI Group Inc.
20.4.1. Company Overview
20.4.2. Deployment Portfolio
20.4.3. Key Strategies
20.4.4. Regional Presence
20.4.5. Key Developments
20.4.6. SWOT Analysis
20.5. Dassault Systemes
20.5.1. Company Overview
20.5.2. Deployment Portfolio
20.5.3. Key Strategies
20.5.4. Regional Presence
20.5.5. Key Developments
20.5.6. SWOT Analysis
20.6. Emerson
20.6.1. Company Overview
20.6.2. Deployment Portfolio
20.6.3. Key Strategies
20.6.4. Regional Presence
20.6.5. Key Developments
20.6.6. SWOT Analysis
20.7. Endress+Hauser Management AG
20.7.1. Company Overview
20.7.2. Deployment Portfolio
20.7.3. Key Strategies
20.7.4. Regional Presence
20.7.5. Key Developments
20.7.6. SWOT Analysis
20.8. General Electric
20.8.1. Company Overview
20.8.2. Deployment Portfolio
20.8.3. Key Strategies
20.8.4. Regional Presence
20.8.5. Key Developments
20.8.6. SWOT Analysis
20.9. Hitachi
20.9.1. Company Overview
20.9.2. Deployment Portfolio
20.9.3. Key Strategies
20.9.4. Regional Presence
20.9.5. Key Developments
20.9.6. SWOT Analysis
20.10. Honeywell
20.10.1. Company Overview
20.10.2. Deployment Portfolio
20.10.3. Key Strategies
20.10.4. Regional Presence
20.10.5. Key Developments
20.10.6. SWOT Analysis
20.11. IBM Corporation
20.11.1. Company Overview
20.11.2. Deployment Portfolio
20.11.3. Key Strategies
20.11.4. Regional Presence
20.11.5. Key Developments
20.11.6. SWOT Analysis
20.12. IFS AB
20.12.1. Company Overview
20.12.2. Deployment Portfolio
20.12.3. Key Strategies
20.12.4. Regional Presence
20.12.5. Key Developments
20.12.6. SWOT Analysis
20.13. Ing. Punzenberger COPA-DATA GmbH
20.13.1. Company Overview
20.13.2. Deployment Portfolio
20.13.3. Key Strategies
20.13.4. Regional Presence
20.13.5. Key Developments
20.13.6. SWOT Analysis
20.14. Others
20.14.1. Company Overview
20.14.2. Deployment Portfolio
20.14.3. Key Strategies
20.14.4. Regional Presence
20.14.5. Key Developments
20.14.6. SWOT Analysis
21. Appendix
22. Definitions of Analytical Frameworks
23. Sources and References
Let us know your requirement to get
100% FREE customization
List of Tables
Table 01: Global Plant Asset Management Market Volume (Units), by Component, 2017–2032
Table 02: Global Plant Asset Management Market Value (US$ Th.), by Component, 2017–2032
Table 03: Global Plant Asset Management Market Volume (Units), by Deployment, 2017–2032
Table 04: Global Plant Asset Management Market Value (US$ Th.), by Deployment, 2017–2032
Table 05: Global Plant Asset Management Market Volume (Units), by End User, 2017–2032
Table 06: Global Plant Asset Management Market Value (US$ Th.), by End User, 2017–2032
Table 07: Global Plant Asset Management Market Volume (Units), by End User, 2017–2032
Table 08: Global Plant Asset Management Market Value (US$ Th.), by End User, 2017–2032
Table 09: Global Plant Asset Management Market Volume (Units), by Region, 2017–2032
Table 10: Global Plant Asset Management Market Value (US$ Th.), by Region, 2017–2032
Table 11: North America Plant Asset Management Market Volume (Units), by Component, 2017–2032
Table 12: North America Plant Asset Management Market Value (US$ Th.), by Component, 2017–2032
Table 13: North America Plant Asset Management Market Volume (Units), by Deployment, 2017–2032
Table 14: North America Plant Asset Management Market Value (US$ Th.), by Deployment, 2017–2032
Table 15: North America Plant Asset Management Market Volume (Units), by End User, 2017–2032
Table 16: North America Plant Asset Management Market Value (US$ Th.), by End User, 2017–2032
Table 17: North America Plant Asset Management Market Volume (Units), by End User, 2017–2032
Table 18: North America Plant Asset Management Market Value (US$ Th.), by End User, 2017–2032
Table 19: North America Plant Asset Management Market Volume (Units), by Country, 2017–2032
Table 20: North America Plant Asset Management Market Value (US$ Th.), by Country, 2017–2032
Table 21: Europe Plant Asset Management Market Volume (Units), by Component, 2017–2032
Table 22: Europe Plant Asset Management Market Value (US$ Th.), by Component, 2017–2032
Table 23: Europe Plant Asset Management Market Volume (Units), by Deployment, 2017–2032
Table 24: Europe Plant Asset Management Market Value (US$ Th.), by Deployment, 2017–2032
Table 25: Europe Plant Asset Management Market Volume (Units), by End User, 2017–2032
Table 26: Europe Plant Asset Management Market Value (US$ Th.), by End User, 2017–2032
Table 27: Europe Plant Asset Management Market Volume (Units), by End User, 2017–2032
Table 28: Europe Plant Asset Management Market Value (US$ Th.), by End User, 2017–2032
Table 29: Europe Plant Asset Management Market Volume (Units), by Country, 2017–2032
Table 30: Europe Plant Asset Management Market Value (US$ Th.), by Country, 2017–2032
Table 31: East Asia Plant Asset Management Market Volume (Units), by Component, 2017–2032
Table 32: East Asia Plant Asset Management Market Value (US$ Th.), by Component, 2017–2032
Table 33: East Asia Plant Asset Management Market Volume (Units), by Deployment, 2017–2032
Table 34: East Asia Plant Asset Management Market Value (US$ Th.), by Deployment, 2017–2032
Table 35: East Asia Plant Asset Management Market Volume (Units), by End User, 2017–2032
Table 36: East Asia Plant Asset Management Market Value (US$ Th.), by End User, 2017–2032
Table 37: East Asia Plant Asset Management Market Volume (Units), by End User, 2017–2032
Table 38: East Asia Plant Asset Management Market Value (US$ Th.), by End User, 2017–2032
Table 39: East Asia Plant Asset Management Market Volume (Units), by Country, 2017–2032
Table 40: East Asia Plant Asset Management Market Value (US$ Th.), by Country, 2017–2032
Table 41: South Asia Plant Asset Management Market Volume (Units), by Component, 2017–2032
Table 42: South Asia Plant Asset Management Market Value (US$ Th.), by Component, 2017–2032
Table 43: South Asia Plant Asset Management Market Volume (Units), by Deployment, 2017–2032
Table 44: South Asia Plant Asset Management Market Value (US$ Th.), by Deployment, 2017–2032
Table 45: South Asia Plant Asset Management Market Volume (Units), by End User, 2017–2032
Table 46: South Asia Plant Asset Management Market Value (US$ Th.), by End User, 2017–2032
Table 47: South Asia Plant Asset Management Market Volume (Units), by End User, 2017–2032
Table 48: South Asia Plant Asset Management Market Value (US$ Th.), by End User, 2017–2032
Table 49: South Asia Plant Asset Management Market Volume (Units), by Country, 2017–2032
Table 50: South Asia Plant Asset Management Market Value (US$ Th.), by Country, 2017–2032
Table 51: Latin America Plant Asset Management Market Volume (Units), by Component, 2017–2032
Table 52: Latin America Plant Asset Management Market Value (US$ Th.), by Component, 2017–2032
Table 53: Latin America Plant Asset Management Market Volume (Units), by Deployment, 2017–2032
Table 54: Latin America Plant Asset Management Market Value (US$ Th.), by Deployment, 2017–2032
Table 55: Latin America Plant Asset Management Market Volume (Units), by End User, 2017–2032
Table 56: Latin America Plant Asset Management Market Value (US$ Th.), by End User, 2017–2032
Table 57: Latin America Plant Asset Management Market Volume (Units), by End User, 2017–2032
Table 58: Latin America Plant Asset Management Market Value (US$ Th.), by End User, 2017–2032
Table 59: Latin America Plant Asset Management Market Volume (Units), by Country, 2017–2032
Table 60: Latin America Plant Asset Management Market Value (US$ Th.), by Country, 2017–2032
Table 61: Middle East and Africa Plant Asset Management Market Volume (Units), by Component, 2017–2032
Table 62: Middle East and Africa Plant Asset Management Market Value (US$ Th.), by Component, 2017–2032
Table 63: Middle East and Africa Plant Asset Management Market Volume (Units), by Deployment, 2017–2032
Table 64: Middle East and Africa Plant Asset Management Market Value (US$ Th.), by Deployment, 2017–2032
Table 65: Middle East and Africa Plant Asset Management Market Volume (Units), by End User, 2017–2032
Table 66: Middle East and Africa Plant Asset Management Market Value (US$ Th.), by End User, 2017–2032
Table 67: Middle East and Africa Plant Asset Management Market Volume (Units), by End User, 2017–2032
Table 68: Middle East and Africa Plant Asset Management Market Value (US$ Th.), by End User, 2017–2032
Table 69: Middle East and Africa Plant Asset Management Market Volume (Units), by Country, 2017–2032
Table 70: Middle East and Africa Plant Asset Management Market Value (US$ Th.), by Country, 2017–2032
Table 71: Oceania Plant Asset Management Market Volume (Units), by Component, 2017–2032
Table 72: Oceania Plant Asset Management Market Value (US$ Th.), by Component, 2017–2032
Table 73: Oceania Plant Asset Management Market Volume (Units), by Deployment, 2017–2032
Table 74: Oceania Plant Asset Management Market Value (US$ Th.), by Deployment, 2017–2032
Table 75: Oceania Plant Asset Management Market Volume (Units), by End User, 2017–2032
Table 76: Oceania Plant Asset Management Market Value (US$ Th.), by End User, 2017–2032
Table 77: Oceania Plant Asset Management Market Volume (Units), by End User, 2017–2032
Table 78: Oceania Plant Asset Management Market Value (US$ Th.), by End User, 2017–2032
Table 79: Oceania Plant Asset Management Market Volume (Units), by Country, 2017–2032
Table 80: Oceania Plant Asset Management Market Value (US$ Th.), by Country, 2017–2032
Find your sweet spots for generating winning opportunities in this market.
Talk to AnalystList of Charts
Fig 01: Global Plant Asset Management Market Volume (Units), Value (US$ Thousand) and Y-o-Y Growth, 2017–2032
Fig 02: Global Plant Asset Management Absolute $ Historical Market (2017-2021) and Absolute $ Opportunity (2022–2032), US$ Th.
Fig 03: Global Plant Asset Management Absolute Historical Volume Market (2017-2021) and Absolute Volume Opportunity (2022–2032), Units
Fig 04: Global Plant Asset Management Market Value Y-o-Y Growth and Forecast, 2017–2032
Fig 05: Global Plant Asset Management Market Incremental $ Opportunity (US$ Thousand), 2022–2032
Fig 06: Global Plant Asset Management Market Share, By Component – 2022–2032
Fig 07: Global Plant Asset Management Market Y-o-Y Growth Projections, By Component – 2022–2032
Fig 08: Global Plant Asset Management Market Attractiveness Index, By Component – 2022–2032
Fig 09: Global Plant Asset Management Market Share, By Deployment – 2022–2032
Fig 10: Global Plant Asset Management Market Y-o-Y Growth Projections, By Deployment – 2022–2032
Fig 11: Global Plant Asset Management Market Attractiveness Index, By Deployment – 2022–2032
Fig 12: Global Plant Asset Management Market Share, By End User – 2022–2032
Fig 13: Global Plant Asset Management Market Y-o-Y Growth Projections, By End User – 2022–2032
Fig 14: Global Plant Asset Management Market Attractiveness Index, By End User – 2022–2032
Fig 15: Global Plant Asset Management Market Share, By End User – 2022–2032
Fig 16: Global Plant Asset Management Market Y-o-Y Growth Projections, By End User – 2022–2032
Fig 17: Global Plant Asset Management Market Attractiveness Index, By End User – 2022–2032
Fig 18: Global Plant Asset Management Market Share, by Region – 2022–2032
Fig 19: Global Plant Asset Management Market Y-o-Y Growth Projections, by Region – 2022–2032
Fig 20: Global Plant Asset Management Market Attractiveness Index, by Region – 2022–2032
Fig 21: North America Plant Asset Management Market Value (US$ Thousand), Volume (Units) Forecast and Analysis, 2017–2032
Fig 22: Y-o-Y Growth Comparison of Plant Asset Management Market : North America Vs North America Countries Vs North America Average
Fig 23: North America Plant Asset Management Market Share, By Component – 2022–2032
Fig 24: North America Plant Asset Management Market Y-o-Y Growth Projections, By Component – 2022–2032
Fig 25: North America Plant Asset Management Market Attractiveness Index, By Component – 2022–2032
Fig 26: North America Plant Asset Management Market Share, By Deployment – 2022–2032
Fig 27: North America Plant Asset Management Market Y-o-Y Growth Projections, By Deployment – 2022–2032
Fig 28: North America Plant Asset Management Market Attractiveness Index, By Deployment – 2022–2032
Fig 29: North America Plant Asset Management Market Share, By End User – 2022–2032
Fig 30: North America Plant Asset Management Market Y-o-Y Growth Projections, By End User – 2022–2032
Fig 31: North America Plant Asset Management Market Attractiveness Index, By End User – 2022–2032
Fig 32: North America Plant Asset Management Market Share, By End User – 2022–2032
Fig 33: North America Plant Asset Management Market Y-o-Y Growth Projections, By End User – 2022–2032
Fig 34: North America Plant Asset Management Market Attractiveness Index, By End User – 2022–2032
Fig 35: North America Plant Asset Management Market Share, By Country – 2022–2032
Fig 36: North America Plant Asset Management Market Y-o-Y Growth Projections, By Country – 2022–2032
Fig 37: North America Plant Asset Management Market Attractiveness Index, By Country – 2022–2032
Fig 38: Europe Plant Asset Management Market Value (US$ Thousand), Volume (Units) Forecast and Analysis, 2017–2032
Fig 39: Y-o-Y Growth Comparison of Plant Asset Management Market : Europe Vs Europe Countries Vs Europe Average
Fig 40: Europe Plant Asset Management Market Share, By Component – 2022–2032
Fig 41: Europe Plant Asset Management Market Y-o-Y Growth Projections, By Component – 2022–2032
Fig 42: Europe Plant Asset Management Market Attractiveness Index, By Component – 2022–2032
Fig 43: Europe Plant Asset Management Market Share, By Deployment – 2022–2032
Fig 44: Europe Plant Asset Management Market Y-o-Y Growth Projections, By Deployment – 2022–2032
Fig 45: Europe Plant Asset Management Market Attractiveness Index, By Deployment – 2022–2032
Fig 46: Europe Plant Asset Management Market Share, By End User – 2022–2032
Fig 47: Europe Plant Asset Management Market Y-o-Y Growth Projections, By End User – 2022–2032
Fig 48: Europe Plant Asset Management Market Attractiveness Index, By End User – 2022–2032
Fig 49: Europe Plant Asset Management Market Share, By End User – 2022–2032
Fig 50: Europe Plant Asset Management Market Y-o-Y Growth Projections, By End User – 2022–2032
Fig 51: Europe Plant Asset Management Market Attractiveness Index, By End User – 2022–2032
Fig 52: Europe Plant Asset Management Market Share, By Country – 2022–2032
Fig 53: Europe Plant Asset Management Market Y-o-Y Growth Projections, By Country – 2022–2032
Fig 54: Europe Plant Asset Management Market Attractiveness Index, By Country – 2022–2032
Fig 55: East Asia Plant Asset Management Market Value (US$ Thousand), Volume (Units) Forecast and Analysis, 2017–2032
Fig 56: Y-o-Y Growth Comparison of Plant Asset Management Market : East Asia Vs East Asia Countries Vs East Asia Average
Fig 57: East Asia Plant Asset Management Market Share, By Component – 2022–2032
Fig 58: East Asia Plant Asset Management Market Y-o-Y Growth Projections, By Component – 2022–2032
Fig 59: East Asia Plant Asset Management Market Attractiveness Index, By Component – 2022–2032
Fig 60: East Asia Plant Asset Management Market Share, By Deployment – 2022–2032
Fig 61: East Asia Plant Asset Management Market Y-o-Y Growth Projections, By Deployment – 2022–2032
Fig 62: East Asia Plant Asset Management Market Attractiveness Index, By Deployment – 2022–2032
Fig 63: East Asia Plant Asset Management Market Share, By End User – 2022–2032
Fig 64: East Asia Plant Asset Management Market Y-o-Y Growth Projections, By End User – 2022–2032
Fig 65: East Asia Plant Asset Management Market Attractiveness Index, By End User – 2022–2032
Fig 66: East Asia Plant Asset Management Market Share, By End User – 2022–2032
Fig 67: East Asia Plant Asset Management Market Y-o-Y Growth Projections, By End User – 2022–2032
Fig 68: East Asia Plant Asset Management Market Attractiveness Index, By End User – 2022–2032
Fig 69: East Asia Plant Asset Management Market Share, By Country – 2022–2032
Fig 70: East Asia Plant Asset Management Market Y-o-Y Growth Projections, By Country – 2022–2032
Fig 71: East Asia Plant Asset Management Market Attractiveness Index, By Country – 2022–2032
Fig 72: South Asia Plant Asset Management Market Value (US$ Thousand), Volume (Units) Forecast and Analysis, 2017–2032
Fig 73: Y-o-Y Growth Comparison of Plant Asset Management Market : South Asia Vs South Asia Countries Vs South Asia Average
Fig 74: South Asia Plant Asset Management Market Share, By Component – 2022–2032
Fig 75: South Asia Plant Asset Management Market Y-o-Y Growth Projections, By Component – 2022–2032
Fig 76: South Asia Plant Asset Management Market Attractiveness Index, By Component – 2022–2032
Fig 77: South Asia Plant Asset Management Market Share, By Deployment – 2022–2032
Fig 78: South Asia Plant Asset Management Market Y-o-Y Growth Projections, By Deployment – 2022–2032
Fig 79: South Asia Plant Asset Management Market Attractiveness Index, By Deployment – 2022–2032
Fig 80: South Asia Plant Asset Management Market Share, By End User – 2022–2032
Fig 81: South Asia Plant Asset Management Market Y-o-Y Growth Projections, By End User – 2022–2032
Fig 82: South Asia Plant Asset Management Market Attractiveness Index, By End User – 2022–2032
Fig 83: South Asia Plant Asset Management Market Share, By End User – 2022–2032
Fig 84: South Asia Plant Asset Management Market Y-o-Y Growth Projections, By End User – 2022–2032
Fig 85: South Asia Plant Asset Management Market Attractiveness Index, By End User – 2022–2032
Fig 86: South Asia Plant Asset Management Market Share, By Country – 2022–2032
Fig 87: South Asia Plant Asset Management Market Y-o-Y Growth Projections, By Country – 2022–2032
Fig 88: South Asia Plant Asset Management Market Attractiveness Index, By Country – 2022–2032
Fig 89: Latin America Plant Asset Management Market Value (US$ Thousand), Volume (Units) Forecast and Analysis, 2017–2032
Fig 90: Y-o-Y Growth Comparison of Plant Asset Management Market : Latin America Vs Latin America Countries Vs Latin America Average
Fig 91: Latin America Plant Asset Management Market Share, By Component – 2022–2032
Fig 92: Latin America Plant Asset Management Market Y-o-Y Growth Projections, By Component – 2022–2032
Fig 93: Latin America Plant Asset Management Market Attractiveness Index, By Component – 2022–2032
Fig 94: Latin America Plant Asset Management Market Share, By Deployment – 2022–2032
Fig 95: Latin America Plant Asset Management Market Y-o-Y Growth Projections, By Deployment – 2022–2032
Fig 96: Latin America Plant Asset Management Market Attractiveness Index, By Deployment – 2022–2032
Fig 97: Latin America Plant Asset Management Market Share, By End User – 2022–2032
Fig 98: Latin America Plant Asset Management Market Y-o-Y Growth Projections, By End User – 2022–2032
Fig 99: Latin America Plant Asset Management Market Attractiveness Index, By End User – 2022–2032
Fig 100: Latin America Plant Asset Management Market Share, By End User – 2022–2032
Fig 101: Latin America Plant Asset Management Market Y-o-Y Growth Projections, By End User – 2022–2032
Fig 102: Latin America Plant Asset Management Market Attractiveness Index, By End User – 2022–2032
Fig 103: Latin America Plant Asset Management Market Share, By Country – 2022–2032
Fig 104: Latin America Plant Asset Management Market Y-o-Y Growth Projections, By Country – 2022–2032
Fig 105: Latin America Plant Asset Management Market Attractiveness Index, By Country – 2022–2032
Fig 106: MEA Plant Asset Management Market Value (US$ Thousand), Volume (Units) Forecast and Analysis, 2017–2032
Fig 107: Y-o-Y Growth Comparison of Plant Asset Management Market : MEA Vs MEA Countries Vs MEA Average
Fig 108: MEA Plant Asset Management Market Share, By Component – 2022–2032
Fig 109: MEA Plant Asset Management Market Y-o-Y Growth Projections, By Component – 2022–2032
Fig 110: MEA Plant Asset Management Market Attractiveness Index, By Component – 2022–2032
Fig 111: MEA Plant Asset Management Market Share, By Deployment – 2022–2032
Fig 112: MEA Plant Asset Management Market Y-o-Y Growth Projections, By Deployment – 2022–2032
Fig 113: MEA Plant Asset Management Market Attractiveness Index, By Deployment – 2022–2032
Fig 114: MEA Plant Asset Management Market Share, By End User – 2022–2032
Fig 115: MEA Plant Asset Management Market Y-o-Y Growth Projections, By End User – 2022–2032
Fig 116: MEA Plant Asset Management Market Attractiveness Index, By End User – 2022–2032
Fig 117: MEA Plant Asset Management Market Share, By End User – 2022–2032
Fig 118: MEA Plant Asset Management Market Y-o-Y Growth Projections, By End User – 2022–2032
Fig 119: MEA Plant Asset Management Market Attractiveness Index, By End User – 2022–2032
Fig 120: MEA Plant Asset Management Market Share, By Country – 2022–2032
Fig 121: MEA Plant Asset Management Market Y-o-Y Growth Projections, By Country – 2022–2032
Fig 122: MEA Plant Asset Management Market Attractiveness Index, By Country – 2022–2032
Fig 123: Oceania Plant Asset Management Market Value (US$ Thousand), Volume (Units) Forecast and Analysis, 2017–2032
Fig 124: Y-o-Y Growth Comparison of Plant Asset Management Market : Oceania Vs Oceania Countries Vs Oceania Average
Fig 125: Oceania Plant Asset Management Market Share, By Component – 2022–2032
Fig 126: Oceania Plant Asset Management Market Y-o-Y Growth Projections, By Component – 2022–2032
Fig 127: Oceania Plant Asset Management Market Attractiveness Index, By Component – 2022–2032
Fig 128: Oceania Plant Asset Management Market Share, By Deployment – 2022–2032
Fig 129: Oceania Plant Asset Management Market Y-o-Y Growth Projections, By Deployment – 2022–2032
Fig 130: Oceania Plant Asset Management Market Attractiveness Index, By Deployment – 2022–2032
Fig 131: Oceania Plant Asset Management Market Share, By End User – 2022–2032
Fig 132: Oceania Plant Asset Management Market Y-o-Y Growth Projections, By End User – 2022–2032
Fig 133: Oceania Plant Asset Management Market Attractiveness Index, By End User – 2022–2032
Fig 134: Oceania Plant Asset Management Market Share, By End User – 2022–2032
Fig 135: Oceania Plant Asset Management Market Y-o-Y Growth Projections, By End User – 2022–2032
Fig 136: Oceania Plant Asset Management Market Attractiveness Index, By End User – 2022–2032
Fig 137: Oceania Plant Asset Management Market Share, By Country – 2022–2032
Fig 138: Oceania Plant Asset Management Market Y-o-Y Growth Projections, By Country – 2022–2032
Fig 139: Oceania Plant Asset Management Market Attractiveness Index, By Country – 2022–2032
Fig 140: United States Market share by Component, 2021
Fig 141: United States Market share by Deployment, 2021
Fig 142: United States Plant Asset Management Market Value (US$ Th.) and Forecast 2022–2032
Fig 143: United States Market Share by End User, 2021
Fig 144: Canada Market share by Component, 2021
Fig 145: Canada Market share by Deployment, 2021
Fig 146: Canada Plant Asset Management Market Value (US$ Th.) and Forecast 2022–2032
Fig 147: Canada Market Share by End User, 2021
Fig 148: Germany Market share by Component, 2021
Fig 149: Germany Market share by Deployment, 2021
Fig 150: Germany Plant Asset Management Market Value (US$ Th.) and Forecast 2022–2032
Fig 151: Germany Market Share by End User, 2021
Fig 152: United Kingdom Market share by Component, 2021
Fig 153: United Kingdom Market share by Deployment, 2021
Fig 154: United Kingdom Plant Asset Management Market Value (US$ Th.) and Forecast 2022–2032
Fig 155: United Kingdom Market Share by End User, 2021
Fig 156: France Market share by Component, 2021
Fig 157: France Market share by Deployment, 2021
Fig 158: France Plant Asset Management Market Value (US$ Th.) and Forecast 2022–2032
Fig 159: France Market Share by End User, 2021
Fig 160: Russia Market share by Component, 2021
Fig 161: Russia Market share by Deployment, 2021
Fig 162: Russia Plant Asset Management Market Value (US$ Th.) and Forecast 2022–2032
Fig 163: Russia Market Share by End User, 2021
Fig 164: Spain Market share by Component, 2021
Fig 165: Spain Market share by Deployment, 2021
Fig 166: Spain Plant Asset Management Market Value (US$ Th.) and Forecast 2022–2032
Fig 167: Spain Market Share by End User, 2021
Fig 168: Italy Market share by Component, 2021
Fig 169: Italy Market share by Deployment, 2021
Fig 170: Italy Plant Asset Management Market Value (US$ Th.) and Forecast 2022–2032
Fig 171: Italy Market Share by End User, 2021
Fig 172: China Market share by Component, 2021
Fig 173: China Market share by Deployment, 2021
Fig 174: China Plant Asset Management Market Value (US$ Th.) and Forecast 2022–2032
Fig 175: China Market Share by End User, 2021
Fig 176: Japan Market share by Component, 2021
Fig 177: Japan Market share by Deployment, 2021
Fig 178: Japan Plant Asset Management Market Value (US$ Th.) and Forecast 2022–2032
Fig 179: Japan Market Share by End User, 2021
Fig 180: South Korea Market share by Component, 2021
Fig 181: South Korea Market share by Deployment, 2021
Fig 182: South Korea Plant Asset Management Market Value (US$ Th.) and Forecast 2022–2032
Fig 183: South Korea Market Share by End User, 2021
Fig 184: India Market share by Component, 2021
Fig 185: India Market share by Deployment, 2021
Fig 186: India Plant Asset Management Market Value (US$ Th.) and Forecast 2022–2032
Fig 187: India Market Share by End User, 2021
Fig 188: Singapore Market share by Component, 2021
Fig 189: Singapore Market share by Deployment, 2021
Fig 190: Singapore Plant Asset Management Market Value (US$ Th.) and Forecast 2022–2032
Fig 191: Singapore Market Share by End User, 2021
Fig 192: Indonesia Market share by Component, 2021
Fig 193: Indonesia Market share by Deployment, 2021
Fig 194: Indonesia Plant Asset Management Market Value (US$ Th.) and Forecast 2022–2032
Fig 195: Indonesia Market Share by End User, 2021
Fig 196: Thailand Market share by Component, 2021
Fig 197: Thailand Market share by Deployment, 2021
Fig 198: Thailand Plant Asset Management Market Value (US$ Th.) and Forecast 2022–2032
Fig 199: Thailand Market Share by End User, 2021
Fig 200: Brazil Market share by Component, 2021
Fig 201: Brazil Market share by Deployment, 2021
Fig 202: Brazil Plant Asset Management Market Value (US$ Th.) and Forecast 2022–2032
Fig 203: Brazil Market Share by End User, 2021
Fig 204: Mexico Market share by Component, 2021
Fig 205: Mexico Market share by Deployment, 2021
Fig 206: Mexico Plant Asset Management Market Value (US$ Th.) and Forecast 2022–2032
Fig 207: Mexico Market Share by End User, 2021
Fig 208: Turkey Market share by Component, 2021
Fig 209: Turkey Market share by Deployment, 2021
Fig 210: Turkey Plant Asset Management Market Value (US$ Th.) and Forecast 2022–2032
Fig 211: Turkey Market Share by End User, 2021
Fig 212: GCC Countries Market share by Component, 2021
Fig 213: GCC Countries Market share by Deployment, 2021
Fig 214: GCC Countries Plant Asset Management Market Value (US$ Th.) and Forecast 2022–2032
Fig 215: GCC Countries Market Share by End User, 2021
Fig 216: South Africa Market share by Component, 2021
Fig 217: South Africa Market share by Deployment, 2021
Fig 218: South Africa Plant Asset Management Market Value (US$ Th.) and Forecast 2022–2032
Fig 219: South Africa Market Share by End User, 2021
Fig 220: Australia Market share by Component, 2021
Fig 221: Australia Market share by Deployment, 2021
Fig 222: Australia Plant Asset Management Market Value (US$ Th.) and Forecast 2022–2032
Fig 223: Australia Market Share by End User, 2021
Fig 224: New Zealand Market share by Component, 2021
Fig 225: New Zealand Market share by Deployment, 2021
Fig 226: New Zealand Plant Asset Management Market Value (US$ Th.) and Forecast 2022–2032
Fig 227: New Zealand Market Share by End User, 2021
Need specific information?
Request CustomizationExplore Industrial Automation Insights
View Reports