Plant-Based Shrimp Market Size and Share Forecast Outlook 2025 to 2035

The global plant-based shrimp market is projected to grow from USD 1.4 billion in 2025 to USD 3.2 billion by 2035, registering a CAGR of 8.6%. The market expansion is being driven by increasing consumer shift toward sustainable and cruelty-free seafood alternatives.
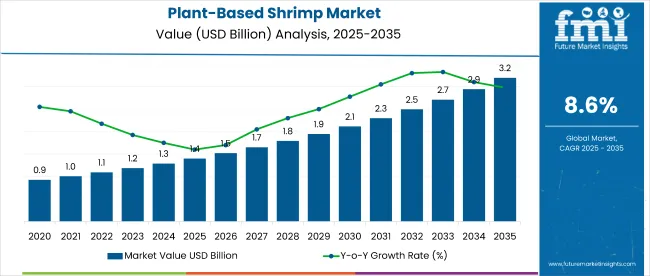
Quick Stats for Plant-Based Shrimp Marke

  • Market Value (2025): USD 1.4 billion
  • Forecast Value (2035): USD 3.2 billion
  • Forecast CAGR: 8.6%
  • Segments Leader in 2025: Frozen Plant-Based Shrimp (50% market share)
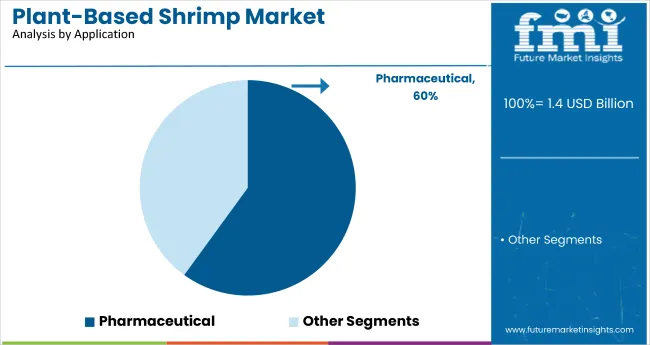
  • Top Application Segment: Pharmaceutical (60% share)
  • Key Growth Region: East Asia (Japan is the fastest-growing market with a 9.2% CAGR)

Plant Based Shrimp Market Market Value Analysis

Metric Value
Industry Size (2025E) USD 1.4 billion
Industry Value (2035F) USD 3.2 billion
CAGR (2025 to 2035) 8.6%

Rising awareness regarding health risks associated with traditional seafood consumption, such as mercury exposure and allergens, is contributing to heightened demand for plant-based shrimp across food service, retail, and e-commerce channels.

The market accounts for 14% of the plant-based seafood market, reflecting its growing traction among consumers seeking sustainable alternatives. Within the broader plant-based meat market, it holds a modest 4.5% share, owing to the dominance of products like burgers and sausages.

In the alternative protein market, its contribution stands at around 2.8%, while in the vegan food market, it represents nearly 1.5%. Its presence in the sustainable food and clean label food markets is estimated at 1% each, indicating early-stage development. Across all parent segments, the market is witnessing accelerated growth.

Government regulations impacting the market emphasize labeling transparency, sustainable sourcing, and food safety. The USA FDA and USDA enforce guidelines around plant-based food claims, allergen disclosures, and nutrition labeling. In Europe, EFSA mandates strict controls for plant-derived protein safety, while the Novel Food Regulation applies to innovative ingredients like algae-based shrimp.

Furthermore, global regulatory frameworks around sustainable aquaculture and marine preservation indirectly bolster demand for plant-based seafood, prompting manufacturers to invest in clean-label, allergen-free, and environmentally friendly shrimp alternatives.

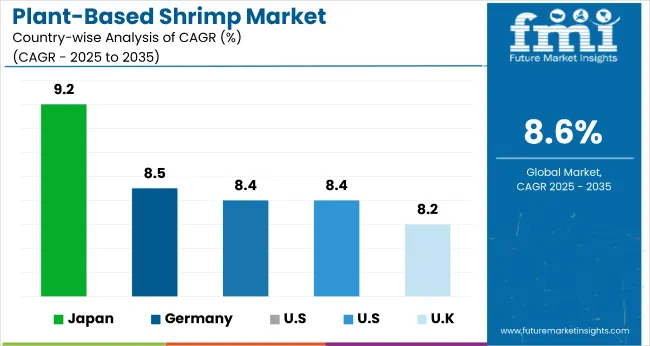
Japan is projected to be the fastest-growing market, expected to expand at a CAGR of 9.2% from 2025 to 2035. Frozen plant-based shrimp will lead the segment with a 50% share, while pharmaceutical will dominate the application segment with a 60% share. The USA and UK markets are expected to grow steadily at CAGRs of 8.3% and 8.2%, respectively, while Germany and France will grow at 8.5% and 8.4% CAGR, respectively.

Plant-Based Shrimp Market Analysis by Top Investment Segments

The global market is segmented by source, segment, product type, distribution channel, end-use, application, and region. By source, the market includes seaweed, legume protein, plant-based omega-3, soy protein, pea protein, and others (quinoa, oats, beans, and seeds).

Based on product format, the market is categorized into frozen, refrigerated, and shelf-stable plant-based shrimp. By product type, the market is segmented into breaded vegan shrimp, crunchy coconut shrimp, crispy vegan shrimp, and raw vegan shrimp.

By distribution channel, the market is divided into B2B and B2C, with store-based retailing (hypermarkets/supermarkets, convenience stores, mass grocery retailers, food & drink specialty stores) and online retailing under B2C. Based on end-use, the market include food service industry, household, and retail. By application, the market is bifurcated into pharmaceutical and clinical trials. Regionally, the market is classified into North America, Latin America, Europe, East Asia, South Asia and Pacific, and the Middle East & Africa.
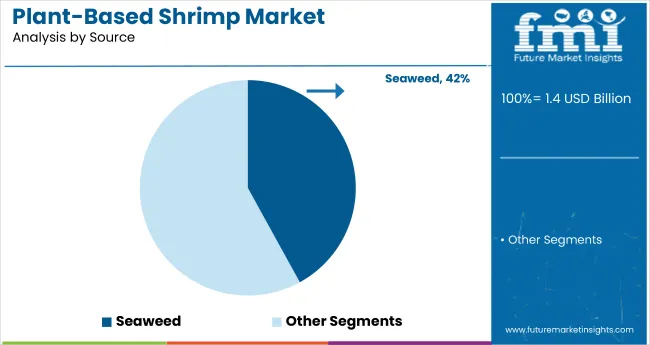
Seaweed to Lead the Source Segment with 42% Market Share in 2025

Plant Based Shrimp Market Analysis By Source

Seaweed is projected to dominate the source segment, accounting for 42% of the global market share by 2025. This growth is driven by its sustainability, allergen-free profile, and seafood-like flavor. Its rich content of essential minerals, iodine, and bioactive compounds supports its use in plant-based meat alternatives, functional foods, and clean-label formulations, further boosting its demand across health-conscious and environmentally aware consumer segments.
  • Seaweed is a sustainable, allergen-free, and nutrient-rich source gaining wide consumer acceptance.
  • Its oceanic flavor and functional properties make it ideal for replicating shrimp texture and taste.

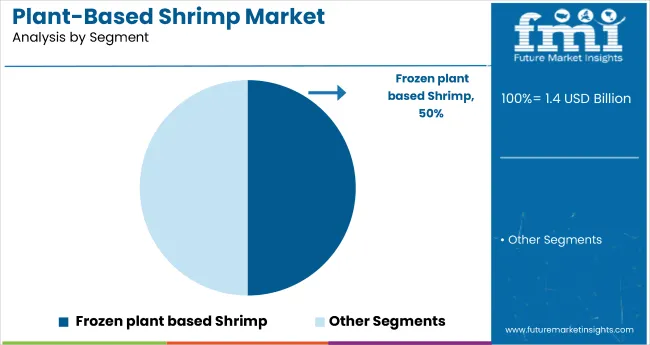
Frozen Plant-Based Shrimp to Capture 50% of the Segment Format in 2025

Plant Based Shrimp Market Analysis By Segment

Frozen products are projected to hold 50% of the segment share by 2025, driven by extended shelf life, cold chain efficiency, and rising demand for ready-to-cook formats. Growth is further supported by expanding plant-based frozen offerings, nutrient retention technologies, and increased adoption across urban foodservice and retail distribution networks.
  • These products offer longer shelf life and convenience for distribution.
  • They are increasingly popular across food service chains and online platforms due to easy storage and reduced waste.

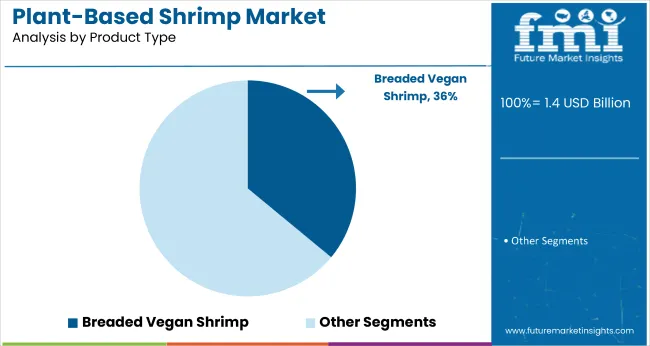
Breaded Vegan Shrimp to Dominate the Product Type Segment with 36% Market Share

Plant Based Shrimp Market Analysis By Product Type

Breaded vegan shrimp is expected to lead the product type segment, capturing 36% of the global market share in 2025 due to its familiar texture, ease of preparation, and strong acceptance among flexitarian and vegan consumers. Rising retail listings, increased HoReCa adoption, and product launches with soy-free, gluten-free claims are accelerating category expansion.

  • The crunchy texture and familiar taste appeal to flexitarian and vegan consumers alike.
  • Easy preparation and strong performance in QSRs and retail drive its popularity.

B2C to Lead the Distribution Channel with 54% Market Share in 2025

B2C is projected to lead the distribution channel, accounting for 54% of the global market share in 2025, driven by increasing consumer access to plant-based products through supermarkets, specialty stores, and e-commerce. Expanding shelf space, promotional campaigns, and subscription-based online models are accelerating consumer adoption across regions.
  • Rising e-commerce penetration and preference for direct-to-consumer brands boost online sales.
  • Convenience, discounts, and access to niche plant-based brands make it a preferred platform.

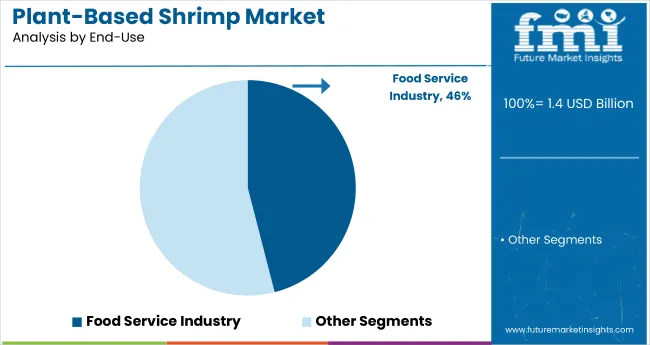
Food Service Industry to Lead the End-Use Segment with 46% Market Share

Plant Based Shrimp Market Analysis By End Use

The food service industry is expected to dominate the end-use segment in 2025 with a 46% share, supported by growing demand from restaurants, quick-service chains, and cafes introducing plant-based shrimp in their menu offerings. Product trials, bulk procurement, and limited-time menu placements drive segment growth.
  • Restaurants and QSRs are introducing plant-based seafood to meet evolving dietary preferences.
  • Menu diversification and consumer demand for sustainable options drive this growth.

Pharmaceutical to Capture 60% of the Application Segment in 2025

Plant Based Shrimp Market Analysis By Application

Pharmaceutical is expected to lead the application segment with a 60% share, driven by the rising use of plant-based omega-3 and protein-rich ingredients in clinical nutrition, supplements, and therapeutic formulations. Growing regulatory approvals, aging populations, and innovation in encapsulation technologies further support demand across prescription and OTC product lines.

  • Plant-based omega-3 and protein-rich formulations are being used in clinical nutrition and supplements.
  • The clean-label, allergen-free profile aligns with pharma-grade ingredient standards.

Top Plant-Based Shrimp Market Dynamics

The global market is experiencing steady growth, fueled by rising consumer demand for sustainable, allergen-free seafood alternatives. Plant-based shrimp serves as a viable solution to environmental concerns, overfishing, and health risks associated with traditional seafood consumption, including mercury contamination and shellfish allergies.

Recent Trends in the Plant-Based Shrimp Market

  • Growing innovation in texture and flavor enhancement using algae-derived ingredients, seaweed, and fermentation techniques to closely mimic real shrimp.
  • Surge in direct-to-consumer (DTC) and e-commerce sales, especially among vegan and flexitarian consumers seeking convenient access to alternative seafood.

Challenges in the Plant-Based Shrimp Market
  • High production costs and complex formulation processes for achieving authentic texture and taste make it difficult for new entrants to scale affordably.
  • Consumer skepticism regarding the nutritional equivalence and taste of plant-based shrimp compared to conventional seafood continues to be a barrier to adoption.

Top Countries Manufacturing, Regulating, and Generating Demand for Plant-Based Shrimp

Plant Based Shrimp Market Cagr Analysis By Country

The global market is being propelled by a blend of dietary shifts, ethical concerns, and regulatory support. Countries with strong vegan and flexitarian movements are leading in both consumption and production. Developed economies such as the USA (8.3% CAGR), UK (8.2%), and Japan (9.2%) are growing at 0.95-1.07x the global growth rate, while Germany and France (both at 8.5%) remain closely aligned with EU-wide food innovation and sustainability policies.

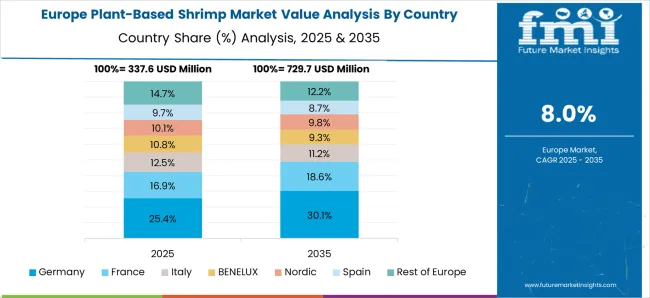
Japan is witnessing the strongest momentum in the market, fueled by innovation in seaweed-based products and rising demand for clean-label seafood alternatives. Germany follows, supported by EU labeling regulations and growth in private-label frozen and refrigerated shrimp.

France is seeing increased interest through national health campaigns and greater organic retail adoption. The USA market is being driven by e-commerce expansion and growing consumer awareness of mercury-free, sustainable protein sources. The UK, while slower in comparison, maintains steady demand through shelf-stable product formats and widespread retail distribution, supported by its mature vegan consumer base.

The report covers an in-depth analysis of 40+ countries; five top-performing OECD countries are highlighted below.

In-depth Analysis of Plant-Based Shrimp in Japan

The Japan plant-based shrimp market is growing at a CAGR of 9.2% from 2025 to 2035, outpacing the global average. Growth is driven by rising demand for seafood alternatives amid heightened environmental awareness and a robust vegan movement. With a cultural emphasis on seafood, Japan is experiencing strong investment in seaweed-based shrimp innovation and retail expansion. Local manufacturers are focusing on high-fidelity taste and texture using algae fermentation and sustainably sourced ingredients.
  • Seaweed-based shrimp innovations leading in retail and convenience channels.
  • High interest in clean-label and allergen-free seafood alternatives.

Growth Outlook for Plant-Based Shrimp in Germany

The Germany plant-based shrimp market is expected to expand at a CAGR of 8.5% during the forecast period, closely tracking global trends. EU-backed clean-label initiatives and a growing consumer shift toward meat-free diets are major growth drivers. Germany is emerging as a production hub for private-label plant-based seafood and is leveraging sustainable packaging and cold-chain innovations.

  • Strong consumer base for flexitarian and vegan diets.
  • Expansion of retail private labels in frozen and refrigerated shrimp.

Plant-Based Shrimp Demand in France

The French plant-based shrimp market is forecast to grow at a CAGR of 8.4% from 2025 to 2035, driven by national health campaigns and rising environmental awareness. French consumers are increasingly interested in seafood alternatives, with plant-based shrimp gaining traction in hypermarkets and organic retail channels. France is also witnessing growing interest from the foodservice sector, particularly in high-end vegan and seafood fusion menus.
  • Popularity rising in urban foodservice and organic retail chains.
  • Government support for plant-based protein production and labelling.

Demand Trajectory for Plant-Based Shrimp in the USA

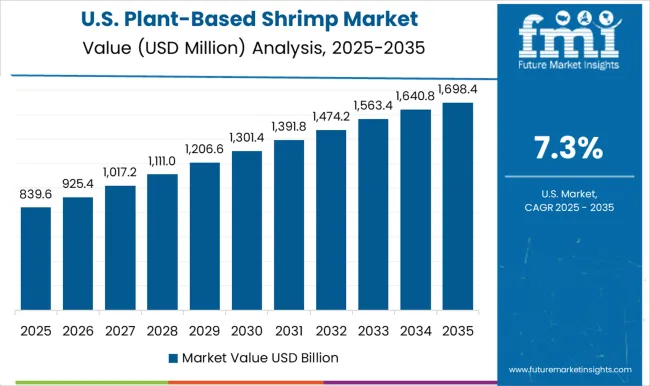
Sales of plant-based shrimp in the USA are projected to grow at a CAGR of 8.3% between 2025 and 2035, slightly below the global average. The market is driven by rapid innovation in alternative seafood and expanding retail distribution. Consumer preferences for cholesterol-free, sustainable protein sources are fueling demand. The presence of key players like Good Catch and New Wave Foods has accelerated product visibility.

  • E-commerce and mass grocery retail driving category penetration.
  • High consumer awareness of mercury-free seafood options.

Plant-Based Shrimp Trends in the UK

The UK plant-based shrimp market is forecast to expand at a CAGR of 8.2% during the forecast period, representing the slowest growth among leading OECD markets at 0.95x the global rate. Growth is supported by a mature vegan consumer base and rising demand for clean-label products. However, economic uncertainty and cautious consumer spending have limited broader foodservice adoption. Retail and specialty stores remain the key distribution channels.
  • Focus on price-accessible vegan seafood alternatives.
  • Rising interest in shelf-stable and frozen formats for convenience.

Leading Plant-Based Shrimp Suppliers and Manufacturers

Plant Based Shrimp Market Analysis By Company

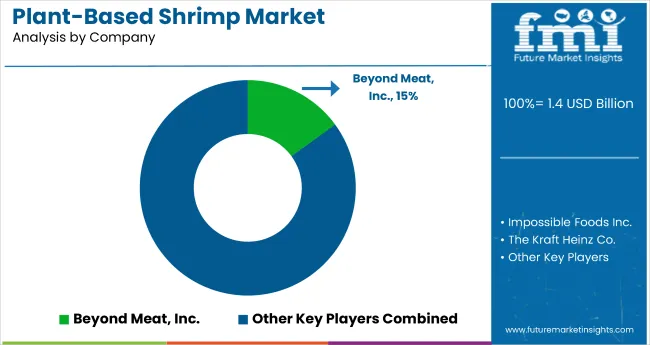
The global market is moderately consolidated, with leading players like Beyond Meat, Inc., Gathered Foods Corp., Maple Leaf Foods, Inc., Finless Foods, and Ocean Hunger Foods dominating the industry. These companies offer innovative, sustainable shrimp alternatives catering to consumers across retail, foodservice, and specialty health channels.

Beyond Meat, Inc. focuses on advanced plant protein development and clean-label shrimp analogs, while Gathered Foods Corp., through its Good Catch brand, specializes in shelf-stable and frozen seafood alternatives using proprietary legume blends.

Maple Leaf Foods, Inc. operates through its Greenleaf Foods division, offering high-quality vegan shrimp products. Finless Foods is pioneering cultivated seafood solutions, and Ocean Hunger Foods is known for algae-based shrimp with a focus on environmental sustainability.

The Vegetarian Butcher, The Kraft Heinz Co., Moving Mountains Foods, Monde Nissin Corp., and Tyson Foods, Inc. contribute to the market with global distribution capabilities and investments in R&D. Impossible Foods Inc., Van Cleve Seafood, Good Catch, and The Tofurky Co. Inc. also provide specialized, high-performance seafood alternatives for diverse dietary needs.

Plant-Based Shrimp Market Report Scope

Report Attributes Details
Market Size (2025) USD 1.4 billion
Projected Market Size (2035) USD 3.2 billion
CAGR (2025 to 2035) 8.6%
Base Year for Estimation 2024
Historical Period 2020 to 2024
Projections Period 2025 to 2035
Report Parameter USD billion for value/volume in metric tons
Source Analyzed Seaweed, Legume Protein, Plant-Based Omega 3, Soy Protein, Pea Protein, Others (Quinoa, Oats, Beans, and Seeds)
Segments Analyzed Frozen, Refrigerated, and Shelf-Stable
Product Type Analyzed Breaded Vegan Shrimp, Crunchy Coconut Shrimp, Crispy Vegan Shrimp, and Raw Vegan Shrimp
Distribution Channel Analyzed B2B, B2C [Store-based retailing (Hypermarkets/Supermarkets, Convenience Stores, Mass Grocery Retailers, Food and Drink Specialty Stores), and Online Retailing]
End-Use Analyzed Food Service Industry, Household, and Retail
Application Analyzed Pharmaceutical and Clinical Trials
Regions Covered North America, Latin America, Europe, East Asia, South Asia and Pacific, Middle East and Africa
Countries Covered United States, United Kingdom, Germany, France, Japan, China, India, Brazil, South Korea, Australia and 40+ countries
Key Players Influencing the Market Beyond Meat, Inc., Gathered Foods Corp., Maple Leaf Foods, Inc., Finless Foods, Ocean Hunger Foods, The Vegetarian Butcher, The Kraft Heinz Co., Moving Mountains Foods, Monde Nissin Corp., Tyson Foods, Inc., Impossible Foods Inc., Van Cleve Seafood, Good Catch, The Tofurky Co. Inc.
Additional Attributes Volume and dollar sales by product type, retail and foodservice penetration, clean-label trends, sustainability regulations, ingredient innovations, competitive benchmarking

Key Segments

By Source:

  • Seaweed
  • Legume Protein
  • Plant Based omega 3
  • Soy Protein
  • Pea Protein
  • Others (quinoa, oats, beans and seeds)

By Segments:

  • Frozen plant based Shrimp
  • Refrigerated plant based shrimp
  • Shelf stable plant based shrimp

By Product type:

  • Breaded Vegan Shrimp
  • Crunchy Coconut Shrimp
  • Crispy Vegan Shrimp
  • Raw Vegan Shrimp

By Distribution channel:

  • B2B
  • B2C
    • Store- based retailing
      • Hypermarkets/Supermarkets
      • Convenience Stores
      • Mass Grocery Retailers
      • Food and Drink Specialty Stores
    • Online retailing

By End-Use:

  • Food Service Industry
  • Household
  • Retail

By Region:

  • North America
  • Latin America
  • Western Europe
  • Eastern Europe
  • East Asia
  • South Asia & Pacific
  • Middle East and Africa

Table of Content

  1. Executive Summary
    • Global Market Outlook
    • Demand-side Trends
    • Supply-side Trends
    • Technology Roadmap Analysis
    • Analysis and Recommendations
  2. Market Overview
    • Market Coverage / Taxonomy
    • Market Definition / Scope / Limitations
  3. Market Background
    • Market Dynamics
      • Drivers
      • Restraints
      • Opportunity
      • Trends
    • Scenario Forecast
      • Demand in Optimistic Scenario
      • Demand in Likely Scenario
      • Demand in Conservative Scenario
    • Opportunity Map Analysis
    • Product Life Cycle Analysis
    • Supply Chain Analysis
      • Supply Side Participants and their Roles
        • Producers
        • Mid-Level Participants (Traders/ Agents/ Brokers)
        • Wholesalers and Distributors
      • Value Added and Value Created at Node in the Supply Chain
      • List of Raw Material Suppliers
      • List of Existing and Potential Buyer’s
    • Investment Feasibility Matrix
    • Value Chain Analysis
      • Profit Margin Analysis
      • Wholesalers and Distributors
      • Retailers
    • PESTLE and Porter’s Analysis
    • Regulatory Landscape
      • By Key Regions
      • By Key Countries
    • Regional Parent Market Outlook
    • Production and Consumption Statistics
    • Import and Export Statistics
  4. Global Market Analysis 2020 to 2024 and Forecast, 2025 to 2035
    • Historical Market Size Value (USD Billion) & Volume (Metric Tons) Analysis, 2020 to 2024
    • Current and Future Market Size Value (USD Billion) & Volume (Metric Tons) Projections, 2025 to 2035
      • Y-o-Y Growth Trend Analysis
      • Absolute $ Opportunity Analysis
  5. Global Market Pricing Analysis 2020 to 2024 and Forecast 2025 to 2035
  6. Global Market Analysis 2020 to 2024 and Forecast 2025 to 2035, By Source
    • Introduction / Key Findings
    • Historical Market Size Value (USD Billion) & Volume (Metric Tons) Analysis By Source, 2020 to 2024
    • Current and Future Market Size Value (USD Billion) & Volume (Metric Tons) Analysis and Forecast By Source, 2025 to 2035
      • Seaweed
      • Legume Protein
      • Plant Based Omega 3
      • Soy Protein
      • Pea Protein
      • Others (Quinoa, Oats, Beans, Seeds)
    • Y-o-Y Growth Trend Analysis By Source, 2020 to 2024
    • Absolute $ Opportunity Analysis By Source, 2025 to 2035
  7. Global Market Analysis 2020 to 2024 and Forecast 2025 to 2035, By Segments
    • Introduction / Key Findings
    • Historical Market Size Value (USD Billion) & Volume (Metric Tons) Analysis By Segments, 2020 to 2024
    • Current and Future Market Size Value (USD Billion) & Volume (Metric Tons) Analysis and Forecast By Segments, 2025 to 2035
      • Frozen Plant Based Shrimp
      • Refrigerated Plant Based Shrimp
      • Shelf Stable Plant Based Shrimp
    • Y-o-Y Growth Trend Analysis By Segments, 2020 to 2024
    • Absolute $ Opportunity Analysis By Segments, 2025 to 2035
  8. Global Market Analysis 2020 to 2024 and Forecast 2025 to 2035, By Product Type
    • Introduction / Key Findings
    • Historical Market Size Value (USD Billion) & Volume (Metric Tons) Analysis By Product Type, 2020 to 2024
    • Current and Future Market Size Value (USD Billion) & Volume (Metric Tons) Analysis and Forecast By Product Type, 2025 to 2035
      • Breaded Vegan Shrimp
      • Crunchy Coconut Shrimp
      • Crispy Vegan Shrimp
      • Raw Vegan Shrimp
    • Y-o-Y Growth Trend Analysis By Product Type, 2020 to 2024
    • Absolute $ Opportunity Analysis By Product Type, 2025 to 2035
  9. Global Market Analysis 2020 to 2024 and Forecast 2025 to 2035, By Distribution Channel
    • Introduction / Key Findings
    • Historical Market Size Value (USD Billion) & Volume (Metric Tons) Analysis By Distribution Channel, 2020 to 2024
    • Current and Future Market Size Value (USD Billion) & Volume (Metric Tons) Analysis and Forecast By Distribution Channel, 2025 to 2035
      • B2B
      • B2C
        • Store-based retailing
        • Hypermarkets/Supermarkets
        • Convenience Stores
        • Mass Grocery Retailers
        • Food and Drink Specialty Stores
      • Online retailing
    • Y-o-Y Growth Trend Analysis By Distribution Channel, 2020 to 2024
    • Absolute $ Opportunity Analysis By Distribution Channel, 2025 to 2035
  10. Global Market Analysis 2020 to 2024 and Forecast 2025 to 2035, By End-Use
    • Introduction / Key Findings
    • Historical Market Size Value (USD Billion) & Volume (Metric Tons) Analysis By End-Use, 2020 to 2024
    • Current and Future Market Size Value (USD Billion) & Volume (Metric Tons) Analysis and Forecast By End-Use, 2025 to 2035
      • Food Service Industry
      • Household
      • Retail
    • Y-o-Y Growth Trend Analysis By End-Use, 2020 to 2024
    • Absolute $ Opportunity Analysis By End-Use, 2025 to 2035
  11. Global Market Analysis 2020 to 2024 and Forecast 2025 to 2035, By Application
    • Introduction / Key Findings
    • Historical Market Size Value (USD Billion) & Volume (Metric Tons) Analysis By Application, 2020 to 2024
    • Current and Future Market Size Value (USD Billion) & Volume (Metric Tons) Analysis and Forecast By Application, 2025 to 2035
      • Pharmaceutical
      • Clinical Trials
    • Y-o-Y Growth Trend Analysis By Application, 2020 to 2024
    • Absolute $ Opportunity Analysis By Application, 2025 to 2035
  12. Global Market Analysis 2020 to 2024 and Forecast 2025 to 2035, By Region
    • Introduction
    • Historical Market Size Value (USD Billion) & Volume (Metric Tons) Analysis By Region, 2020 to 2024
    • Current Market Size Value (USD Billion) & Volume (Metric Tons) Analysis and Forecast By Region, 2025 to 2035
      • North America
      • Latin America
      • Western Europe
      • Eastern Europe
      • East Asia
      • South Asia & Pacific
      • Middle East and Africa
    • Market Attractiveness Analysis By Region
  13. North America Market Analysis 2020 to 2024 and Forecast 2025 to 2035, By Country
    • Historical Market Size Value (USD Billion) & Volume (Metric Tons) Trend Analysis By Market Taxonomy, 2020 to 2024
    • Market Size Value (USD Billion) & Volume (Metric Tons) Forecast By Market Taxonomy, 2025 to 2035
      • By Country
        • USA
        • Canada
        • Mexico
      • By Source
      • By Segments
      • By Product Type
      • By Distribution Channel
      • By End-Use
      • By Application
    • Market Attractiveness Analysis
      • By Country
      • By Source
      • By Segments
      • By Product Type
      • By Distribution Channel
      • By End-Use
      • By Application
    • Key Takeaways
  14. Latin America Market Analysis 2020 to 2024 and Forecast 2025 to 2035, By Country
    • Historical Market Size Value (USD Billion) & Volume (Metric Tons) Trend Analysis By Market Taxonomy, 2020 to 2024
    • Market Size Value (USD Billion) & Volume (Metric Tons) Forecast By Market Taxonomy, 2025 to 2035
      • By Country
        • Brazil
        • Argentina
        • Rest of LATAM
      • By Source
      • By Segments
      • By Product Type
      • By Distribution Channel
      • By End-Use
      • By Application
    • Market Attractiveness Analysis
      • By Country
      • By Source
      • By Segments
      • By Product Type
      • By Distribution Channel
      • By End-Use
      • By Application
    • Key Takeaways
  15. Western Europe Market Analysis 2020 to 2024 and Forecast 2025 to 2035, By Country
    • Historical Market Size Value (USD Billion) & Volume (Metric Tons) Trend Analysis By Market Taxonomy, 2020 to 2024
    • Market Size Value (USD Billion) & Volume (Metric Tons) Forecast By Market Taxonomy, 2025 to 2035
      • By Country
        • Germany
        • Italy
        • France
        • UK
        • Spain
        • BENELUX
        • Nordic
        • Rest of W.Europe
      • By Source
      • By Segments
      • By Product Type
      • By Distribution Channel
      • By End-Use
      • By Application
    • Market Attractiveness Analysis
      • By Country
      • By Source
      • By Segments
      • By Product Type
      • By Distribution Channel
      • By End-Use
      • By Application
    • Key Takeaways
  16. Eastern Europe Market Analysis 2020 to 2024 and Forecast 2025 to 2035, By Country
    • Historical Market Size Value (USD Billion) & Volume (Metric Tons) Trend Analysis By Market Taxonomy, 2020 to 2024
    • Market Size Value (USD Billion) & Volume (Metric Tons) Forecast By Market Taxonomy, 2025 to 2035
      • By Country
        • Russia
        • Hungary
        • Poland
        • Balkan & Baltics
        • Rest of E. Europe
      • By Source
      • By Segments
      • By Product Type
      • By Distribution Channel
      • By End-Use
      • By Application
    • Market Attractiveness Analysis
      • By Country
      • By Source
      • By Segments
      • By Product Type
      • By Distribution Channel
      • By End-Use
      • By Application
    • Key Takeaways
  17. East Asia Market Analysis 2020 to 2024 and Forecast 2025 to 2035, By Country
    • Historical Market Size Value (USD Billion) & Volume (Metric Tons) Trend Analysis By Market Taxonomy, 2020 to 2024
    • Market Size Value (USD Billion) & Volume (Metric Tons) Forecast By Market Taxonomy, 2025 to 2035
      • By Country
        • China
        • Japan
        • South Korea
      • By Source
      • By Segments
      • By Product Type
      • By Distribution Channel
      • By End-Use
      • By Application
    • Market Attractiveness Analysis
      • By Country
      • By Source
      • By Segments
      • By Product Type
      • By Distribution Channel
      • By End-Use
      • By Application
    • Key Takeaways
  18. South Asia & Pacific Market Analysis 2020 to 2024 and Forecast 2025 to 2035, By Country
    • Historical Market Size Value (USD Billion) & Volume (Metric Tons) Trend Analysis By Market Taxonomy, 2020 to 2024
    • Market Size Value (USD Billion) & Volume (Metric Tons) Forecast By Market Taxonomy, 2025 to 2035
      • By Country
        • India
        • Australia & New Zealand
        • ASEAN
        • Rest of SAP
      • By Source
      • By Segments
      • By Product Type
      • By Distribution Channel
      • By End-Use
      • By Application
    • Market Attractiveness Analysis
      • By Country
      • By Source
      • By Segments
      • By Product Type
      • By Distribution Channel
      • By End-Use
      • By Application
    • Key Takeaways
  19. Middle East and Africa Market Analysis 2020 to 2024 and Forecast 2025 to 2035, By Country
    • Historical Market Size Value (USD Billion) & Volume (Metric Tons) Trend Analysis By Market Taxonomy, 2020 to 2024
    • Market Size Value (USD Billion) & Volume (Metric Tons) Forecast By Market Taxonomy, 2025 to 2035
      • By Country
        • GCC Countries
        • Northern Africa
        • South Africa
        • Turkiye
        • Rest of MEA
      • By Source
      • By Segments
      • By Product Type
      • By Distribution Channel
      • By End-Use
      • By Application
    • Market Attractiveness Analysis
      • By Country
      • By Source
      • By Segments
      • By Product Type
      • By Distribution Channel
      • By End-Use
      • By Application
    • Key Takeaways
  20. Key Countries Market Analysis
    • USA
      • Pricing Analysis
      • Market Share Analysis, 2024
        • By Source
        • By Segments
        • By Product Type
        • By Distribution Channel
        • By End-Use
        • By Application
    • Canada
      • Pricing Analysis
      • Market Share Analysis, 2024
        • By Source
        • By Segments
        • By Product Type
        • By Distribution Channel
        • By End-Use
        • By Application
    • Brazil
      • Pricing Analysis
      • Market Share Analysis, 2024
        • By Source
        • By Segments
        • By Product Type
        • By Distribution Channel
        • By End-Use
        • By Application
    • Mexico
      • Pricing Analysis
      • Market Share Analysis, 2024
        • By Source
        • By Segments
        • By Product Type
        • By Distribution Channel
        • By End-Use
        • By Application
    • Argentina
      • Pricing Analysis
      • Market Share Analysis, 2024
        • By Source
        • By Segments
        • By Product Type
        • By Distribution Channel
        • By End-Use
        • By Application
  21. Market Structure Analysis
    • Competition Dashboard
    • Competition Benchmarking
    • Market Share Analysis of Top Players
      • By Regional
      • By Source
      • By Segments
      • By Product Type
      • By Distribution Channel
      • By End-Use
      • By Application
  22. Competition Analysis
    • Competition Deep Dive
      • Beyond Meat, Inc.
        • Overview
        • Product Portfolio
        • Profitability by Market Segments (Product/Age /Sales Channel/Region)
        • Sales Footprint
        • Strategy Overview
          • Marketing Strategy
          • Product Strategy
          • Channel Strategy
      • Gathered Foods Corp.
        • Overview
        • Product Portfolio
        • Profitability by Market Segments (Product/Age /Sales Channel/Region)
        • Sales Footprint
        • Strategy Overview
          • Marketing Strategy
          • Product Strategy
          • Channel Strategy
      • Maple Leaf Foods, Inc.
        • Overview
        • Product Portfolio
        • Profitability by Market Segments (Product/Age /Sales Channel/Region)
        • Sales Footprint
        • Strategy Overview
          • Marketing Strategy
          • Product Strategy
          • Channel Strategy
      • Finless Foods
        • Overview
        • Product Portfolio
        • Profitability by Market Segments (Product/Age /Sales Channel/Region)
        • Sales Footprint
        • Strategy Overview
          • Marketing Strategy
          • Product Strategy
          • Channel Strategy
      • Ocean Hunger Foods
        • Overview
        • Product Portfolio
        • Profitability by Market Segments (Product/Age /Sales Channel/Region)
        • Sales Footprint
        • Strategy Overview
          • Marketing Strategy
          • Product Strategy
          • Channel Strategy
      • The Vegetarian Butcher
        • Overview
        • Product Portfolio
        • Profitability by Market Segments (Product/Age /Sales Channel/Region)
        • Sales Footprint
        • Strategy Overview
          • Marketing Strategy
          • Product Strategy
          • Channel Strategy
      • The Kraft Heinz Co.
        • Overview
        • Product Portfolio
        • Profitability by Market Segments (Product/Age /Sales Channel/Region)
        • Sales Footprint
        • Strategy Overview
          • Marketing Strategy
          • Product Strategy
          • Channel Strategy
      • Moving Mountains Foods
        • Overview
        • Product Portfolio
        • Profitability by Market Segments (Product/Age /Sales Channel/Region)
        • Sales Footprint
        • Strategy Overview
          • Marketing Strategy
          • Product Strategy
          • Channel Strategy
      • Monde Nissin Corp.
        • Overview
        • Product Portfolio
        • Profitability by Market Segments (Product/Age /Sales Channel/Region)
        • Sales Footprint
        • Strategy Overview
          • Marketing Strategy
          • Product Strategy
          • Channel Strategy
      • Tyson Foods, Inc.
        • Overview
        • Product Portfolio
        • Profitability by Market Segments (Product/Age /Sales Channel/Region)
        • Sales Footprint
        • Strategy Overview
          • Marketing Strategy
          • Product Strategy
          • Channel Strategy
      • Impossible Foods Inc.
        • Overview
        • Product Portfolio
        • Profitability by Market Segments (Product/Age /Sales Channel/Region)
        • Sales Footprint
        • Strategy Overview
          • Marketing Strategy
          • Product Strategy
          • Channel Strategy
      • Van Cleve Seafood
        • Overview
        • Product Portfolio
        • Profitability by Market Segments (Product/Age /Sales Channel/Region)
        • Sales Footprint
        • Strategy Overview
          • Marketing Strategy
          • Product Strategy
          • Channel Strategy
      • Good Catch
        • Overview
        • Product Portfolio
        • Profitability by Market Segments (Product/Age /Sales Channel/Region)
        • Sales Footprint
        • Strategy Overview
          • Marketing Strategy
          • Product Strategy
          • Channel Strategy
      • The Tofurky Co. Inc.
        • Overview
        • Product Portfolio
        • Profitability by Market Segments (Product/Age /Sales Channel/Region)
        • Sales Footprint
        • Strategy Overview
          • Marketing Strategy
          • Product Strategy
          • Channel Strategy
  23. Assumptions & Acronyms Used
  24. Research Methodology

List of Tables

  • Table 1: Global Market Value (USD Billion) Forecast by Region, 2020-2035
  • Table 2: Global Market Volume (Metric Tons) Forecast by Region, 2020-2035
  • Table 3: Global Market Value (USD Billion) Forecast by Source, 2020-2035
  • Table 4: Global Market Volume (Metric Tons) Forecast by Source, 2020-2035
  • Table 5: Global Market Value (USD Billion) Forecast by Segments, 2020-2035
  • Table 6: Global Market Volume (Metric Tons) Forecast by Segments, 2020-2035
  • Table 7: Global Market Value (USD Billion) Forecast by Product Type, 2020-2035
  • Table 8: Global Market Volume (Metric Tons) Forecast by Product Type, 2020-2035
  • Table 9: Global Market Value (USD Billion) Forecast by Distribution Channel, 2020-2035
  • Table 10: Global Market Volume (Metric Tons) Forecast by Distribution Channel, 2020-2035
  • Table 11: Global Market Value (USD Billion) Forecast by End-Use, 2020-2035
  • Table 12: Global Market Volume (Metric Tons) Forecast by End-Use, 2020-2035
  • Table 13: Global Market Value (USD Billion) Forecast by Application, 2020-2035
  • Table 14: Global Market Volume (Metric Tons) Forecast by Application, 2020-2035
  • Table 15: North America Market Value (USD Billion) Forecast by Country, 2020-2035
  • Table 16: North America Market Volume (Metric Tons) Forecast by Country, 2020-2035
  • Table 17: North America Market Value (USD Billion) Forecast by Source, 2020-2035
  • Table 18: North America Market Volume (Metric Tons) Forecast by Source, 2020-2035
  • Table 19: North America Market Value (USD Billion) Forecast by Segments, 2020-2035
  • Table 20: North America Market Volume (Metric Tons) Forecast by Segments, 2020-2035
  • Table 21: North America Market Value (USD Billion) Forecast by Product Type, 2020-2035
  • Table 22: North America Market Volume (Metric Tons) Forecast by Product Type, 2020-2035
  • Table 23: North America Market Value (USD Billion) Forecast by Distribution Channel, 2020-2035
  • Table 24: North America Market Volume (Metric Tons) Forecast by Distribution Channel, 2020-2035
  • Table 25: North America Market Value (USD Billion) Forecast by End-Use, 2020-2035
  • Table 26: North America Market Volume (Metric Tons) Forecast by End-Use, 2020-2035
  • Table 27: North America Market Value (USD Billion) Forecast by Application, 2020-2035
  • Table 28: North America Market Volume (Metric Tons) Forecast by Application, 2020-2035
  • Table 29: Latin America Market Value (USD Billion) Forecast by Country, 2020-2035
  • Table 30: Latin America Market Volume (Metric Tons) Forecast by Country, 2020-2035
  • Table 31: Latin America Market Value (USD Billion) Forecast by Source, 2020-2035
  • Table 32: Latin America Market Volume (Metric Tons) Forecast by Source, 2020-2035
  • Table 33: Latin America Market Value (USD Billion) Forecast by Segments, 2020-2035
  • Table 34: Latin America Market Volume (Metric Tons) Forecast by Segments, 2020-2035
  • Table 35: Latin America Market Value (USD Billion) Forecast by Product Type, 2020-2035
  • Table 36: Latin America Market Volume (Metric Tons) Forecast by Product Type, 2020-2035
  • Table 37: Latin America Market Value (USD Billion) Forecast by Distribution Channel, 2020-2035
  • Table 38: Latin America Market Volume (Metric Tons) Forecast by Distribution Channel, 2020-2035
  • Table 39: Latin America Market Value (USD Billion) Forecast by End-Use, 2020-2035
  • Table 40: Latin America Market Volume (Metric Tons) Forecast by End-Use, 2020-2035
  • Table 41: Latin America Market Value (USD Billion) Forecast by Application, 2020-2035
  • Table 42: Latin America Market Volume (Metric Tons) Forecast by Application, 2020-2035
  • Table 43: Western Europe Market Value (USD Billion) Forecast by Country, 2020-2035
  • Table 44: Western Europe Market Volume (Metric Tons) Forecast by Country, 2020-2035
  • Table 45: Western Europe Market Value (USD Billion) Forecast by Source, 2020-2035
  • Table 46: Western Europe Market Volume (Metric Tons) Forecast by Source, 2020-2035
  • Table 47: Western Europe Market Value (USD Billion) Forecast by Segments, 2020-2035
  • Table 48: Western Europe Market Volume (Metric Tons) Forecast by Segments, 2020-2035
  • Table 49: Western Europe Market Value (USD Billion) Forecast by Product Type, 2020-2035
  • Table 50: Western Europe Market Volume (Metric Tons) Forecast by Product Type, 2020-2035
  • Table 51: Western Europe Market Value (USD Billion) Forecast by Distribution Channel, 2020-2035
  • Table 52: Western Europe Market Volume (Metric Tons) Forecast by Distribution Channel, 2020-2035
  • Table 53: Western Europe Market Value (USD Billion) Forecast by End-Use, 2020-2035
  • Table 54: Western Europe Market Volume (Metric Tons) Forecast by End-Use, 2020-2035
  • Table 55: Western Europe Market Value (USD Billion) Forecast by Application, 2020-2035
  • Table 56: Western Europe Market Volume (Metric Tons) Forecast by Application, 2020-2035
  • Table 57: Eastern Europe Market Value (USD Billion) Forecast by Country, 2020-2035
  • Table 58: Eastern Europe Market Volume (Metric Tons) Forecast by Country, 2020-2035
  • Table 59: Eastern Europe Market Value (USD Billion) Forecast by Source, 2020-2035
  • Table 60: Eastern Europe Market Volume (Metric Tons) Forecast by Source, 2020-2035
  • Table 61: Eastern Europe Market Value (USD Billion) Forecast by Segments, 2020-2035
  • Table 62: Eastern Europe Market Volume (Metric Tons) Forecast by Segments, 2020-2035
  • Table 63: Eastern Europe Market Value (USD Billion) Forecast by Product Type, 2020-2035
  • Table 64: Eastern Europe Market Volume (Metric Tons) Forecast by Product Type, 2020-2035
  • Table 65: Eastern Europe Market Value (USD Billion) Forecast by Distribution Channel, 2020-2035
  • Table 66: Eastern Europe Market Volume (Metric Tons) Forecast by Distribution Channel, 2020-2035
  • Table 67: Eastern Europe Market Value (USD Billion) Forecast by End-Use, 2020-2035
  • Table 68: Eastern Europe Market Volume (Metric Tons) Forecast by End-Use, 2020-2035
  • Table 69: Eastern Europe Market Value (USD Billion) Forecast by Application, 2020-2035
  • Table 70: Eastern Europe Market Volume (Metric Tons) Forecast by Application, 2020-2035
  • Table 71: East Asia Market Value (USD Billion) Forecast by Country, 2020-2035
  • Table 72: East Asia Market Volume (Metric Tons) Forecast by Country, 2020-2035
  • Table 73: East Asia Market Value (USD Billion) Forecast by Source, 2020-2035
  • Table 74: East Asia Market Volume (Metric Tons) Forecast by Source, 2020-2035
  • Table 75: East Asia Market Value (USD Billion) Forecast by Segments, 2020-2035
  • Table 76: East Asia Market Volume (Metric Tons) Forecast by Segments, 2020-2035
  • Table 77: East Asia Market Value (USD Billion) Forecast by Product Type, 2020-2035
  • Table 78: East Asia Market Volume (Metric Tons) Forecast by Product Type, 2020-2035
  • Table 79: East Asia Market Value (USD Billion) Forecast by Distribution Channel, 2020-2035
  • Table 80: East Asia Market Volume (Metric Tons) Forecast by Distribution Channel, 2020-2035
  • Table 81: East Asia Market Value (USD Billion) Forecast by End-Use, 2020-2035
  • Table 82: East Asia Market Volume (Metric Tons) Forecast by End-Use, 2020-2035
  • Table 83: East Asia Market Value (USD Billion) Forecast by Application, 2020-2035
  • Table 84: East Asia Market Volume (Metric Tons) Forecast by Application, 2020-2035
  • Table 85: South Asia & Pacific Market Value (USD Billion) Forecast by Country, 2020-2035
  • Table 86: South Asia & Pacific Market Volume (Metric Tons) Forecast by Country, 2020-2035
  • Table 87: South Asia & Pacific Market Value (USD Billion) Forecast by Source, 2020-2035
  • Table 88: South Asia & Pacific Market Volume (Metric Tons) Forecast by Source, 2020-2035
  • Table 89: South Asia & Pacific Market Value (USD Billion) Forecast by Segments, 2020-2035
  • Table 90: South Asia & Pacific Market Volume (Metric Tons) Forecast by Segments, 2020-2035
  • Table 91: South Asia & Pacific Market Value (USD Billion) Forecast by Product Type, 2020-2035
  • Table 92: South Asia & Pacific Market Volume (Metric Tons) Forecast by Product Type, 2020-2035
  • Table 93: South Asia & Pacific Market Value (USD Billion) Forecast by Distribution Channel, 2020-2035
  • Table 94: South Asia & Pacific Market Volume (Metric Tons) Forecast by Distribution Channel, 2020-2035
  • Table 95: South Asia & Pacific Market Value (USD Billion) Forecast by End-Use, 2020-2035
  • Table 96: South Asia & Pacific Market Volume (Metric Tons) Forecast by End-Use, 2020-2035
  • Table 97: South Asia & Pacific Market Value (USD Billion) Forecast by Application, 2020-2035
  • Table 98: South Asia & Pacific Market Volume (Metric Tons) Forecast by Application, 2020-2035
  • Table 99: Middle East and Africa Market Value (USD Billion) Forecast by Country, 2020-2035
  • Table 100: Middle East and Africa Market Volume (Metric Tons) Forecast by Country, 2020-2035
  • Table 101: Middle East and Africa Market Value (USD Billion) Forecast by Source, 2020-2035
  • Table 102: Middle East and Africa Market Volume (Metric Tons) Forecast by Source, 2020-2035
  • Table 103: Middle East and Africa Market Value (USD Billion) Forecast by Segments, 2020-2035
  • Table 104: Middle East and Africa Market Volume (Metric Tons) Forecast by Segments, 2020-2035
  • Table 105: Middle East and Africa Market Value (USD Billion) Forecast by Product Type, 2020-2035
  • Table 106: Middle East and Africa Market Volume (Metric Tons) Forecast by Product Type, 2020-2035
  • Table 107: Middle East and Africa Market Value (USD Billion) Forecast by Distribution Channel, 2020-2035
  • Table 108: Middle East and Africa Market Volume (Metric Tons) Forecast by Distribution Channel, 2020-2035
  • Table 109: Middle East and Africa Market Value (USD Billion) Forecast by End-Use, 2020-2035
  • Table 110: Middle East and Africa Market Volume (Metric Tons) Forecast by End-Use, 2020-2035
  • Table 111: Middle East and Africa Market Value (USD Billion) Forecast by Application, 2020-2035
  • Table 112: Middle East and Africa Market Volume (Metric Tons) Forecast by Application, 2020-2035

List of Figures

  • Figure 1: Global Market Volume (Metric Tons) Forecast 2020-2035
  • Figure 2: Global Market Pricing Analysis
  • Figure 3: Global Market Value (USD Billion) Forecast 2020-2035
  • Figure 4: Global Market Value Share and BPS Analysis by Source, 2025 and 2035
  • Figure 5: Global Market Y-o-Y Growth Comparison by Source, 2025-2035
  • Figure 6: Global Market Attractiveness Analysis by Source
  • Figure 7: Global Market Value Share and BPS Analysis by Segments, 2025 and 2035
  • Figure 8: Global Market Y-o-Y Growth Comparison by Segments, 2025-2035
  • Figure 9: Global Market Attractiveness Analysis by Segments
  • Figure 10: Global Market Value Share and BPS Analysis by Product Type, 2025 and 2035
  • Figure 11: Global Market Y-o-Y Growth Comparison by Product Type, 2025-2035
  • Figure 12: Global Market Attractiveness Analysis by Product Type
  • Figure 13: Global Market Value Share and BPS Analysis by Distribution Channel, 2025 and 2035
  • Figure 14: Global Market Y-o-Y Growth Comparison by Distribution Channel, 2025-2035
  • Figure 15: Global Market Attractiveness Analysis by Distribution Channel
  • Figure 16: Global Market Value Share and BPS Analysis by End-Use, 2025 and 2035
  • Figure 17: Global Market Y-o-Y Growth Comparison by End-Use, 2025-2035
  • Figure 18: Global Market Attractiveness Analysis by End-Use
  • Figure 19: Global Market Value Share and BPS Analysis by Application, 2025 and 2035
  • Figure 20: Global Market Y-o-Y Growth Comparison by Application, 2025-2035
  • Figure 21: Global Market Attractiveness Analysis by Application
  • Figure 22: Global Market Value (USD Billion) Share and BPS Analysis by Region, 2025 and 2035
  • Figure 23: Global Market Y-o-Y Growth Comparison by Region, 2025-2035
  • Figure 24: Global Market Attractiveness Analysis by Region
  • Figure 25: North America Market Incremental $ Opportunity, 2025-2035
  • Figure 26: Latin America Market Incremental $ Opportunity, 2025-2035
  • Figure 27: Western Europe Market Incremental $ Opportunity, 2025-2035
  • Figure 28: Eastern Europe Market Incremental $ Opportunity, 2025-2035
  • Figure 29: East Asia Market Incremental $ Opportunity, 2025-2035
  • Figure 30: South Asia & Pacific Market Incremental $ Opportunity, 2025-2035
  • Figure 31: Middle East and Africa Market Incremental $ Opportunity, 2025-2035
  • Figure 32: North America Market Value Share and BPS Analysis by Country, 2025 and 2035
  • Figure 33: North America Market Value Share and BPS Analysis by Source, 2025 and 2035
  • Figure 34: North America Market Y-o-Y Growth Comparison by Source, 2025-2035
  • Figure 35: North America Market Attractiveness Analysis by Source
  • Figure 36: North America Market Value Share and BPS Analysis by Segments, 2025 and 2035
  • Figure 37: North America Market Y-o-Y Growth Comparison by Segments, 2025-2035
  • Figure 38: North America Market Attractiveness Analysis by Segments
  • Figure 39: North America Market Value Share and BPS Analysis by Product Type, 2025 and 2035
  • Figure 40: North America Market Y-o-Y Growth Comparison by Product Type, 2025-2035
  • Figure 41: North America Market Attractiveness Analysis by Product Type
  • Figure 42: North America Market Value Share and BPS Analysis by Distribution Channel, 2025 and 2035
  • Figure 43: North America Market Y-o-Y Growth Comparison by Distribution Channel, 2025-2035
  • Figure 44: North America Market Attractiveness Analysis by Distribution Channel
  • Figure 45: North America Market Value Share and BPS Analysis by End-Use, 2025 and 2035
  • Figure 46: North America Market Y-o-Y Growth Comparison by End-Use, 2025-2035
  • Figure 47: North America Market Attractiveness Analysis by End-Use
  • Figure 48: North America Market Value Share and BPS Analysis by Application, 2025 and 2035
  • Figure 49: North America Market Y-o-Y Growth Comparison by Application, 2025-2035
  • Figure 50: North America Market Attractiveness Analysis by Application
  • Figure 51: Latin America Market Value Share and BPS Analysis by Country, 2025 and 2035
  • Figure 52: Latin America Market Value Share and BPS Analysis by Source, 2025 and 2035
  • Figure 53: Latin America Market Y-o-Y Growth Comparison by Source, 2025-2035
  • Figure 54: Latin America Market Attractiveness Analysis by Source
  • Figure 55: Latin America Market Value Share and BPS Analysis by Segments, 2025 and 2035
  • Figure 56: Latin America Market Y-o-Y Growth Comparison by Segments, 2025-2035
  • Figure 57: Latin America Market Attractiveness Analysis by Segments
  • Figure 58: Latin America Market Value Share and BPS Analysis by Product Type, 2025 and 2035
  • Figure 59: Latin America Market Y-o-Y Growth Comparison by Product Type, 2025-2035
  • Figure 60: Latin America Market Attractiveness Analysis by Product Type
  • Figure 61: Latin America Market Value Share and BPS Analysis by Distribution Channel, 2025 and 2035
  • Figure 62: Latin America Market Y-o-Y Growth Comparison by Distribution Channel, 2025-2035
  • Figure 63: Latin America Market Attractiveness Analysis by Distribution Channel
  • Figure 64: Latin America Market Value Share and BPS Analysis by End-Use, 2025 and 2035
  • Figure 65: Latin America Market Y-o-Y Growth Comparison by End-Use, 2025-2035
  • Figure 66: Latin America Market Attractiveness Analysis by End-Use
  • Figure 67: Latin America Market Value Share and BPS Analysis by Application, 2025 and 2035
  • Figure 68: Latin America Market Y-o-Y Growth Comparison by Application, 2025-2035
  • Figure 69: Latin America Market Attractiveness Analysis by Application
  • Figure 70: Western Europe Market Value Share and BPS Analysis by Country, 2025 and 2035
  • Figure 71: Western Europe Market Value Share and BPS Analysis by Source, 2025 and 2035
  • Figure 72: Western Europe Market Y-o-Y Growth Comparison by Source, 2025-2035
  • Figure 73: Western Europe Market Attractiveness Analysis by Source
  • Figure 74: Western Europe Market Value Share and BPS Analysis by Segments, 2025 and 2035
  • Figure 75: Western Europe Market Y-o-Y Growth Comparison by Segments, 2025-2035
  • Figure 76: Western Europe Market Attractiveness Analysis by Segments
  • Figure 77: Western Europe Market Value Share and BPS Analysis by Product Type, 2025 and 2035
  • Figure 78: Western Europe Market Y-o-Y Growth Comparison by Product Type, 2025-2035
  • Figure 79: Western Europe Market Attractiveness Analysis by Product Type
  • Figure 80: Western Europe Market Value Share and BPS Analysis by Distribution Channel, 2025 and 2035
  • Figure 81: Western Europe Market Y-o-Y Growth Comparison by Distribution Channel, 2025-2035
  • Figure 82: Western Europe Market Attractiveness Analysis by Distribution Channel
  • Figure 83: Western Europe Market Value Share and BPS Analysis by End-Use, 2025 and 2035
  • Figure 84: Western Europe Market Y-o-Y Growth Comparison by End-Use, 2025-2035
  • Figure 85: Western Europe Market Attractiveness Analysis by End-Use
  • Figure 86: Western Europe Market Value Share and BPS Analysis by Application, 2025 and 2035
  • Figure 87: Western Europe Market Y-o-Y Growth Comparison by Application, 2025-2035
  • Figure 88: Western Europe Market Attractiveness Analysis by Application
  • Figure 89: Eastern Europe Market Value Share and BPS Analysis by Country, 2025 and 2035
  • Figure 90: Eastern Europe Market Value Share and BPS Analysis by Source, 2025 and 2035
  • Figure 91: Eastern Europe Market Y-o-Y Growth Comparison by Source, 2025-2035
  • Figure 92: Eastern Europe Market Attractiveness Analysis by Source
  • Figure 93: Eastern Europe Market Value Share and BPS Analysis by Segments, 2025 and 2035
  • Figure 94: Eastern Europe Market Y-o-Y Growth Comparison by Segments, 2025-2035
  • Figure 95: Eastern Europe Market Attractiveness Analysis by Segments
  • Figure 96: Eastern Europe Market Value Share and BPS Analysis by Product Type, 2025 and 2035
  • Figure 97: Eastern Europe Market Y-o-Y Growth Comparison by Product Type, 2025-2035
  • Figure 98: Eastern Europe Market Attractiveness Analysis by Product Type
  • Figure 99: Eastern Europe Market Value Share and BPS Analysis by Distribution Channel, 2025 and 2035
  • Figure 100: Eastern Europe Market Y-o-Y Growth Comparison by Distribution Channel, 2025-2035
  • Figure 101: Eastern Europe Market Attractiveness Analysis by Distribution Channel
  • Figure 102: Eastern Europe Market Value Share and BPS Analysis by End-Use, 2025 and 2035
  • Figure 103: Eastern Europe Market Y-o-Y Growth Comparison by End-Use, 2025-2035
  • Figure 104: Eastern Europe Market Attractiveness Analysis by End-Use
  • Figure 105: Eastern Europe Market Value Share and BPS Analysis by Application, 2025 and 2035
  • Figure 106: Eastern Europe Market Y-o-Y Growth Comparison by Application, 2025-2035
  • Figure 107: Eastern Europe Market Attractiveness Analysis by Application
  • Figure 108: East Asia Market Value Share and BPS Analysis by Country, 2025 and 2035
  • Figure 109: East Asia Market Value Share and BPS Analysis by Source, 2025 and 2035
  • Figure 110: East Asia Market Y-o-Y Growth Comparison by Source, 2025-2035
  • Figure 111: East Asia Market Attractiveness Analysis by Source
  • Figure 112: East Asia Market Value Share and BPS Analysis by Segments, 2025 and 2035
  • Figure 113: East Asia Market Y-o-Y Growth Comparison by Segments, 2025-2035
  • Figure 114: East Asia Market Attractiveness Analysis by Segments
  • Figure 115: East Asia Market Value Share and BPS Analysis by Product Type, 2025 and 2035
  • Figure 116: East Asia Market Y-o-Y Growth Comparison by Product Type, 2025-2035
  • Figure 117: East Asia Market Attractiveness Analysis by Product Type
  • Figure 118: East Asia Market Value Share and BPS Analysis by Distribution Channel, 2025 and 2035
  • Figure 119: East Asia Market Y-o-Y Growth Comparison by Distribution Channel, 2025-2035
  • Figure 120: East Asia Market Attractiveness Analysis by Distribution Channel
  • Figure 121: East Asia Market Value Share and BPS Analysis by End-Use, 2025 and 2035
  • Figure 122: East Asia Market Y-o-Y Growth Comparison by End-Use, 2025-2035
  • Figure 123: East Asia Market Attractiveness Analysis by End-Use
  • Figure 124: East Asia Market Value Share and BPS Analysis by Application, 2025 and 2035
  • Figure 125: East Asia Market Y-o-Y Growth Comparison by Application, 2025-2035
  • Figure 126: East Asia Market Attractiveness Analysis by Application
  • Figure 127: South Asia & Pacific Market Value Share and BPS Analysis by Country, 2025 and 2035
  • Figure 128: South Asia & Pacific Market Value Share and BPS Analysis by Source, 2025 and 2035
  • Figure 129: South Asia & Pacific Market Y-o-Y Growth Comparison by Source, 2025-2035
  • Figure 130: South Asia & Pacific Market Attractiveness Analysis by Source
  • Figure 131: South Asia & Pacific Market Value Share and BPS Analysis by Segments, 2025 and 2035
  • Figure 132: South Asia & Pacific Market Y-o-Y Growth Comparison by Segments, 2025-2035
  • Figure 133: South Asia & Pacific Market Attractiveness Analysis by Segments
  • Figure 134: South Asia & Pacific Market Value Share and BPS Analysis by Product Type, 2025 and 2035
  • Figure 135: South Asia & Pacific Market Y-o-Y Growth Comparison by Product Type, 2025-2035
  • Figure 136: South Asia & Pacific Market Attractiveness Analysis by Product Type
  • Figure 137: South Asia & Pacific Market Value Share and BPS Analysis by Distribution Channel, 2025 and 2035
  • Figure 138: South Asia & Pacific Market Y-o-Y Growth Comparison by Distribution Channel, 2025-2035
  • Figure 139: South Asia & Pacific Market Attractiveness Analysis by Distribution Channel
  • Figure 140: South Asia & Pacific Market Value Share and BPS Analysis by End-Use, 2025 and 2035
  • Figure 141: South Asia & Pacific Market Y-o-Y Growth Comparison by End-Use, 2025-2035
  • Figure 142: South Asia & Pacific Market Attractiveness Analysis by End-Use
  • Figure 143: South Asia & Pacific Market Value Share and BPS Analysis by Application, 2025 and 2035
  • Figure 144: South Asia & Pacific Market Y-o-Y Growth Comparison by Application, 2025-2035
  • Figure 145: South Asia & Pacific Market Attractiveness Analysis by Application
  • Figure 146: Middle East and Africa Market Value Share and BPS Analysis by Country, 2025 and 2035
  • Figure 147: Middle East and Africa Market Value Share and BPS Analysis by Source, 2025 and 2035
  • Figure 148: Middle East and Africa Market Y-o-Y Growth Comparison by Source, 2025-2035
  • Figure 149: Middle East and Africa Market Attractiveness Analysis by Source
  • Figure 150: Middle East and Africa Market Value Share and BPS Analysis by Segments, 2025 and 2035
  • Figure 151: Middle East and Africa Market Y-o-Y Growth Comparison by Segments, 2025-2035
  • Figure 152: Middle East and Africa Market Attractiveness Analysis by Segments
  • Figure 153: Middle East and Africa Market Value Share and BPS Analysis by Product Type, 2025 and 2035
  • Figure 154: Middle East and Africa Market Y-o-Y Growth Comparison by Product Type, 2025-2035
  • Figure 155: Middle East and Africa Market Attractiveness Analysis by Product Type
  • Figure 156: Middle East and Africa Market Value Share and BPS Analysis by Distribution Channel, 2025 and 2035
  • Figure 157: Middle East and Africa Market Y-o-Y Growth Comparison by Distribution Channel, 2025-2035
  • Figure 158: Middle East and Africa Market Attractiveness Analysis by Distribution Channel
  • Figure 159: Middle East and Africa Market Value Share and BPS Analysis by End-Use, 2025 and 2035
  • Figure 160: Middle East and Africa Market Y-o-Y Growth Comparison by End-Use, 2025-2035
  • Figure 161: Middle East and Africa Market Attractiveness Analysis by End-Use
  • Figure 162: Middle East and Africa Market Value Share and BPS Analysis by Application, 2025 and 2035
  • Figure 163: Middle East and Africa Market Y-o-Y Growth Comparison by Application, 2025-2035
  • Figure 164: Middle East and Africa Market Attractiveness Analysis by Application
  • Figure 165: Global Market - Tier Structure Analysis
  • Figure 166: Global Market - Company Share Analysis

Frequently Asked Questions

What is the projected size of the plant-based shrimp market in 2025?

The market is valued at USD 1.4 billion in 2025.

What is the outlook on plant-based shrimp demand by 2035?

The market is forecasted to reach USD 3.2 billion by 2035, reflecting a CAGR of 8.6%.

Which segment leads the plant-based shrimp market by product type in 2025?

Frozen plant-based shrimp will lead the product type segment, accounting for 50% of the global market share in 2025.

What is the top application sector for the plant-based shrimp market in 2025?

Pharmaceutical will dominate the application segment with a 60% share in 2025.

Which country is projected to have the fastest-growing plant-based shrimp market?

Japan is projected to grow at the fastest rate, with a CAGR of 9.2% from 2025 to 2035.

Explore Similar Insights

Future Market Insights

Plant-Based Shrimp Market