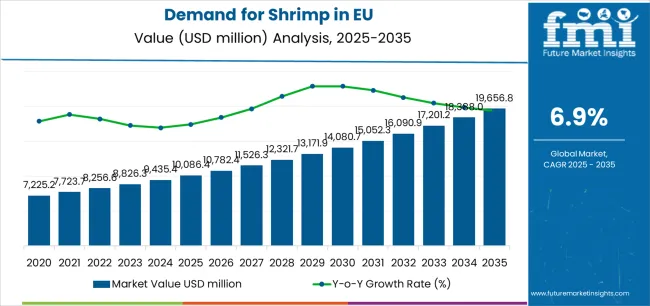
European Union shrimp sales are projected to grow from USD 10,086.4 million in 2025 to approximately USD 19,656.8 million by 2035, recording an absolute increase of USD 9,534.8 million over the forecast period. This translates into total growth of 94.5%, with demand forecast to expand at a compound annual growth rate (CAGR) of 6.9% between 2025 and 2035. As highlighted in FMI’s comprehensive report on global dietary behavior and flavor adoption patterns, the overall industry size is expected to grow by nearly 1.9X during the same period, supported by increasing consumer demand for high-protein seafood, growing awareness of shrimp's nutritional benefits, and expanding availability across retail, foodservice, and e-commerce channels throughout European markets.
| Metric | Value |
|---|---|
| Market Value (2025) | USD 10,086.4 million |
| Market Forecast Value (2035) | USD 19,656.8 million |
| Forecast CAGR (2025-2035) | 6.9% |
Between 2025 and 2030, EU shrimp demand is projected to expand from USD 10,086.4 million to USD 14,048.2 million, resulting in a value increase of USD 3,961.8 million, which represents 41.5% of the total forecast growth for the decade. This phase of development will be shaped by rising consumer adoption of convenient seafood options, increasing availability of value-added shrimp products across ready-to-eat and ready-to-cook formats, and growing mainstream acceptance of shrimp as a versatile protein source across retail and foodservice channels. Manufacturers and suppliers are expanding their product portfolios to address evolving preferences for sustainable sourcing, improved traceability, and premium quality comparable to fresh seafood while maintaining convenience and affordability.
From 2030 to 2035, sales are forecast to grow from USD 14,048.2 million to USD 19,621.2 million, adding another USD 5,573 million, which constitutes 58.5% of the overall ten-year expansion. This period is expected to be characterized by further expansion of organic and sustainably certified varieties, integration of advanced processing technologies for enhanced quality, and development of innovative product formats targeting diverse consumer preferences. The growing emphasis on responsible aquaculture and increasing consumer willingness to pay premium prices for certified sustainable shrimp will drive demand for high-quality products that deliver superior taste with verified environmental credentials.
Between 2020 and 2025, EU shrimp sales experienced steady expansion at a CAGR of 4.5%, growing from USD 8,093.8 million to USD 10,086.4 million. This period was driven by increasing health consciousness favoring lean protein sources, rising awareness of omega-3 benefits, and growing recognition of shrimp's culinary versatility. The industry developed as major seafood importers and retail chains recognized the commercial potential of convenient shrimp products. Product innovations, improved supply chain transparency, and quality standardization began establishing consumer confidence and mainstream acceptance of various shrimp formats.
Industry expansion is being supported by the rapid increase in health-conscious consumers across European countries and the corresponding demand for lean, protein-rich, and nutritionally dense seafood options with proven health benefits. Modern consumers rely on shrimp as an excellent source of high-quality protein, omega-3 fatty acids, and essential minerals in meal preparation, salad additions, pasta dishes, and appetizer applications, driving demand for products that deliver superior freshness, authentic taste, and convenient preparation. Even minor dietary considerations, such as seeking low-calorie protein sources, managing heart health, or supporting active lifestyles, can drive comprehensive adoption of shrimp to maintain nutritional balance and support wellness objectives.
The growing awareness of sustainable seafood sourcing and increasing recognition of shrimp's environmental credentials when responsibly farmed are driving demand for shrimp products from certified suppliers with appropriate quality credentials and traceability systems. Regulatory authorities are increasingly establishing clear guidelines for seafood labeling, origin declaration, and quality requirements to maintain consumer safety and ensure product authenticity. Scientific research studies and nutritional analyses are providing evidence supporting shrimp's health benefits and protein quality, requiring careful sourcing practices and standardized handling protocols for optimal freshness preservation, appropriate quality maintenance, and consistent sensory profiles, including texture integrity and flavor authenticity.
Sales are segmented by product type (form), application, distribution channel, nature, and country. By product type, demand is divided into canned, frozen, peeled, cooked & peeled, breaded, and shell-on varieties. Based on application, sales are categorized into food, pharmaceutical, cosmetics, industrial, and biotechnology segments. In terms of distribution channel, demand is segmented into modern trade, online retail, specialty food stores, wholesale stores, discount stores, convenience stores, and other retail formats. By nature, sales are classified into organic and conventional. Regionally, demand is focused on Germany, France, Italy, Spain, the Netherlands, and the Rest of Europe.
.webp)
The canned segment is projected to account for 80% of EU shrimp sales in 2025, declining to 75% by 2035, establishing itself as the dominant format across European consumers despite gradual share loss to frozen alternatives. This commanding position is fundamentally supported by canned shrimp's exceptional shelf stability, comprehensive convenience enabling ambient storage without refrigeration, and established culinary tradition particularly in Mediterranean and Southern European markets. The canned format delivers exceptional accessibility, providing retailers with a product category that facilitates widespread distribution, reduces cold chain requirements, and maintains consistent quality essential for consumer trust.
This segment benefits from long-established consumption patterns, well-developed processing infrastructure, and extensive variety from multiple international suppliers who maintain rigorous quality standards and continuous product innovation. Additionally, canned shrimp offers versatility across various applications, including salad preparation, pasta dishes, sandwich fillings, and appetizer platters, supported by proven processing technologies that ensure food safety and extended shelf life.
The canned segment is expected to maintain strong positioning at 75% share through 2035, demonstrating stable dominance despite frozen segment gains through quality improvements and expanded frozen food retail infrastructure throughout the forecast period.
Key advantages:
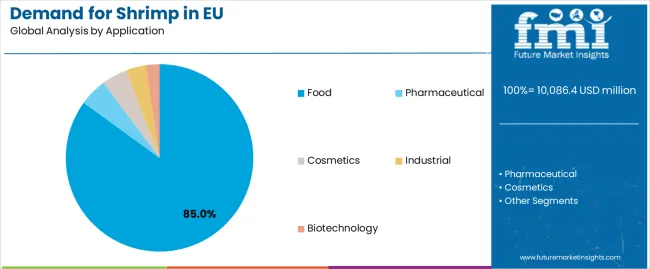
Food applications are positioned to represent 85% of total shrimp demand across European operations in 2025, expanding slightly to 86% by 2035, reflecting the segment's dominance as the primary consumption channel within the overall category. This substantial share directly demonstrates that culinary consumption represents the core market, with consumers purchasing shrimp for home cooking, restaurant dining, prepared meals, and convenience foods requiring high-quality seafood ingredients.
Modern consumers increasingly view shrimp as a premium yet accessible protein option for diverse meal occasions, driving demand for products optimized for taste quality, appropriate sizing, and versatile preparation that resonates across home cooking and dining-out experiences. The segment benefits from continuous innovation focused on value-added products, enhanced convenience through pre-cooked formats, and improved quality supporting premium positioning.
The segment's expanding share reflects growing culinary adoption outpacing niche applications, with food maintaining strong growth while pharmaceutical and cosmetic uses remain stable specialty segments throughout the forecast period.
Key drivers:
Modern trade channels are strategically estimated to control 30% of total European shrimp sales in 2025, declining to 28% by 2035, reflecting traditional supermarket and hypermarket dominance while facing growing competition from online channels. European modern trade operators consistently demonstrate strong capabilities for shrimp products that deliver quality assurance, competitive pricing, and reliable availability across mainstream grocery formats.
The segment provides essential consumer touchpoints through widespread store networks, refrigeration infrastructure supporting frozen shrimp displays, and promotional activities driving category awareness. Major European retailers, including Carrefour, Tesco, Rewe, Lidl, and Auchan, systematically maintain comprehensive shrimp selections, often featuring multiple origin countries, various processing formats, and sustainability certifications that normalize premium seafood consumption.
The segment's declining share reflects accelerating e-commerce adoption, with modern trade maintaining absolute growth while online retail expands dramatically from 18% to 25% throughout the forecast period.
Success factors:
Conventional shrimp products are strategically positioned to contribute 75% of total European sales in 2025, declining to 65% by 2035, representing products sourced through standard aquaculture and wild-caught methods without organic or specialized sustainability certifications. These conventional products successfully deliver competitive pricing and reliable availability while ensuring broad commercial access across all distribution channels that prioritize volume scalability and cost competitiveness.
Conventional production serves price-conscious consumers, mainstream retail applications, and value-oriented households requiring affordable protein sources at accessible price points. The segment derives significant competitive advantages from established supply chains spanning Asian aquaculture operations, economies of scale in processing, and the ability to meet substantial volume requirements from major retailers without certification constraints limiting sourcing flexibility.
The segment's declining share through 2035 reflects the industry's significant evolution toward organic and certified sustainable products, which grow from 25% in 2025 to 35% in 2035, as environmentally conscious consumers increasingly prioritize sustainability certifications and responsible sourcing practices.
Competitive advantages:
EU shrimp sales are advancing robustly due to increasing protein consumption awareness, growing Mediterranean cuisine popularity incorporating seafood, and rising demand for convenient meal solutions. However, the industry faces challenges, including sustainability concerns regarding aquaculture environmental impact, price volatility linked to Asian production costs and currency fluctuations, and competition from alternative seafood proteins for health-conscious consumers. Continued innovation in sustainable aquaculture and traceability systems remains central to industry development.
The rapidly accelerating development of certified sustainable aquaculture is fundamentally transforming shrimp from commodity seafood to premium responsibly sourced protein, enabling Aquaculture Stewardship Council (ASC) certification, Best Aquaculture Practices (BAP) verification, and organic credentials previously unavailable through conventional farming. Advanced aquaculture systems featuring recirculating technology, reduced antibiotic usage, and environmental monitoring allow producers to create shrimp with verified sustainability status, reduced environmental footprint, and traceable origin comparable to premium wild-caught seafood. These sustainability innovations prove particularly transformative for premium retailers, including organic grocers, quality-focused chains, and environmentally conscious consumers, where sourcing integrity proves essential for purchasing decisions.
Major shrimp suppliers invest heavily in certification programs, farm improvement initiatives, and traceability system implementation, recognizing that certified sustainable varieties represent breakthrough solutions for environmental perception challenges limiting premium segment expansion. Suppliers collaborate with certification bodies, environmental organizations, and retail partners to develop scalable sustainability programs that ensure responsible production while maintaining commercial viability supporting volume requirements.
Modern shrimp processors systematically incorporate advanced value-added processing, including marinated varieties, pre-seasoned formats, and ready-to-cook innovations that deliver enhanced convenience, simplified preparation, and premium positioning comparable to restaurant-quality preparations. Strategic integration of culinary innovation optimized for home cooking enables manufacturers to position shrimp as accessible gourmet ingredients where preparation convenience directly determines busy household purchasing behavior. These product innovations prove essential for market expansion, as time-constrained consumers demand convenience verification, preparation simplicity, and restaurant-quality results supporting weeknight meal solutions.
Companies implement extensive product development programs, culinary partnerships with chefs, and consumer testing targeting flavor acceptance, including marinade development, seasoning optimization, and cooking method simplification. Manufacturers leverage value-added positioning in retail communications, recipe content featuring quick preparation, and premium messaging, positioning convenience shrimp as elevated meal solutions delivering restaurant experiences at home.
European consumers increasingly prioritize online shrimp purchasing featuring home delivery, subscription services, and direct-from-supplier models that differentiate digital channels through selection breadth and convenience. This e-commerce trend enables suppliers to drive margin improvement through direct sales, customer relationship building through personalized communication, and market expansion resonating with digital-native consumers seeking convenient grocery solutions. E-commerce innovation proves particularly important for frozen seafood where home delivery eliminates carrying frozen products, subscription models ensure regular availability, and online-exclusive premium varieties attract quality-focused buyers.
The development of sophisticated cold chain delivery systems, including insulated packaging, dry ice solutions, and temperature-monitored shipping expands retailers' abilities to deliver frozen seafood maintaining quality standards. Brands collaborate with logistics providers, cold chain specialists, and last-mile delivery services to develop reliable systems balancing quality maintenance with delivery economics, supporting premium pricing and subscription models while maintaining food safety across digital commerce channels.
| Country | CAGR % (2025-2035) |
|---|---|
| France | 7.7% |
| Italy | 7.7% |
| Spain | 7.7% |
| Netherlands | 7.7% |
| Germany | 5.3% |
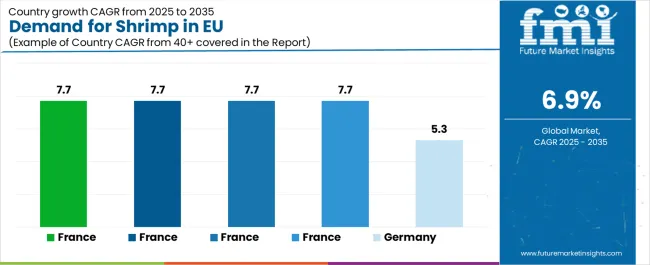
EU shrimp sales demonstrate differentiated growth across European economies, with France, Italy, Spain, Netherlands, and Rest of Europe leading expansion at 7.7% CAGR through 2035, driven by accelerating Mediterranean diet adoption, seafood consumption culture development, and premium product penetration. Germany demonstrates 5.3% CAGR as Europe's largest but most mature market with established consumption patterns. Overall, Southern European markets and emerging Eastern European operations significantly outpace Northern European mature markets, reflecting varying culinary traditions and seafood adoption stages.
Revenue from shrimp in Germany is projected to grow at a CAGR of 5.3% through 2035—below the EU average—maintaining Europe's largest market position at 36.2% share driven by substantial population exceeding 83 million and established retail infrastructure, while moderate growth reflects mature market dynamics with high existing per-capita consumption. Germany's measured expansion fundamentally reflects market saturation where shrimp already penetrated mainstream consumption, limited by Northern European culinary traditions favoring fish over shellfish and price sensitivity constraining premium segment growth.
Major retailers, including Edeka, Rewe, Aldi, Lidl, and Metro, systematically maintain comprehensive shrimp selections across canned and frozen formats. German market uniquely demonstrates mature characteristics where growth derives from premiumization toward organic and certified sustainable varieties rather than volume expansion, combined with value-seeking consumer behavior limiting premium price point acceptance. Additionally, competition from alternative proteins including chicken, pork, and plant-based options moderates shrimp consumption growth despite established category presence.
Maturity factors:
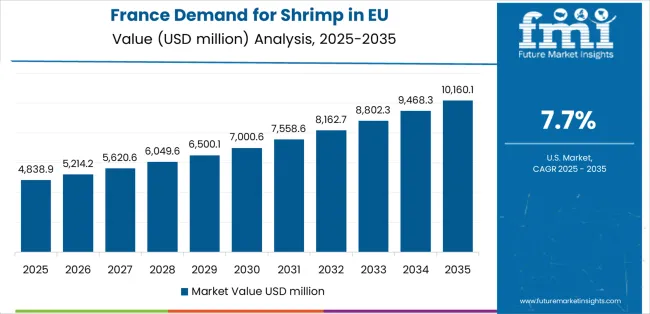
Revenue from shrimp in France is expanding at a robust CAGR of 7.7% through 2035—significantly above EU average—maintaining 23.7% market share driven by exceptional culinary heritage embracing seafood, Mediterranean cuisine influence particularly in Southern regions, and sophisticated retail channels supporting premium positioning. France's strong growth reflects accelerating seafood consumption where shrimp benefits from culinary versatility, growing health consciousness driving lean protein demand, and premium retail development offering quality-certified sustainable varieties.
Major retailers, including Carrefour, Auchan, Leclerc, Intermarché, and specialized seafood retailers, strategically expand premium shrimp offerings emphasizing French culinary quality standards. French market uniquely benefits from gastronomic culture where shrimp features prominently in traditional recipes, combined with growing organic and sustainable seafood interest among urban consumers, and expanding frozen seafood retail infrastructure enabling premium product availability. Restaurant sector strength additionally drives foodservice shrimp consumption supporting overall category expansion.
Acceleration drivers:
Revenue from shrimp in Italy is growing at a leading CAGR of 7.7% through 2035, maintaining 14.2% market share fundamentally driven by Mediterranean diet cultural foundation featuring seafood prominently, extensive coastal culinary traditions incorporating shrimp, and growing convenience food adoption including seafood-based prepared meals. Italy's strong growth reflects deep-rooted seafood consumption culture where shrimp represents traditional ingredient, combined with modernization trends where busy urban households increasingly purchase convenient shrimp formats replacing traditional fresh seafood preparation.
Italian retailers and specialty stores, including Coop Italia, Esselunga, Conad, and traditional fish markets, systematically prioritize quality shrimp products addressing discerning consumers. Italian market uniquely demonstrates both traditional canned shrimp consumption for pantry staples and accelerating frozen premium variety adoption for quality-focused cooking. Growing awareness of sustainable seafood additionally drives certified product interest, while restaurant sector robustness supports commercial consumption maintaining category vitality.
Mediterranean strength factors:
Demand for shrimp in Spain is projected to grow at a strong CAGR of 7.7% through 2035, maintaining 18.9% market share substantially supported by extensive coastal regions with deep-rooted shellfish consumption culture, "gambas" tradition positioning shrimp as premium delicacy, and growing domestic aquaculture providing local sourcing advantages. Spanish market strength fundamentally reflects Mediterranean lifestyle where seafood represents daily cuisine staple rather than occasional treat, combined with tapas culture driving commercial consumption and tourism supporting restaurant sector shrimp demand.
Spanish retailers, including Mercadona, Carrefour España, Alcampo, and specialized pescaderías, maintain extensive shrimp selections emphasizing both traditional canned formats and premium frozen varieties. Spain's market uniquely benefits from strong wild-caught shrimp preference particularly for "gambas rojas" and "carabineros," combined with growing aquaculture operations in Southern regions providing domestic supply, and robust foodservice sector consuming substantial commercial volumes. Tourism additionally stimulates seasonal demand peaks supporting category expansion.
Cultural consumption drivers:
Demand for shrimp in the Netherlands is expanding at a strong CAGR of 7.7% through 2035, maintaining 3.8% market share fundamentally driven by Rotterdam port infrastructure positioning Netherlands as European seafood import gateway, advanced cold chain logistics supporting distribution throughout Europe, and sophisticated consumer preference for premium certified sustainable varieties. Dutch market strength reflects trading hub advantages where substantial shrimp volumes flow through Netherlands for European distribution, combined with domestic consumption growth driven by health consciousness and quality focus.
Netherlands retailers, including Albert Heijn, Jumbo, and specialized organic chains, strategically emphasize certified sustainable shrimp varieties addressing environmentally conscious Dutch consumers. Market uniquely benefits from port infrastructure enabling efficient import operations, quality control expertise ensuring specification compliance, and concentration of seafood trading companies facilitating supply chain innovation. Additionally, Dutch sustainability focus creates strong demand for ASC-certified and organic shrimp varieties supporting premium segment expansion.
Hub and premium factors:
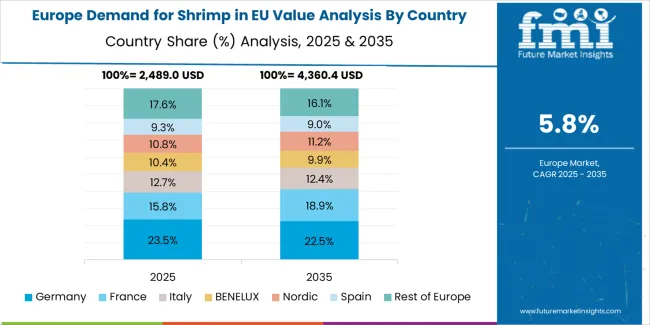
EU shrimp sales are projected to grow from USD 10,086.4 million in 2025 to USD 19,621.2 million by 2035, registering a CAGR of 6.9% over the forecast period. France, Italy, Spain, Netherlands, and Rest of Europe are expected to demonstrate the strongest growth trajectories with 7.7% CAGR each, supported by growing seafood consumption culture, Mediterranean culinary traditions, and expanding premium retail channels. Germany maintains the largest market share but grows at a more moderate 5.3% CAGR reflecting market maturity.
Germany maintains the largest share at 36.2% in 2025, driven by substantial population and established retail infrastructure, while recording 5.3% CAGR. France, Italy, Spain, Netherlands, and Rest of Europe all demonstrate 7.7% CAGR, reflecting accelerating seafood consumption and premium product adoption.
EU shrimp sales are defined by competition among integrated seafood companies, specialized aquaculture producers, and trading houses managing import operations. Companies are investing in sustainable certification programs, value-added product innovation, traceability system implementation, and quality assurance protocols to deliver high-quality, responsibly sourced, and competitively priced shrimp solutions. Strategic partnerships with retail operators, direct sourcing from certified farms, and marketing campaigns emphasizing sustainability credentials are central to strengthening competitive position.
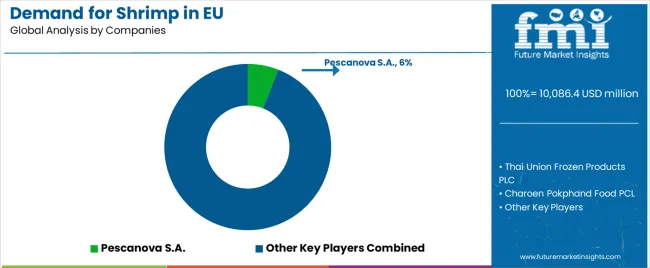
Major participants include Pescanova S.A. with an estimated 6% share, leveraging its European processing presence, distribution network capabilities, and established retail relationships across major markets. Pescanova benefits from integrated operations spanning sourcing, processing, and distribution, enabling quality control and consistent supply supporting retail partnerships.
Thai Union Frozen Products PLC holds approximately 5.5% share, emphasizing diverse brand portfolio, value-added product expertise, and global sourcing capabilities serving European markets. Thai Union's success in developing branded seafood products with innovation focus creates strong positioning and consumer recognition, supported by processing excellence and retail channel expertise.
Charoen Pokphand Food PCL accounts for roughly 5% share through its position as leading Asian aquaculture company with European import partnerships, providing volume-oriented supply through extensive farming operations. The company benefits from aquaculture scale, cost competitiveness, and ability to meet substantial European demand supporting mainstream retail requirements.
Nippon Suisan Kaisha Ltd. represents approximately 3.5% share, supporting growth through Japanese quality standards, European subsidiaries, and premium positioning. The company leverages processing expertise for quality-focused segments, technical capabilities, and established relationships attracting premium retailers seeking differentiated products.
Gulf Shrimp Company accounts for roughly 2% share with limited European distribution focused on specialty segments.
Other companies collectively hold 78% share, reflecting highly fragmented competitive dynamics within European shrimp sales, where numerous regional importers, specialized processors, private-label suppliers for major retailers, and emerging sustainable brands serve specific market segments, regional operations, and niche applications. This competitive environment provides opportunities for differentiation through sustainability certifications (ASC, organic), specialized product formats (marinated, seasoned), unique origin positioning, and premium quality resonating with environmentally conscious consumers seeking responsibly sourced seafood.
| Item | Value |
|---|---|
| Quantitative Units | USD 19,656.8 million |
| Species | Gulf Shrimps, Farmed Whiteleg Shrimps, Banded Coral Shrimps, Royal Red Shrimp, Giant Tiger Shrimps, Blue Shrimps, Ocean Shrimps |
| Product Type (Form) | Canned, Frozen, Peeled, Cooked & Peeled, Breaded, Shell-On, and Frozen |
| Source | Organic and Conventional |
| Processing | Direct and Indirect |
| Application | Food, Pharmaceutical, Cosmetics, Industrial, Biotechnology |
| Distribution Channel | Modern Trade, Online Retail, Specialty Food Stores, Wholesale Stores, Discount Stores, Convenience Stores, Other Retail Formats |
| Nature | Organic, Conventional |
| Countries Covered | Germany, France, Italy, Spain, the Netherlands, and the Rest of Europe |
| Key Companies Profiled | Pescanova, Thai Union, Charoen Pokphand, Nippon Suisan, Specialized seafood companies |
| Additional Attributes | Dollar sales by product type (form), application, distribution channel, and nature; regional demand trends across major European economies; competitive landscape analysis with integrated seafood companies and specialized suppliers; consumer preferences for various processing formats and quality certifications; integration with sustainable aquaculture programs and traceability systems; innovations in value-added products and convenience formats; adoption across retail, foodservice, and e-commerce channels; regulatory framework analysis for seafood labeling and origin declaration; supply chain strategies; and penetration analysis for mainstream and premium European consumer segments. |
Product Type (Form)
The global demand for shrimp in the EU is estimated to be valued at USD 10,086.4 million in 2025.
The market size for the demand for shrimp in the EU is projected to reach USD 19,656.8 million by 2035.
The demand for shrimp in the EU is expected to grow at a 6.9% CAGR between 2025 and 2035.
The key product types in demand for shrimp in the EU are canned, frozen, peeled, cooked & peeled, breaded and shell-on.
In terms of application, food segment to command 85.0% share in the demand for shrimp in the EU in 2025.


Our Research Products

The "Full Research Suite" delivers actionable market intel, deep dives on markets or technologies, so clients act faster, cut risk, and unlock growth.

The Leaderboard benchmarks and ranks top vendors, classifying them as Established Leaders, Leading Challengers, or Disruptors & Challengers.

Locates where complements amplify value and substitutes erode it, forecasting net impact by horizon

We deliver granular, decision-grade intel: market sizing, 5-year forecasts, pricing, adoption, usage, revenue, and operational KPIs—plus competitor tracking, regulation, and value chains—across 60 countries broadly.

Spot the shifts before they hit your P&L. We track inflection points, adoption curves, pricing moves, and ecosystem plays to show where demand is heading, why it is changing, and what to do next across high-growth markets and disruptive tech

Real-time reads of user behavior. We track shifting priorities, perceptions of today’s and next-gen services, and provider experience, then pace how fast tech moves from trial to adoption, blending buyer, consumer, and channel inputs with social signals (#WhySwitch, #UX).

Partner with our analyst team to build a custom report designed around your business priorities. From analysing market trends to assessing competitors or crafting bespoke datasets, we tailor insights to your needs.
Supplier Intelligence
Discovery & Profiling
Capacity & Footprint
Performance & Risk
Compliance & Governance
Commercial Readiness
Who Supplies Whom
Scorecards & Shortlists
Playbooks & Docs
Category Intelligence
Definition & Scope
Demand & Use Cases
Cost Drivers
Market Structure
Supply Chain Map
Trade & Policy
Operating Norms
Deliverables
Buyer Intelligence
Account Basics
Spend & Scope
Procurement Model
Vendor Requirements
Terms & Policies
Entry Strategy
Pain Points & Triggers
Outputs
Pricing Analysis
Benchmarks
Trends
Should-Cost
Indexation
Landed Cost
Commercial Terms
Deliverables
Brand Analysis
Positioning & Value Prop
Share & Presence
Customer Evidence
Go-to-Market
Digital & Reputation
Compliance & Trust
KPIs & Gaps
Outputs
Full Research Suite comprises of:
Market outlook & trends analysis
Interviews & case studies
Strategic recommendations
Vendor profiles & capabilities analysis
5-year forecasts
8 regions and 60+ country-level data splits
Market segment data splits
12 months of continuous data updates
DELIVERED AS:
PDF EXCEL ONLINE
Therapeutic Drug Monitoring Market Analysis - Size, Share, and Forecast Outlook 2025 to 2035
Therapeutic Robots Market Size and Share Forecast Outlook 2025 to 2035
Therapeutic Apheresis Market Analysis - Size, Share, and Forecast Outlook 2025 to 2035
Therapeutic Respiratory Devices Market Overview - Trends & Forecast 2025 to 2035
Therapeutic Contact Lenses Market Report - Trends, Demand & Outlook 2025 to 2035
Therapeutic Diet for Pet Market Analysis by Age Group, Health Condition, Distribution Channel and Others Through 2035
Therapeutic Hair Oil Market Insights - Size, Trends & Forecast 2025 to 2035
Therapeutic Nuclear Medicine Market Analysis – Size, Share & Forecast 2024-2034
Europe Shrimp Market Outlook – Share, Growth & Forecast 2025–2035
Leukemia Therapeutics Treatment Market Analysis - Growth & Forecast 2025 to 2035
Competitive Overview of Neuroprosthetics Companies
Europe Radiotherapy Patient Positioning Market Size and Share Forecast Outlook 2025 to 2035
Northern Europe Calcium Sulphate Market Size and Share Forecast Outlook 2025 to 2035
Biotherapeutics Virus Removal Filters Market Trends – Growth & Forecast 2025 to 2035
Europe Massage Therapy Service Market Size and Share Forecast Outlook 2025 to 2035
Pain Therapeutic Injectables Market Size and Share Forecast Outlook 2025 to 2035
Pain Therapeutic Solutions Market Size and Share Forecast Outlook 2025 to 2035
COPD Therapeutics Market Report – Growth, Demand & Industry Forecast 2023-2033
Psychotherapeutic Combinations Market Analysis - Size, Share, and Forecast Outlook 2025 to 2035
Sinus Therapeutic Drugs Market – Trends, Growth & Forecast 2022-2032

Thank you!
You will receive an email from our Business Development Manager. Please be sure to check your SPAM/JUNK folder too.
Chat With
MaRIA