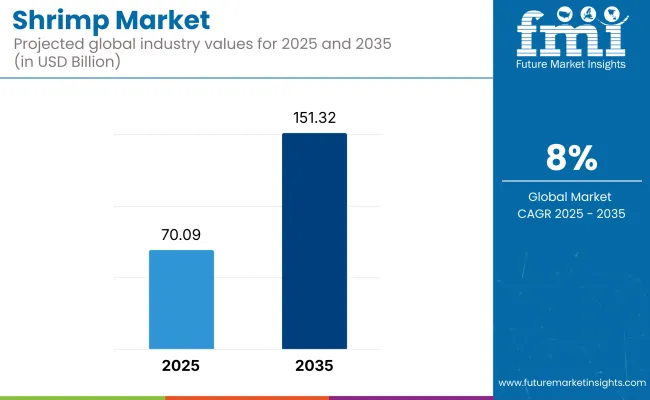
The global shrimp market is poised to grow significantly from USD 70.09 billion in 2025 to approximately USD 151.32 billion by 2035, advancing at a CAGR of 8.0%. This robust expansion is attributed to rising consumer preference for seafood, technological strides in aquaculture, and growing global trade in frozen and value-added shrimp products.
Growth in the shrimp market is strongly driven by shifting consumer dietary patterns toward protein-rich and health-conscious food. Shrimp offers a lean, low-fat source of high-quality protein rich in omega-3 fatty acids and essential nutrients, making it highly desirable.
Furthermore, advanced cold chain logistics and seafood processing technologies have allowed suppliers to expand into newer markets with longer shelf life and reduced spoilage. Among species, Gulf shrimp is witnessing rising global attention due to its premium flavor profile and sustainable harvesting practices, which resonate well with environmentally aware consumers.
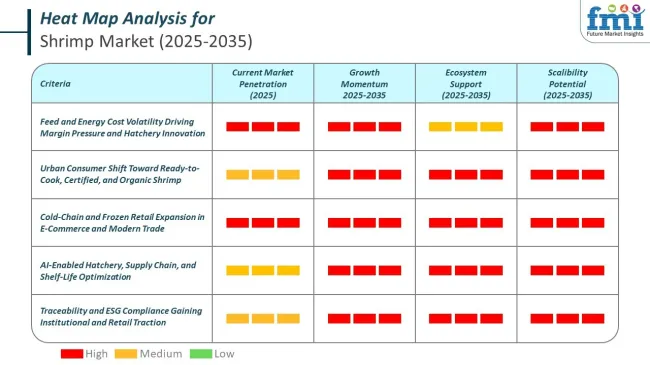
Adoption barriers remain, especially for small-scale producers facing regulatory, technological, and investment challenges. However, the growth of automated recirculating aquaculture systems (RAS) and improved feed innovations is gradually mitigating these concerns. Additionally, market penetration of organic and antibiotic-free shrimp is increasing due to rising consumer awareness around food safety and traceability. These trends point toward a transition from conventional wild-caught shrimp to farmed, traceable, and environmentally sustainable sources.
Key players are investing in scaling up production efficiency while adhering to sustainable practices. Traceability and eco-labeling are also gaining prominence, influencing purchasing behavior in key export markets. As the shrimp industry becomes increasingly consumer-centric and sustainability-driven, stakeholders across the supply chain are expected to align their strategies toward transparency, nutritional value, and innovation.

| Attributes | Description |
|---|---|
| Estimated Global Industry Size (2025E) | USD 70.09 billion |
| Projected Global Industry Value (2035F) | USD 151.32 billion |
| Value-based CAGR (2025 to 2035) | 8.0% |
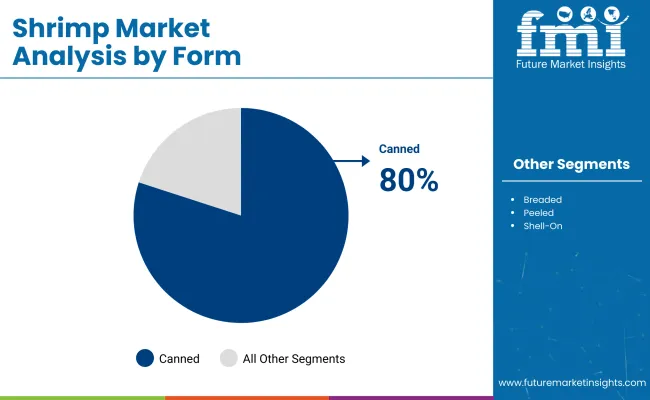
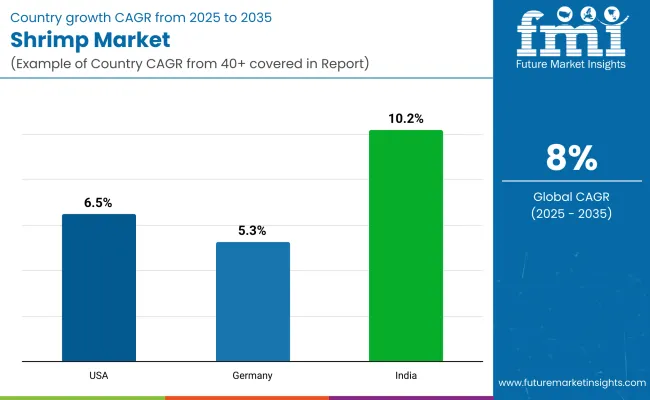
India is projected to lead with a CAGR of 10.2%, followed by the USA at 6.5%, while the Asia Pacific region will maintain its dominance due to vast aquaculture infrastructure and high domestic consumption. Among the various product forms, canned shrimp accounts for the largest value share of 80% in 2025, driven by convenience and affordability.
Per-capita shrimp intake varies across coastal and urban populations. In Vietnam, recorded averages for 2025 are at 5.4 kg per person. U.S. intake is estimated at 3.6 kg annually per capita, with both retail and institutional formats included. Consumption references are maintained in national food balance sheets and import-led usage registries.
Cross-border trade remains documented in port authority records. Ecuador and India appear as active export sources for frozen and processed shrimp. Thailand and China are listed in shipment trackers for regional delivery coordination. Export and import details fall under seafood HS Code classifications.
Cold-chain frameworks are reported in infrastructure checklists. Institutional inventory reports include shrimp in barcoded packaging formats. Modern logistics documents outline handling under fixed ambient or refrigerated temperature settings.

The shrimp market is segmented by species, form, source, processing, and application. By species, the market includes Gulf Shrimps, Farmed Whiteleg Shrimps, Banded Coral Shrimps, Royal Red Shrimp, Giant Tiger Shrimps, Blue Shrimps, and Ocean Shrimps. The form segment covers Canned, Breaded, Peeled, Cooked & Peeled, Shell-On, and Frozen. By source, it is classified into Organic and Conventional. Processing includes Direct and Indirect methods. Applications comprise Food, Pharmaceutical, Cosmetics, Industrial, and Biotechnology sectors.
Gulf shrimps are expected to remain one of the most prominent species in the global market, capturing a CAGR of 7.5% in 2025 to 2035. Their popularity stems from their firm texture, sweet flavor, and environmentally responsible fishing methods in the Gulf of Mexico. Chefs and consumers alike prefer Gulf shrimps for their consistent taste and quality, especially in high-end culinary applications. Growing awareness of sustainable seafood practices has bolstered the demand for wild-caught Gulf shrimp, particularly in Western markets.
Additionally, robust supply chains and endorsements from health-conscious influencers have elevated their global appeal. Other species, such as farmed whiteleg shrimps and giant tiger shrimps, are also gaining ground, but Gulf shrimps retain their leadership due to their unique taste and traceable origin.
| Species Segment | CAGR (2025 to 2035) |
|---|---|
| Gulf Shrimps | 7.5% |

| Form Segment | Share (2025) |
|---|---|
| Canned Shrimp | 80% |
The canned shrimp segment holds the largest share at 80% in 2025, making it the most preferred form globally. This dominance is attributed to its ease of use, long shelf life, and increasing demand for convenient protein sources. Technological advancements in canning have preserved the nutritional quality and taste of shrimp, narrowing the gap between canned and fresh alternatives.
Moreover, affordability and accessibility through retail and e-commerce channels have amplified its presence in both developed and developing countries. Other forms such as breaded, peeled, and frozen are growing steadily, but the convenience and utility of canned shrimp solidify its market position.
While conventional shrimp continues to represent a larger share of overall volume, organic shrimp is expected to grow at a CAGR of 9.3% from 2025 to 2035. This growth is driven by increasing consumer interest in food products that are free from chemicals and antibiotics and produced through environmentally responsible methods.
Markets such as the USA, Germany, and Japan are witnessing greater demand for certified organic shrimp. Although production costs are relatively higher, the segment benefits from premium pricing and a strong perception of quality. Aquaculture producers are progressively adopting organic feed and traceability systems to align with regulatory standards and consumer expectations.
| Source Segment | CAGR (2025 to 2035) |
|---|---|
| Organic Shrimp | 9.3% |
The food segment accounts for a significant portion of global shrimp consumption and is expected to maintain its role as a major driver of demand. Shrimp is widely incorporated into various cuisines, including Asian, Mediterranean, and Western diets, due to its versatility and nutritional profile. Its moderate fat content and high protein levels make it suitable for health-conscious consumers.
Demand for ready-to-eat and frozen shrimp products is increasing, particularly in urban and suburban areas where convenience is a priority. While applications in pharmaceuticals, cosmetics, and biotechnology are expanding, food usage is projected to remain the primary area of consumption. The segment is expected to grow at a CAGR of 8.1% from 2025 to 2035.
| Application Segment | CAGR (2025 to 2035) |
|---|---|
| Food | 8.1% |
Increasing focus on eco-friendly and sustainable shrimp farming practices
Incorporating vitamins, minerals, and antioxidants into fusion drinks is a defining trend, brought about by mounting concern for wellbeing and health. Such functional foods are incorporated for improving the nutritive content of drinks so they not only become refreshing but healthy as well.
Vitamins A, C, and E, and B-complex vitamins are added to support virtually every function of the body, from immune system function to metabolism of energy. Minerals such as calcium, magnesium, and potassium are added to support proper bone function, muscle function, and electrolyte balance. Antioxidants in the form of green tea, berries, and herbs are added to assist in the battle against oxidative stress and chronic disease.
Consumers are recognizing the role these nutrients have in overall good health and are demanding something more than a liquid source of hydration. The combination of vitamins, minerals, and antioxidants with the beverages meets this demand by offering the advantage of taking essential nutrients in a beverage form.
This is a trend that is most attractive to people with no time at all to make healthy, wholesome foods and want convenient means of being healthy on the move. In addition, the presence of these functional ingredients follows the general direction of natural and organic products since most customers want drinks that are derived from natural sources of vitamins and minerals rather than artificial additives.
The trend development has also witnessed growing innovation in the Shrimp Market, where producers introduce new means of enhancing the nutrition value of the products. For example, where cold-press juices, infusions, and herbs teas have been supplemented with vitamins and minerals to make beverages that are not only healthy but also palatable to consume.
The foods would be marketed by their functional nutrients, and health-oriented shoppers who pay a premium to buy food and beverage products that are beneficial to their well-being. With this trend showing no signs of slowing, the Shrimp Market can look forward to further growth and diversification, with an emphasis on offering consumers both tasty and healthy options.
Emphasis on traceability and transparency in the shrimp supply chain
Among the most important strategies of enticing adventurous consumers who are willing to try out new flavors is presenting new and exotic flavor profiles in fusion drinks. With a market filled with the same old flavor profiles, having something new sets a company apart and creates word of mouth among consumers.
Exotic flavors such as yuzu, dragon fruit, hibiscus, matcha, and lychee are being infused into fusion drinks to add unique and memorable flavor profiles. Not only do the ingredients introduce a new flavor but also vibrant colors and nice textures, giving the drink an overall sensory experience.
Innovative consumers are always looking for new and novel products that can provide them with something unique from the usual. By offering distinctive and unusual flavor profiles, companies can leverage this need for novelty and establish a customer base.
Social media has also contributed to this trend, with photogenic and Instagram-friendly drinks having the potential to go viral in a matter of time, creating consumer interest and demand. Influencers and bloggers also support such unusual beverages, contributing to their popularity and dissemination.
In addition to this, exotic flavors are also traced back to growing interest in wellness and health. Most distinctive ingredients like turmeric, ginger, and moringa have proven to improve one's health and are being used more and more in fusion drinks. The mixing of new tastes and functional attributes is appealing to health-conscious customers who want to indulge in a drink that not only tastes incredible but also caters to their wellness needs
Increasing sales of shrimp products through online platforms and e-commerce channels
Production of craft and premium fusion drinks is motivated by customers' rising desire for premium and distinctive drinking experiences. The drinks differentiate themselves from mass-produced ones on the basis of a dedication to craftsmanship, high-quality ingredients, and innovative flavorings.
Premium fusion drinks are set to contain rare fruits, alternative botanicals, and other exotic ingredients that appease sophisticated tastes. Rise of the "craft" trend in the food and beverage sector has also been one of the causes behind this trend, since consumers look for products that are representative of authenticity, originality, and personality.
Handcrafted fusion drinks are typically made in small quantities, which provides more attention to detail and control over quality. This is appealing to consumers who are concerned about sustainability, transparency, and ethics of production.
Most high-end fusion drink brands emphasize their organic, non-GMO, and sustainably produced ingredients, which appeals to eco-conscious and health-conscious consumers. Moreover, the packaging of these drinks also attests to their premium character in that they come with sophisticated designs and eco-friendly materials to complement their overall drinking experience.
Social media and the "Instagrammable" culture have also contributed to increasing demand for high-end and craft fusion beverages. Bright, visually stimulating drinks that are photogenic make for social media posts, inducing word-of-mouth through customers' willingness to share their experiences, especially among young consumers. The need is more of a drive with younger consumers who are experiential and are willing to pay a premium for products that promise something special.
Growing demand for organic and antibiotic-free shrimp products
The increasing demand for fusion alcoholic drinks, like cocktails and mocktails, lies in a plethora of fundamental causes. The increased consumer interest in innovative and extraordinary drinking experiences ranks among the greatest drivers.
Fusion drinks merge old-fashioned alcohol foundations with foreign components, flavors, and presentation techniques to produce novel and exciting drinks. For instance, cocktails can include tropical fruits, herbs, spices, and even new components such as edible flowers or smoked infusions, which provide an array of senses that experiential drinkers would be drawn to.
The second consideration of significant relevance is the return of the craft cocktail, and this is all about hand-crafting, quality, and creativity. Bartenders and mixologists are continually testing new ingredients and methods in a bid to push the boundaries of what can be done with a cocktail.
This has reopened old classic cocktails but with a modern touch, and also created completely new cocktails. Mocktails, or spirit cocktails, also catch on, fulfilling the same level and richness of experience without the alcohol. The trend also addresses the growing need for healthier and more inclusive drinking choices.
Social media is also at the core of the success of fusion alcoholic drinks. Visual, Instagram-worthy drinks bring in consumers, who, in turn, post their reviews of the experience on social media. This online visibility is significant in generating hype and demand for specialty cocktail and mocktail drinks. Popular culture and celebrity endorsement have also had a role, with celebrities and pop culture recognizing the distinctive fusion drinks.

The following table shows the estimated growth rates of the significant three geographies sales. USA and Germany are set to exhibit high consumption, recording CAGRs of 6.5% and 5.3% respectively, through 2035.
| Country | CAGR, 2025 to 2035 |
|---|---|
| USA | 6.5% |
| Germany | 5.3% |
| India | 10.2% |
The increasing demand of shrimp as a versatile seafood among consumers in the USA is caused by various reasons. The subtle taste and resilient texture of shrimp make it the favorite for numerous foods, from appetizers and salads to full courses and even snacks. Its adaptability to various cuisines, including American, Asian, and Mediterranean, also makes it more desirable to different tastes.
Besides, shrimp is also a healthy protein that is fat-free and rich in essential nutrients such as omega-3 fatty acids, vitamins, and minerals. This is appealing to consumers growing health awareness that demands healthy and balanced food. Expansion in the foodservice industry, including restaurants, fast-casual restaurants, and meal-delivery establishments, has also fueled demand for shrimp.
These restaurants usually have shrimp on their menus because of its popularity and versatility. Aquaculture technology has enhanced the art of shrimp farming, which provides a stable and sustainable supply to satisfy consumer demand. Shrimp has thus become a household staple in America, renowned for its culinary versatility and nutritional value.
Increased demand for convenient, ready-to-cook, and frozen shrimp foods is fueled by time-consuming lifestyles of modern consumers along with the demand for quick meal solutions. These foods provide the ease of having a quality protein source ready stored in the freezer without much preparation time.
The convenience of preparation and flexibility of frozen shrimp also make them a desirable product for individuals and households who need to prepare healthy meals without committing hours in the kitchen. On top of this, improvements in freezing technologies allowed the preservation of flavor, texture, and nutrient quality of the shrimp when they are frozen so frozen products become as desirable as fresh ones.
Ready-to-cook shrimp products, including pre-marinated, breaded, or seasoned varieties, add convenience by avoiding extensive preparation. The trend is also in line with increasing demands for healthy, easy-to-prepare foods that fit into busy lives. Consequently, the market for convenient, ready-to-cook, and frozen shrimp products is growing, serving consumers' interest in quick, tasty, and healthy food.
Key players like Charoen Pokphand Food PCL, Thai Union Frozen Products PLC, Marine Harvest ASA, and Nippon Suisan Kaisha, Ltd. dominate the global shrimp market. These companies lead thanks to their extensive aquaculture operations and global distribution networks. Pescanova S.A. and Baton Rouge Shrimp Company, Inc. are known for their quality branding and vertical integration. Regional powerhouses such as Gulf Shrimp Company, Labrador Fishermen's Union Shrimp Company, Omarosa S.A., and MSeafood Corp focus on specific supply chains and local expertise.
Emerging participants like Vinnbio India Pvt. Ltd, Artisanfish LLC, and Ristic GmbH cater to niche markets with sustainable farming methods and traceability. Barriers include disease outbreaks, feed costs, and regulatory complexity. Ongoing innovation includes recirculating aquaculture systems (RAS), AI-driven farming, and advanced hatchery feeds-such as Skretting’s Elevia-to boost production efficiency.
| Report Attributes | Details |
|---|---|
| Current Total Market Size (2025) | USD 70.09 billion |
| Projected Market Size (2035) | USD 151.32 billion |
| CAGR (2025 to 2035) | 8.0% |
| Base Year for Estimation | 2024 |
| Historical Period | 2020 to 2024 |
| Projections Period | 2025 to 2035 |
| Market Analysis Parameters | Revenue in USD billion/Volume in kilotons |
| By Species | Gulf Shrimps, Farmed Whiteleg Shrimps, Banded Coral Shrimps, Royal Red Shrimp, Giant Tiger Shrimps, Blue Shrimps, Ocean Shrimps |
| By Form | Canned, Breaded, Peeled, Cooked & Peeled, Shell-On, Frozen |
| By Source | Organic, Conventional |
| By Processing | Direct, Indirect |
| By Application | Food, Pharmaceutical, Cosmetics, Industrial, Biotechnology |
| Regions Covered | North America, Latin America, Western Europe, Eastern Europe, Balkans & Baltic, Russia & Belarus, Central Asia, East Asia, South Asia & Pacific, Middle East & Africa |
| Countries Covered | United States, Japan, Germany, India, United Kingdom, France, Italy, Brazil, Canada, South Korea, Australia, Spain, Netherlands, Saudi Arabia, Switzerland |
| Key Players | Charoen Pokphand Food PCL, The Clover Leaf Seafoods Family, Nippon Suisan Kaisha, Ltd., Marine Harvest ASA, Gulf Shrimp Company, Thai Union Frozen Products PLC, Baton Rouge Shrimp Company, Inc., Pescanova S.A., Labrador Fishermen's Union Shrimp Company Ltd., Omarosa S.A. |
| Additional Attributes | Dollar sales by value, market share analysis by region, country-wise analysis |
| Customization and Pricing | Available upon request |
As per species, the industry has been categorized into Gulf Shrimps, Farmed Whiteleg Shrimps, Banded Coral Shrimps, Royal Red Shrimp, Giant Tiger Shrimps, Blue Shrimps, and Ocean Shrimps.
As per form, the industry has been categorized into Canned, Breaded, Peeled, Cooked & Peeled, Shell-On, and Frozen.
This segment is further categorized into Organic, and Conventional.
This segment is further categorized into Direct, and Indirect (Modern Trade, Convenience Stores, Specialty Food Stores, Wholesale Stores, Discount Stores, Online Retail, and Other Retail Formats).
As per application, the industry has been categorized into Food, Pharmaceutical, Cosmetics, Industrial, and Biotechnology.
The market is analyzed across North America, Latin America, Western Europe, Eastern Europe, South Asia & Pacific, East Asia, Central Asia, Balkan and Baltic countries, Russia and Belarus, and the Middle East & Africa.
The shrimp market is projected to reach USD 151.32 billion by 2035, growing from USD 70.09 billion in 2025 at a CAGR of 8.0% over the forecast period.
The canned shrimp segment holds the largest market share, accounting for approximately 80% of the global value in 2025, driven by its long shelf life and convenience.
Gulf shrimp is expected to lead the market with a 53% share in 2025, owing to its premium taste, traceability, and sustainable harvesting practices in the Gulf of Mexico.
The organic shrimp segment is anticipated to grow at a CAGR of 9.3% between 2025 and 2035, fueled by rising demand for antibiotic-free and eco-labeled seafood products.
India is expected to grow at a CAGR of 10.2%, while the USA is projected to grow at 6.5% through 2035, supported by rising protein consumption and modern aquaculture expansion.


Full Research Suite comprises of:
Market outlook & trends analysis
Interviews & case studies
Strategic recommendations
Vendor profiles & capabilities analysis
5-year forecasts
8 regions and 60+ country-level data splits
Market segment data splits
12 months of continuous data updates
DELIVERED AS:
PDF EXCEL ONLINE
Shrimps Disease Diagnostics Market Size and Share Forecast Outlook 2025 to 2035
Shrimp Feed Market Analysis - Size, Share, and Forecast Outlook 2025 to 2035
Examining Shrimp Market Share Trends & Industry Leaders
UK Shrimp Market Insights – Growth, Demand & Forecast 2025-2035
USA Shrimp Market Insights – Demand, Size & Industry Trends 2025–2035
ASEAN Shrimp Market Trends – Growth, Demand & Forecast 2025–2035
Korea Shrimp Market Analysis by Species, Source, Form, Sales Channel, Application, and Region Through 2035
Japan Shrimp Market Analysis by Species, Source, Form, Sales Channel, Application, and Region Through 2035
Europe Shrimp Market Outlook – Share, Growth & Forecast 2025–2035
Australia Shrimp Market Outlook – Size, Share & Forecast 2025-2035
Demand for Shrimp in the EU Size and Share Forecast Outlook 2025 to 2035
Plant-Based Shrimp Market Size and Share Forecast Outlook 2025 to 2035
Latin America Shrimp Market Report – Trends, Growth & Forecast 2025–2035
Western Europe Shrimp Market Analysis by Species, Source, Form, Sales Channel, Application, and Country Through 2035

Thank you!
You will receive an email from our Business Development Manager. Please be sure to check your SPAM/JUNK folder too.
Chat With
MaRIA