Shrimp Feed Market Size and Share Forecast Outlook 2025 to 2035

The global shrimp feed market is projected to grow from USD 4.3 billion in 2025 to USD 6.4 billion by 2035, registering a CAGR of 4%.
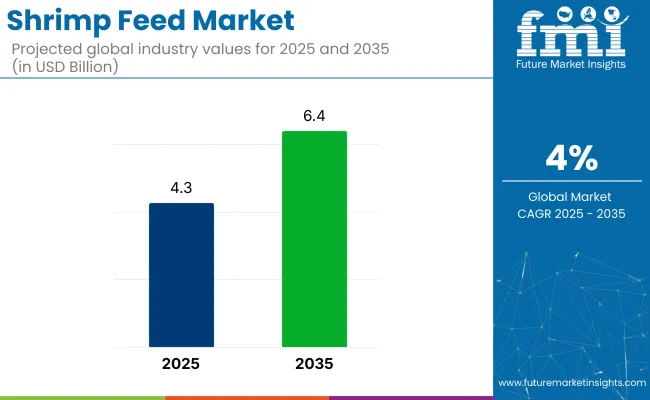
Quick Stats for Shrimp Feed Market

  • Market Value (2025): USD 4.3 billion
  • Forecast Value (2035): USD 6.4 billion
  • Forecast CAGR: 4%
  • Ingredient Type Leader in 2025: Protein Sources (40% share)
  • Top Functionality Segment: Growth Promotion (38% share)
  • Key Growth Region: East Asia (Japan is the fastest-growing market with a 4.5% CAGR)

Shrimp Feed Market

Metric Value
Industry Size (2025E) USD 4.3 billion
Industry Value (2035F) USD 6.4 billion
CAGR (2025 to 2035) 4%

The market expansion is driven by rising aquaculture production, demand for high-quality seafood, and adoption of precision nutrition to improve shrimp health and yields. Sustainable feed formulations, functional ingredients such as probiotics and prebiotics, and precision feeding technologies are gaining traction to enhance feed efficiency and reduce environmental impacts, driving broader market adoption.

The market holds an estimated 18% share of aquaculture feed, highlighting its critical role in farmed seafood nutrition. It accounts for around 6% of the broader animal feed market, focused primarily on aquatic species rather than livestock. Within the seafood industry, it contributes 2%, reflecting its upstream role in production inputs. However, in the vast food and beverage industry, its share is minimal at below 0.1%.

Government regulations impacting the market focus on ensuring feed safety, environmental sustainability, and reduced antibiotic use. In Japan, strict Food Sanitation Law standards mandate that feeds must be free from harmful residues and contaminants. The USA enforces FDA guidelines under the Food Safety Modernization Act (FSMA) to ensure safe feed manufacturing and handling.

In the European Union, including Germany, France, and the UK, regulations under EC 767/2009 govern feed additive approvals, labelling, and traceability, promoting sustainable and functional feeds. These policies encourage manufacturers to adopt probiotics, prebiotics, and natural additives to enhance shrimp health responsibly.

Japan is projected to be the fastest-growing market, expected to expand at a CAGR of 4.5% from 2025 to 2035. Protein sources will lead the ingredient type segment with a 40% market share due to their high protein density and cost-effectiveness, while growth promotion will dominate the functionality segment with a 38% share. The USA and Germany markets are also expected to grow steadily at CAGRs of 4% and 4.1%, respectively.

Shrimp Feed Market Analysis by Top Investment Segments

The market is segmented by ingredient type, functionality, and region. By ingredient type, the market is divided into protein sources, lipids, carbohydrates, and additives. Based on functionality, the market is segmented into growth promotion, disease prevention, color enhancement, digestive health support, and breeding & reproduction (immunity enhancement, stress tolerance, shell hardening, metabolic regulation). Regionally, the market is classified into North America, Latin America, Western Europe, Eastern Europe, East Asia, South Asia & Pacific, Central Asia, Russia & Belarus, Balkans & Baltic, and Middle East & Africa.

Protein Sources to Lead the Ingredient Type Segment with 40% Market Share

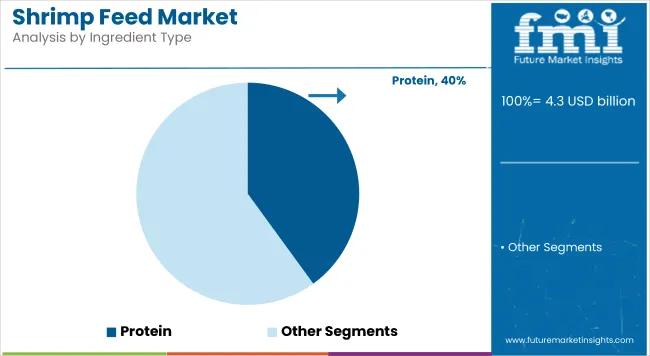
Protein sources are projected to lead the ingredient type segment, accounting for 40% of the global market share by 2025. Soybean meal and fishmeal are widely used due to their high protein content and digestibility.
  • Soybean meal remains dominant as a cost-effective protein with essential amino acids for optimal shrimp growth.
  • Fishmeal continues as a premium protein source, especially in high-value formulations, though sustainability concerns are prompting partial replacements.
Shrimp Feed Market By Ingredient Type

Growth Promotion to Lead the Functionality Segment with 38% Market Share

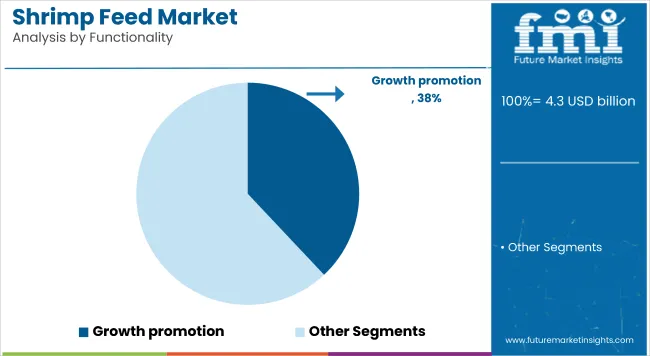
Growth promotion is expected to dominate the functionality segment, accounting for 38% of the market share by 2025. These include additives such as probiotics, prebiotics, enzymes, and essential nutrients that enhance animal growth, feed efficiency, and overall health.
  • These feeds are formulated with balanced nutrients to enhance shrimp growth rates, size, and feed conversion ratios.
  • Rising demand for efficient aquaculture operations and improved profitability supports this segment’s growth.

Shrimp Feed Market By Functionality

Top Shrimp Feed Market Dynamics

The global shrimp feed market is experiencing steady growth, driven by rising demand for high-quality seafood and increased aquaculture production worldwide. Shrimp feed plays a crucial role in ensuring optimal growth, health, and survival of farmed shrimp, thereby supporting profitability and sustainability in aquaculture operations.

Recent Trends in the Shrimp Feed Market

  • Precision feeding and smart aquaculture systems boost feed efficiency, cut waste, and improve shrimp growth and health.
  • Use of probiotics, prebiotics, and herbs is rising to boost shrimp immunity and reduce antibiotic use.

Challenges in the Shrimp Feed Market

  • High costs of premium feeds with advanced additives limit adoption by small-scale farmers.
  • Fluctuating raw material prices and disease outbreaks hinder consistent feed quality and supply chain stability.

Top Countries Manufacturing, Formulating, Regulating, and Generating Demand for Shrimp Feed

Japan leads shrimp feed production with a focus on precision nutrition, functional additives, and automated aquaculture systems. Major feed formulators have optimized protein and micronutrient profiles to align with Japan’s domestic shrimp farming standards and traceability frameworks. In Germany and France, annual growth of 4.1% each has been driven by compliance with EU feed additive directives, antibiotic restrictions, and a shift toward non-GMO feed formulations.

The USA shrimp feed market is expected to expand at a 4% CAGR, supported by recirculating aquaculture systems (RAS) and increasing inland shrimp production in states like Texas and Florida. The UK is recording a CAGR of 3.9%, with demand shaped by feed innovation targeting cold-water shrimp species and Brexit-aligned aquaculture policies.

The report covers an in-depth analysis of 40 plus countries; five top-performing OECD countries are highlighted below.

In-depth Analysis of Shrimp Feed Demand in Japan

The Japan shrimp feed revenue is growing at a CAGR of 4.5% from 2025 to 2035. Growth is driven by high-quality seafood demands in domestic and export markets and adoption of feeds with precision nutrition for optimal shrimp growth and health.

  • High demand for functional feeds with immune boosters and probiotics.
  • Preference for sustainable protein sources and precision formulations.

Growth Outlook for Shrimp Feed in Germany

The sales of shrimp feed in Germany are expected to expand at a CAGR of 4.1% during the forecast period. Growth is driven by stringent EU food safety standards, sustainability goals, and regulations on feed additive approvals and usage.

  • Strong EU compliance pressures on feed safety and traceability.
  • Focus on premium feed formulations with functional additives.

Demand Trajectory for Shrimp Feed in France

The French shrimp feed market is projected to grow at a 4.1% CAGR during the forecast period. Demand is driven by national food safety standards, environmental protection policies, and sustainable aquaculture initiatives.

  • High adoption of feeds with natural additives and immune enhancers.
  • Preference for sustainable formulations aligned with EU standards.

Analysis of Shrimp Feed in the USA

The USA shrimp feed market is projected to grow at a 4% CAGR from 2025 to 2035. Growth is driven by feed innovations, sustainability certifications, and a shift toward efficiency in shrimp farming.

  • Strong demand for sustainable, certified feed formulations.
  • Focus on enhancing feed conversion ratios and shrimp health.

Shrimp Feed Trends in the UK

The UK shrimp feed revenue is projected to grow at a CAGR of 3.9% from 2025 to 2035. Growth is driven by premium seafood export demand and regulatory standards for feed safety and sustainability.
  • Focus on premium feed formulations for export-quality shrimp.
  • Rising interest in functional and sustainable feed ingredients.

Leading Shrimp Feed Suppliers and Manufacturers

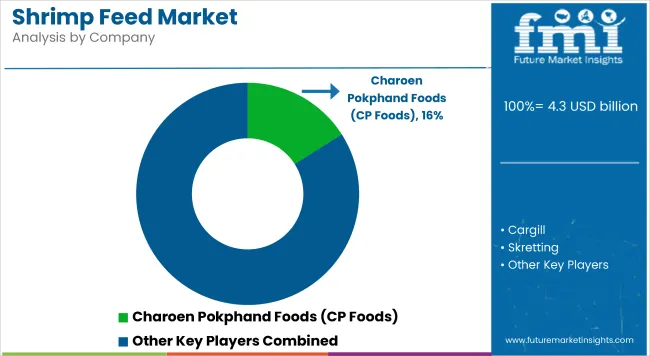
Shrimp Feed Market By Company

The market is moderately consolidated, with leading players like Charoen Pokphand Foods (CP Foods), Cargill, Skretting, Nutreco N.V., and BioMar Group dominating the industry. These companies provide advanced, nutritionally balanced shrimp feed catering to species such as Whiteleg shrimp and Tiger shrimp across aquaculture farms globally. Charoen Pokphand Foods (CP Foods) focuses on high-quality feed formulations ensuring rapid shrimp growth, while Cargill specializes in sustainable feeds enriched with probiotics and prebiotics.

These companies offer a range of specialized shrimp feed solutions focused on health, performance, and sustainability.Other key players like Guangdong Yuehai Feed Group Co., Ltd., BernAqua, Zeigler Bros., Inc., ADM (Archer Daniels Midland), and Aller Aqua contribute by providing specialized, high-performance shrimp feeds for hatcheries and farms globally.

Recent Shrimp Feed Industry News

  • In July 2024, Nutreco announced the start of commercial operations at the world’s first food-grade powder facility for cell feed in Boxmeer, Netherlands. The plant produces a specialized cell feed developed exclusively for the cultivated meat industry.

Shrimp Feed Market Report Scope

Report Attributes Details
Market Size (2025) USD 4.3 billion
Projected Market Size (2035) USD 6.4 billion
CAGR (2025 to 2035) 4%
Base Year for Estimation 2024
Historical Period 2020 to 2024
Projections Period 2025 to 2035
Report Parameter USD billion for value/volume in metric tons
By Ingredient Type Protein Sources, Lipids, Carbohydrates, and Additives
By Functionality Growth Promotion, Disease Prevention, Color Enhancement, Digestive Health Support, Breeding & Reproduction, and Others (Immunity Enhancement, Stress Tolerance, Shell Hardening, Metabolic Regulation)
Regions Covered North America, Latin America, Western Europe, Eastern Europe, East Asia, South Asia & Pacific, Central Asia, Russia & Belarus, Balkan & Baltic Countries, and Middle East & Africa
Countries Covered United States, Canada, United Kingdom, Germany, France, China, Japan, South Korea, Brazil, Australia
Key Players Influencing the Market Charoen Pokphand Foods (CP Foods), Cargill, Skretting, Nutreco N.V., BioMar Group, Guangdong Yuehai Feed Group Co., Ltd., BernAqua, Zeigler Bros., Inc., ADM (Archer Daniels Midland), Aller Aqua
Additional Attributes Dollar sales by ingredient type, share by functionality, regional demand growth, regulatory influence, precision feeding trends, competitive benchmarking

Key Segments

By Ingredient Type:

As per product type, the industry has been categorized into Protein Sources, Lipids, Carbohydrates, and Additives. Binders and Stabilizers

By Functionality:

As per ingredient type, the industry has been categorized into Growth Promotion, Disease Prevention, Color Enhancement, Digestive Health support, Breeding and Reproduction, and Others.

By Region:

Industry analysis has been carried out in key countries of North America, Latin America, Western Europe, Eastern Europe, East Asia, South Asia & Pacific, Central Asia, Russia & Belarus, Balkans & Baltic Countries, and Middle East & Africa.

Table of Content

  1. Executive Summary
    • Global Market Outlook
    • Demand-side Trends
    • Supply-side Trends
    • Technology Roadmap Analysis
    • Analysis and Recommendations
  2. Market Overview
    • Market Coverage / Taxonomy
    • Market Definition / Scope / Limitations
  3. Market Background
    • Market Dynamics
      • Drivers
      • Restraints
      • Opportunity
      • Trends
    • Scenario Forecast
      • Demand in Optimistic Scenario
      • Demand in Likely Scenario
      • Demand in Conservative Scenario
    • Opportunity Map Analysis
    • Product Life Cycle Analysis
    • Supply Chain Analysis
      • Supply Side Participants and their Roles
        • Producers
        • Mid-Level Participants (Traders/ Agents/ Brokers)
        • Wholesalers and Distributors
      • Value Added and Value Created at Node in the Supply Chain
      • List of Raw Material Suppliers
      • List of Existing and Potential Buyer’s
    • Investment Feasibility Matrix
    • Value Chain Analysis
      • Profit Margin Analysis
      • Wholesalers and Distributors
      • Retailers
    • PESTLE and Porter’s Analysis
    • Regulatory Landscape
      • By Key Regions
      • By Key Countries
    • Regional Parent Market Outlook
    • Production and Consumption Statistics
    • Import and Export Statistics
  4. Global Market Analysis 2020 to 2024 and Forecast, 2025 to 2035
    • Historical Market Size Value (USD Billion) & Volume (Metric Tons) Analysis, 2020 to 2024
    • Current and Future Market Size Value (USD Billion) & Volume (Metric Tons) Projections, 2025 to 2035
      • Y-o-Y Growth Trend Analysis
      • Absolute $ Opportunity Analysis
  5. Global Market Pricing Analysis 2020 to 2024 and Forecast 2025 to 2035
  6. Global Market Analysis 2020 to 2024 and Forecast 2025 to 2035, By Ingredient Type
    • Introduction / Key Findings
    • Historical Market Size Value (USD Billion) & Volume (Metric Tons) Analysis By Ingredient Type, 2020 to 2024
    • Current and Future Market Size Value (USD Billion) & Volume (Metric Tons) Analysis and Forecast By Ingredient Type, 2025 to 2035
      • Protein Sources
      • Lipids
      • Carbohydrates
      • Additives
    • Y-o-Y Growth Trend Analysis By Ingredient Type, 2020 to 2024
    • Absolute $ Opportunity Analysis By Ingredient Type, 2025 to 2035
  7. Global Market Analysis 2020 to 2024 and Forecast 2025 to 2035, By Functionality
    • Introduction / Key Findings
    • Historical Market Size Value (USD Billion) & Volume (Metric Tons) Analysis By Functionality, 2020 to 2024
    • Current and Future Market Size Value (USD Billion) & Volume (Metric Tons) Analysis and Forecast By Functionality, 2025 to 2035
      • Growth Promotion
      • Disease Prevention
      • Color Enhancement
      • Digestive Health Support
      • Breeding and Reproduction
      • Others (Immune System Boost, Water Quality Management, Stress Reduction, And Anti-Fungal and Anti-Bacterial Properties.)
    • Y-o-Y Growth Trend Analysis By Functionality, 2020 to 2024
    • Absolute $ Opportunity Analysis By Functionality, 2025 to 2035
  8. Global Market Analysis 2020 to 2024 and Forecast 2025 to 2035, By Region
    • Introduction
    • Historical Market Size Value (USD Billion) & Volume (Metric Tons) Analysis By Region, 2020 to 2024
    • Current Market Size Value (USD Billion) & Volume (Metric Tons) Analysis and Forecast By Region, 2025 to 2035
      • North America
      • Latin America
      • Western Europe
      • Eastern Europe
      • East Asia
      • South Asia & Pacific
      • Middle East and Africa
    • Market Attractiveness Analysis By Region
  9. North America Market Analysis 2020 to 2024 and Forecast 2025 to 2035, By Country
    • Historical Market Size Value (USD Billion) & Volume (Metric Tons) Trend Analysis By Market Taxonomy, 2020 to 2024
    • Market Size Value (USD Billion) & Volume (Metric Tons) Forecast By Market Taxonomy, 2025 to 2035
      • By Country
        • USA
        • Canada
        • Mexico
      • By Ingredient Type
      • By Functionality
    • Market Attractiveness Analysis
      • By Country
      • By Ingredient Type
      • By Functionality
    • Key Takeaways
  10. Latin America Market Analysis 2020 to 2024 and Forecast 2025 to 2035, By Country
    • Historical Market Size Value (USD Billion) & Volume (Metric Tons) Trend Analysis By Market Taxonomy, 2020 to 2024
    • Market Size Value (USD Billion) & Volume (Metric Tons) Forecast By Market Taxonomy, 2025 to 2035
      • By Country
        • Brazil
        • Argentina
        • Rest of LATAM
      • By Ingredient Type
      • By Functionality
    • Market Attractiveness Analysis
      • By Country
      • By Ingredient Type
      • By Functionality
    • Key Takeaways
  11. Western Europe Market Analysis 2020 to 2024 and Forecast 2025 to 2035, By Country
    • Historical Market Size Value (USD Billion) & Volume (Metric Tons) Trend Analysis By Market Taxonomy, 2020 to 2024
    • Market Size Value (USD Billion) & Volume (Metric Tons) Forecast By Market Taxonomy, 2025 to 2035
      • By Country
        • Germany
        • Italy
        • France
        • UK
        • Spain
        • BENELUX
        • Nordic
        • Rest of W.Europe
      • By Ingredient Type
      • By Functionality
    • Market Attractiveness Analysis
      • By Country
      • By Ingredient Type
      • By Functionality
    • Key Takeaways
  12. Eastern Europe Market Analysis 2020 to 2024 and Forecast 2025 to 2035, By Country
    • Historical Market Size Value (USD Billion) & Volume (Metric Tons) Trend Analysis By Market Taxonomy, 2020 to 2024
    • Market Size Value (USD Billion) & Volume (Metric Tons) Forecast By Market Taxonomy, 2025 to 2035
      • By Country
        • Russia
        • Hungary
        • Poland
        • Balkan & Baltics
        • Rest of E. Europe
      • By Ingredient Type
      • By Functionality
    • Market Attractiveness Analysis
      • By Country
      • By Ingredient Type
      • By Functionality
    • Key Takeaways
  13. East Asia Market Analysis 2020 to 2024 and Forecast 2025 to 2035, By Country
    • Historical Market Size Value (USD Billion) & Volume (Metric Tons) Trend Analysis By Market Taxonomy, 2020 to 2024
    • Market Size Value (USD Billion) & Volume (Metric Tons) Forecast By Market Taxonomy, 2025 to 2035
      • By Country
        • China
        • Japan
        • South Korea
      • By Ingredient Type
      • By Functionality
    • Market Attractiveness Analysis
      • By Country
      • By Ingredient Type
      • By Functionality
    • Key Takeaways
  14. South Asia & Pacific Market Analysis 2020 to 2024 and Forecast 2025 to 2035, By Country
    • Historical Market Size Value (USD Billion) & Volume (Metric Tons) Trend Analysis By Market Taxonomy, 2020 to 2024
    • Market Size Value (USD Billion) & Volume (Metric Tons) Forecast By Market Taxonomy, 2025 to 2035
      • By Country
        • India
        • Australia & New Zealand
        • ASEAN
        • Rest of SAP
      • By Ingredient Type
      • By Functionality
    • Market Attractiveness Analysis
      • By Country
      • By Ingredient Type
      • By Functionality
    • Key Takeaways
  15. Middle East and Africa Market Analysis 2020 to 2024 and Forecast 2025 to 2035, By Country
    • Historical Market Size Value (USD Billion) & Volume (Metric Tons) Trend Analysis By Market Taxonomy, 2020 to 2024
    • Market Size Value (USD Billion) & Volume (Metric Tons) Forecast By Market Taxonomy, 2025 to 2035
      • By Country
        • GCC Countries
        • Northern Africa
        • South Africa
        • Turkiye
        • Rest of MEA
      • By Ingredient Type
      • By Functionality
    • Market Attractiveness Analysis
      • By Country
      • By Ingredient Type
      • By Functionality
    • Key Takeaways
  16. Key Countries Market Analysis
    • USA
      • Pricing Analysis
      • Market Share Analysis, 2024
        • By Ingredient Type
        • By Functionality
    • Canada
      • Pricing Analysis
      • Market Share Analysis, 2024
        • By Ingredient Type
        • By Functionality
    • Brazil
      • Pricing Analysis
      • Market Share Analysis, 2024
        • By Ingredient Type
        • By Functionality
    • Mexico
      • Pricing Analysis
      • Market Share Analysis, 2024
        • By Ingredient Type
        • By Functionality
    • Argentina
      • Pricing Analysis
      • Market Share Analysis, 2024
        • By Ingredient Type
        • By Functionality
  17. Market Structure Analysis
    • Competition Dashboard
    • Competition Benchmarking
    • Market Share Analysis of Top Players
      • By Regional
      • By Ingredient Type
      • By Functionality
  18. Competition Analysis
    • Competition Deep Dive
      • Charoen Pokphand Foods (CP Foods)
        • Overview
        • Product Portfolio
        • Profitability by Market Segments (Product/Age /Sales Channel/Region)
        • Sales Footprint
        • Strategy Overview
          • Marketing Strategy
          • Product Strategy
          • Channel Strategy
      • Cargill
        • Overview
        • Product Portfolio
        • Profitability by Market Segments (Product/Age /Sales Channel/Region)
        • Sales Footprint
        • Strategy Overview
          • Marketing Strategy
          • Product Strategy
          • Channel Strategy
      • Skretting
        • Overview
        • Product Portfolio
        • Profitability by Market Segments (Product/Age /Sales Channel/Region)
        • Sales Footprint
        • Strategy Overview
          • Marketing Strategy
          • Product Strategy
          • Channel Strategy
      • Nutreco N.V.
        • Overview
        • Product Portfolio
        • Profitability by Market Segments (Product/Age /Sales Channel/Region)
        • Sales Footprint
        • Strategy Overview
          • Marketing Strategy
          • Product Strategy
          • Channel Strategy
      • BioMar Group
        • Overview
        • Product Portfolio
        • Profitability by Market Segments (Product/Age /Sales Channel/Region)
        • Sales Footprint
        • Strategy Overview
          • Marketing Strategy
          • Product Strategy
          • Channel Strategy
      • Guangdong Yuehai Feed Group Co., Ltd.
        • Overview
        • Product Portfolio
        • Profitability by Market Segments (Product/Age /Sales Channel/Region)
        • Sales Footprint
        • Strategy Overview
          • Marketing Strategy
          • Product Strategy
          • Channel Strategy
      • BernAqua
        • Overview
        • Product Portfolio
        • Profitability by Market Segments (Product/Age /Sales Channel/Region)
        • Sales Footprint
        • Strategy Overview
          • Marketing Strategy
          • Product Strategy
          • Channel Strategy
      • Zeigler Bros., Inc.
        • Overview
        • Product Portfolio
        • Profitability by Market Segments (Product/Age /Sales Channel/Region)
        • Sales Footprint
        • Strategy Overview
          • Marketing Strategy
          • Product Strategy
          • Channel Strategy
      • ADM (Archer Daniels Midland)
        • Overview
        • Product Portfolio
        • Profitability by Market Segments (Product/Age /Sales Channel/Region)
        • Sales Footprint
        • Strategy Overview
          • Marketing Strategy
          • Product Strategy
          • Channel Strategy
      • Aller Aqua
        • Overview
        • Product Portfolio
        • Profitability by Market Segments (Product/Age /Sales Channel/Region)
        • Sales Footprint
        • Strategy Overview
          • Marketing Strategy
          • Product Strategy
          • Channel Strategy
  19. Assumptions & Acronyms Used
  20. Research Methodology

List of Tables

  • Table 1: Global Market Value (USD Billion) Forecast by Region, 2020-2035
  • Table 2: Global Market Volume (Metric Tons) Forecast by Region, 2020-2035
  • Table 3: Global Market Value (USD Billion) Forecast by Ingredient Type, 2020-2035
  • Table 4: Global Market Volume (Metric Tons) Forecast by Ingredient Type, 2020-2035
  • Table 5: Global Market Value (USD Billion) Forecast by Functionality, 2020-2035
  • Table 6: Global Market Volume (Metric Tons) Forecast by Functionality, 2020-2035
  • Table 7: North America Market Value (USD Billion) Forecast by Country, 2020-2035
  • Table 8: North America Market Volume (Metric Tons) Forecast by Country, 2020-2035
  • Table 9: North America Market Value (USD Billion) Forecast by Ingredient Type, 2020-2035
  • Table 10: North America Market Volume (Metric Tons) Forecast by Ingredient Type, 2020-2035
  • Table 11: North America Market Value (USD Billion) Forecast by Functionality, 2020-2035
  • Table 12: North America Market Volume (Metric Tons) Forecast by Functionality, 2020-2035
  • Table 13: Latin America Market Value (USD Billion) Forecast by Country, 2020-2035
  • Table 14: Latin America Market Volume (Metric Tons) Forecast by Country, 2020-2035
  • Table 15: Latin America Market Value (USD Billion) Forecast by Ingredient Type, 2020-2035
  • Table 16: Latin America Market Volume (Metric Tons) Forecast by Ingredient Type, 2020-2035
  • Table 17: Latin America Market Value (USD Billion) Forecast by Functionality, 2020-2035
  • Table 18: Latin America Market Volume (Metric Tons) Forecast by Functionality, 2020-2035
  • Table 19: Western Europe Market Value (USD Billion) Forecast by Country, 2020-2035
  • Table 20: Western Europe Market Volume (Metric Tons) Forecast by Country, 2020-2035
  • Table 21: Western Europe Market Value (USD Billion) Forecast by Ingredient Type, 2020-2035
  • Table 22: Western Europe Market Volume (Metric Tons) Forecast by Ingredient Type, 2020-2035
  • Table 23: Western Europe Market Value (USD Billion) Forecast by Functionality, 2020-2035
  • Table 24: Western Europe Market Volume (Metric Tons) Forecast by Functionality, 2020-2035
  • Table 25: Eastern Europe Market Value (USD Billion) Forecast by Country, 2020-2035
  • Table 26: Eastern Europe Market Volume (Metric Tons) Forecast by Country, 2020-2035
  • Table 27: Eastern Europe Market Value (USD Billion) Forecast by Ingredient Type, 2020-2035
  • Table 28: Eastern Europe Market Volume (Metric Tons) Forecast by Ingredient Type, 2020-2035
  • Table 29: Eastern Europe Market Value (USD Billion) Forecast by Functionality, 2020-2035
  • Table 30: Eastern Europe Market Volume (Metric Tons) Forecast by Functionality, 2020-2035
  • Table 31: East Asia Market Value (USD Billion) Forecast by Country, 2020-2035
  • Table 32: East Asia Market Volume (Metric Tons) Forecast by Country, 2020-2035
  • Table 33: East Asia Market Value (USD Billion) Forecast by Ingredient Type, 2020-2035
  • Table 34: East Asia Market Volume (Metric Tons) Forecast by Ingredient Type, 2020-2035
  • Table 35: East Asia Market Value (USD Billion) Forecast by Functionality, 2020-2035
  • Table 36: East Asia Market Volume (Metric Tons) Forecast by Functionality, 2020-2035
  • Table 37: South Asia & Pacific Market Value (USD Billion) Forecast by Country, 2020-2035
  • Table 38: South Asia & Pacific Market Volume (Metric Tons) Forecast by Country, 2020-2035
  • Table 39: South Asia & Pacific Market Value (USD Billion) Forecast by Ingredient Type, 2020-2035
  • Table 40: South Asia & Pacific Market Volume (Metric Tons) Forecast by Ingredient Type, 2020-2035
  • Table 41: South Asia & Pacific Market Value (USD Billion) Forecast by Functionality, 2020-2035
  • Table 42: South Asia & Pacific Market Volume (Metric Tons) Forecast by Functionality, 2020-2035
  • Table 43: Middle East and Africa Market Value (USD Billion) Forecast by Country, 2020-2035
  • Table 44: Middle East and Africa Market Volume (Metric Tons) Forecast by Country, 2020-2035
  • Table 45: Middle East and Africa Market Value (USD Billion) Forecast by Ingredient Type, 2020-2035
  • Table 46: Middle East and Africa Market Volume (Metric Tons) Forecast by Ingredient Type, 2020-2035
  • Table 47: Middle East and Africa Market Value (USD Billion) Forecast by Functionality, 2020-2035
  • Table 48: Middle East and Africa Market Volume (Metric Tons) Forecast by Functionality, 2020-2035

List of Figures

  • Figure 1: Global Market Volume (Metric Tons) Forecast 2020-2035
  • Figure 2: Global Market Pricing Analysis
  • Figure 3: Global Market Value (USD Billion) Forecast 2020-2035
  • Figure 4: Global Market Value Share and BPS Analysis by Ingredient Type, 2025 and 2035
  • Figure 5: Global Market Y-o-Y Growth Comparison by Ingredient Type, 2025-2035
  • Figure 6: Global Market Attractiveness Analysis by Ingredient Type
  • Figure 7: Global Market Value Share and BPS Analysis by Functionality, 2025 and 2035
  • Figure 8: Global Market Y-o-Y Growth Comparison by Functionality, 2025-2035
  • Figure 9: Global Market Attractiveness Analysis by Functionality
  • Figure 10: Global Market Value (USD Billion) Share and BPS Analysis by Region, 2025 and 2035
  • Figure 11: Global Market Y-o-Y Growth Comparison by Region, 2025-2035
  • Figure 12: Global Market Attractiveness Analysis by Region
  • Figure 13: North America Market Incremental $ Opportunity, 2025-2035
  • Figure 14: Latin America Market Incremental $ Opportunity, 2025-2035
  • Figure 15: Western Europe Market Incremental $ Opportunity, 2025-2035
  • Figure 16: Eastern Europe Market Incremental $ Opportunity, 2025-2035
  • Figure 17: East Asia Market Incremental $ Opportunity, 2025-2035
  • Figure 18: South Asia & Pacific Market Incremental $ Opportunity, 2025-2035
  • Figure 19: Middle East and Africa Market Incremental $ Opportunity, 2025-2035
  • Figure 20: North America Market Value Share and BPS Analysis by Country, 2025 and 2035
  • Figure 21: North America Market Value Share and BPS Analysis by Ingredient Type, 2025 and 2035
  • Figure 22: North America Market Y-o-Y Growth Comparison by Ingredient Type, 2025-2035
  • Figure 23: North America Market Attractiveness Analysis by Ingredient Type
  • Figure 24: North America Market Value Share and BPS Analysis by Functionality, 2025 and 2035
  • Figure 25: North America Market Y-o-Y Growth Comparison by Functionality, 2025-2035
  • Figure 26: North America Market Attractiveness Analysis by Functionality
  • Figure 27: Latin America Market Value Share and BPS Analysis by Country, 2025 and 2035
  • Figure 28: Latin America Market Value Share and BPS Analysis by Ingredient Type, 2025 and 2035
  • Figure 29: Latin America Market Y-o-Y Growth Comparison by Ingredient Type, 2025-2035
  • Figure 30: Latin America Market Attractiveness Analysis by Ingredient Type
  • Figure 31: Latin America Market Value Share and BPS Analysis by Functionality, 2025 and 2035
  • Figure 32: Latin America Market Y-o-Y Growth Comparison by Functionality, 2025-2035
  • Figure 33: Latin America Market Attractiveness Analysis by Functionality
  • Figure 34: Western Europe Market Value Share and BPS Analysis by Country, 2025 and 2035
  • Figure 35: Western Europe Market Value Share and BPS Analysis by Ingredient Type, 2025 and 2035
  • Figure 36: Western Europe Market Y-o-Y Growth Comparison by Ingredient Type, 2025-2035
  • Figure 37: Western Europe Market Attractiveness Analysis by Ingredient Type
  • Figure 38: Western Europe Market Value Share and BPS Analysis by Functionality, 2025 and 2035
  • Figure 39: Western Europe Market Y-o-Y Growth Comparison by Functionality, 2025-2035
  • Figure 40: Western Europe Market Attractiveness Analysis by Functionality
  • Figure 41: Eastern Europe Market Value Share and BPS Analysis by Country, 2025 and 2035
  • Figure 42: Eastern Europe Market Value Share and BPS Analysis by Ingredient Type, 2025 and 2035
  • Figure 43: Eastern Europe Market Y-o-Y Growth Comparison by Ingredient Type, 2025-2035
  • Figure 44: Eastern Europe Market Attractiveness Analysis by Ingredient Type
  • Figure 45: Eastern Europe Market Value Share and BPS Analysis by Functionality, 2025 and 2035
  • Figure 46: Eastern Europe Market Y-o-Y Growth Comparison by Functionality, 2025-2035
  • Figure 47: Eastern Europe Market Attractiveness Analysis by Functionality
  • Figure 48: East Asia Market Value Share and BPS Analysis by Country, 2025 and 2035
  • Figure 49: East Asia Market Value Share and BPS Analysis by Ingredient Type, 2025 and 2035
  • Figure 50: East Asia Market Y-o-Y Growth Comparison by Ingredient Type, 2025-2035
  • Figure 51: East Asia Market Attractiveness Analysis by Ingredient Type
  • Figure 52: East Asia Market Value Share and BPS Analysis by Functionality, 2025 and 2035
  • Figure 53: East Asia Market Y-o-Y Growth Comparison by Functionality, 2025-2035
  • Figure 54: East Asia Market Attractiveness Analysis by Functionality
  • Figure 55: South Asia & Pacific Market Value Share and BPS Analysis by Country, 2025 and 2035
  • Figure 56: South Asia & Pacific Market Value Share and BPS Analysis by Ingredient Type, 2025 and 2035
  • Figure 57: South Asia & Pacific Market Y-o-Y Growth Comparison by Ingredient Type, 2025-2035
  • Figure 58: South Asia & Pacific Market Attractiveness Analysis by Ingredient Type
  • Figure 59: South Asia & Pacific Market Value Share and BPS Analysis by Functionality, 2025 and 2035
  • Figure 60: South Asia & Pacific Market Y-o-Y Growth Comparison by Functionality, 2025-2035
  • Figure 61: South Asia & Pacific Market Attractiveness Analysis by Functionality
  • Figure 62: Middle East and Africa Market Value Share and BPS Analysis by Country, 2025 and 2035
  • Figure 63: Middle East and Africa Market Value Share and BPS Analysis by Ingredient Type, 2025 and 2035
  • Figure 64: Middle East and Africa Market Y-o-Y Growth Comparison by Ingredient Type, 2025-2035
  • Figure 65: Middle East and Africa Market Attractiveness Analysis by Ingredient Type
  • Figure 66: Middle East and Africa Market Value Share and BPS Analysis by Functionality, 2025 and 2035
  • Figure 67: Middle East and Africa Market Y-o-Y Growth Comparison by Functionality, 2025-2035
  • Figure 68: Middle East and Africa Market Attractiveness Analysis by Functionality
  • Figure 69: Global Market - Tier Structure Analysis
  • Figure 70: Global Market - Company Share Analysis

Frequently Asked Questions

What is the projected size of the shrimp feed market in 2025?

The market is valued at USD 4.3 billion in 2025.

What is the outlook on shrimp feed demand by 2035?

The market is forecasted to reach USD 6.4 billion by 2035, reflecting a CAGR of 4%.

Which segment leads the shrimp feed market by ingredient type in 2025?

Protein sources will lead the ingredient type segment, accounting for 40% of the global market share in 2025.

What is the top functionality segment for the shrimp feed market in 2025?

Growth promotion will dominate the functionality segment with a 38% share in 2025.

Which country is projected to have the fastest-growing shrimp feed market?

Japan is projected to grow at the fastest rate, with a CAGR of 4.5% from 2025 to 2035.

Explore Similar Insights

Future Market Insights

Shrimp Feed Market