Reports

- Global Locations -

Headquarters

Future Market Insights, Inc.

Christiana Corporate, 200
Continental Drive, Suite 401,
Newark, Delaware - 19713,
United States

T: +1-347-918-3531

Americas

Future Market Insights, Inc.

616 Corporate Way, Suite 2-9018,
Valley Cottage, NY 10989, United States

MEA

Future Market Insights

1602-6 Jumeirah Bay X2 Tower, Plot No: JLT-PH2-X2A,
Jumeirah Lakes Towers, Dubai,
United Arab Emirates

Europe

Future Market Insights

3rd Floor, 207 Regent Street,
W1B 3HH London
United Kingdom

T: + 44 (0) 20 8123 9659

Asia Pacific

Future Market Insights

IndiaLand Global Tech Park, Unit UG-1, Behind Grand HighStreet, Phase 1, Hinjawadi, MH, Pune – 411057, India

Europe Massage Therapy Service Industry Outlook from 2024 to 2034

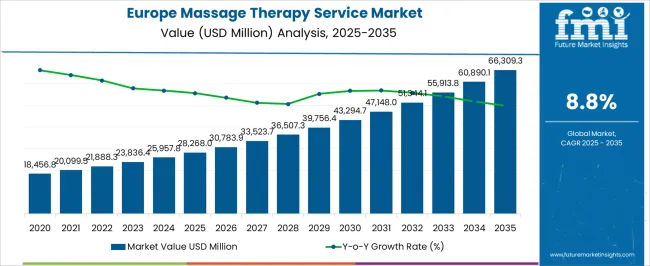
The massage therapy service industry in Europe reached a valuation of US$ 24,098.3 million in 2023. By 2034, Europe massage therapy services are projected to exhibit an 8.9% CAGR, reaching US$ 60,895.8 million. It will likely attain a valuation of US$ 25,957.8 million in 2024.

Attribute Key Insights
Base Value (2023) US$ 24,098.3 million
Estimated Europe Massage Therapy Service Industry Size (2024) US$ 25,957.8 million
Projected Europe Massage Therapy Service Revenue (2034) US$ 60,895.8 million
Value-based CAGR (2024 to 2034) 8.9%

The demand for massage therapy services is increasing, driven by a rising focus on health and wellness. Consumers in Europe are becoming more proactive in seeking alternative and complementary therapies, including massage, for relaxation and stress relief.

Massage therapy services are diversified to include several modalities and specializations, catering to different client needs. Specialized treatments, such as sports, deep tissue, and aromatherapy, are gaining popularity as people seek personalized and targeted solutions.

Technology plays a vital role in the industry. With online booking systems and mobile apps, it is easier for clients to schedule appointments and access information about services.

Leading sauna and spa establishments now offer massage therapy at home for convenience. This is mainly due to the introduction of digital services and the integration of software-based management systems.

Several companies provide unique therapies and distinct benefits for health-related purposes, concentrating on particular regions. This is anticipated to support the industry’s expansion of therapeutic services.

Don't pay for what you don't need

Customize your report by selecting specific countries or regions and save 30%!

Historical Europe Massage Therapy Service Industry Outlook Vs. 2024 to 2034

Europe's massage therapy service industry witnessed steady growth from 2019 to 2023. This was attributed to increasing awareness of the health benefits of massage, rising stress levels, and a growing aging population.

In Europe, people are becoming conscious of holistic health and wellness. As a component of a comprehensive approach to health and well-being, this tendency has helped to fuel the demand for massage therapy services.

There has been a movement in several countries in Europe to incorporate massage treatment into standard medical procedures. Since massage has been shown to offer therapeutic effects, several medical professionals have included it in their treatment strategies for specific medical disorders.

Travelers seeking spa and wellness experiences frequently travel to Europe. Several individuals worldwide travel to Europe for spa holidays, which often involve massage therapy. This has fueled industry expansion, particularly in countries recognized for providing wellness travel.

The forecast predicts a substantial surge in the industry due to the profound integration of massage therapy services into mainstream healthcare practices and advancements in massage technology.

Evolving consumer preferences toward holistic well-being and preventive healthcare, coupled with the expansion of spa and wellness tourism, are expected to significantly boost the demand for massage therapy services. As a result, Europe’s massage therapy service industry is estimated to expand at an 8.9% CAGR during the forecast period.

Europe Massage Therapy Service Industry Trends

  • Massage Therapy Services to be a Part of Corporate Wellness Initiatives

The integration of massage therapy services within corporate wellness initiatives is propelling the massage therapy service industry in Europe. Massage therapy services are becoming a cornerstone in several companies for reducing stress, improving productivity, and enhancing employee morale.

Recognizing tangible benefits such as stress reduction, alleviating musculoskeletal issues, and overall relaxation is making corporations to invest in on-site or off-site massage services as a proactive measure to enhance employee health. This strategic alignment fosters a healthy workforce, boosts employee retention, and cultivates a positive work environment.

  • Adoption of Advanced Massage Therapy Service Equipment and Tools

Adopting advanced massage therapy service equipment and tools is a pivotal catalyst propelling the growth of Europe’s massage therapy service industry.

Innovations in massage technology, including sophisticated handheld devices, specialized tables & chairs, and electronic massagers with several intensity settings, are propelling the industry. These tools offer practitioners enhanced precision, efficiency, and versatility in addressing diverse client needs, from targeted muscle relief to holistic wellness therapies.

The integration of technology is elevating the quality of massage treatments and augmenting the overall customer experience. This is further attracting a wider client base seeking personalized and technologically aided therapies. The surging demand for cutting-edge equipment signifies a key driver fueling expansion, reinforcing the industry's evolution toward more effective massage therapy services.

  • Expansion into the Healthcare Sector

Expanding into the healthcare sector within Europe’s massage therapy service industry presents multifaceted opportunities. Integrating massage therapy services into healthcare settings offers a pathway for collaboration with hospitals, rehabilitation centers, and clinics.

It is set to help in positioning services as complementary to conventional medical treatments. Partnering with healthcare providers allows for the inclusion of massage therapy services in patient care plans, catering to individuals seeking non-invasive pain management and stress reduction.

Sudip Saha
Sudip Saha

Principal Consultant

Talk to Analyst

Find your sweet spots for generating winning opportunities in this market.

Key Factors Restraining Europe’s Massage Therapy Service Industry Growth

  • Massage treatment providers are expected to face difficulties adhering to several legislation in different countries across Europe. Complying with health & safety regulations and licensing requirements is set to take time and effort.
  • Erratic and uncertain economic conditions, such as recessions or downturns, are expected to impact consumer discretionary expenditure.

Comparative View of Adjacent Europe Massage Therapy Service Industries

The movement and trends in the associated industries have been highlighted in the section below. The electric massager industry is projected to register a CAGR of 8.1% over the upcoming period.

Electric massagers with adjustable settings are gaining traction. Users can now customize their massage experience based on their tastes due to advance settings, programmable intensity levels, and massage modes.

The percussion massage gun industry in the United States is estimated to expand at a CAGR of 4.4% over the forecast period. Customers are seeking percussion massage guns with faster charging times and longer battery life. Massage guns with extended battery life are gaining momentum among consumers.

Europe Massage Therapy Service Industry Analysis:

Attribute Europe Massage Therapy Service Industry Analysis
CAGR (2024 to 2034) 8.9%
Growth Factor Eco-friendly and sustainable techniques are becoming important in several areas, including the wellness sector. Firms that provide massage therapy are adopting eco-friendly procedures, such as cutting back on their carbon footprint and employing sustainable goods.
Key Trend The demand for massage therapy services is increasing as people are becoming conscious of the value of well-being and self-care. Consumers often look for holistic approaches to health and well-being.

Electric Massager Industry Outlook:

Attribute Electric Massager Industry Outlook
CAGR (2024 to 2034) 8.1%
Growth Factor Producers are diversifying their ranges of products to provide an extensive selection of electric massagers that meet a range of requirements and tastes. Handheld massagers, massage chairs, foot massagers, and specific massagers for different body parts are all elements of this diversification.
Key Trend Manufacturers of electric massagers are adding cutting-edge technologies to their models. This incorporated functions, including app integration, smart connectivity, and cutting-edge massaging methods intended to improve user experience.

United States Percussion Massage Gun Demand Forecast:

Attribute United States Percussion Massage Gun Demand Forecast
CAGR (2024 to 2034) 4.4%
Growth Factor Manufacturers prioritize percussion massage guns’ design and mobility. Traveling and using on the go has become easier with the rising popularity of compact, lightweight, and stylish devices.
Key Trend Manufacturers are creating a range of percussion massage guns with varying features, designs, and pricing ranges in order to diversify their product lines. The goal of this movement is to serve a wide spectrum of customers with different wants and tastes.

Get the data you need at a Fraction of the cost

Personalize your report by choosing insights you need
and save 40%!

Country-wise Insights

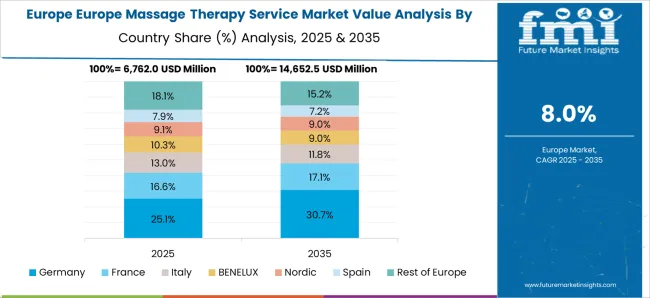
The table below shows the estimated growth rates of the top five countries. Spain, Italy, and France are set to record high CAGRs of 10.2%, 9.6%, and 8.5% respectively, through 2034.

Countries CAGR (2024 to 2034)
United Kingdom 8.0%
Germany 6.9%
France 8.5%
Spain 10.2%
Italy 9.6%

Advancement in Healthcare Landscape Spurring Growth in Germany

Germany is expected to surge at a CAGR of 6.9% through 2034. Several factors propelling the massage therapy service industry in Germany are as follows:

  • Increasing awareness of the health benefits associated with massage therapy services, such as stress reduction, pain relief, and wellness, is fueling demand among the population.
  • Rising emphasis on holistic health approaches and complementary therapies is driving the adoption of massage as a form of preventive healthcare.
  • The country's aging population is contributing significantly to the industry expansion, as massage therapy services are sought-after for addressing age-related musculoskeletal issues and promoting better mobility & comfort.
  • The incorporation of massage services in wellness centers, spas, and healthcare facilities, along with advancements in massage techniques and technology, is augmenting the industry's growth trajectory.

Government Initiatives Accelerating the Industry’s Growth in France

The massage therapy service industry in France is projected to rise at a CAGR of 8.5% by 2034. The factors responsible for this growth are as follows:

  • France's massage therapy service industry is experiencing significant growth due to a surging emphasis on self-care and well-being, particularly among urban populations, which is boosting the demand for massage services.
  • The integration of technology and online platforms facilitating easy access to booking services is contributing to expansion, making it more convenient for consumers to schedule sessions.
  • Incorporation of specialized techniques such as sports massage, aromatherapy, and prenatal massage is broadening the appeal of massage therapy services, catering to diverse client needs.
  • Government initiatives supporting alternative medicine and wellness practices are propelling the growth of the massage therapy service industry in France.

Growing Tourism Industry in Spain to Drive Demand for Massage Therapy Services

The demand for massage therapy services is increasing in Spain, with a projected CAGR of 10.2% through 2034. Emerging patterns in Spain’s industry are as follows:

  • Spain, a popular tourist destination, attracts visitors seeking relaxation and wellness services, driving the demand for massage therapy services in resorts, spas, and wellness centers across the country.
  • Technological advancements and a shift toward digital platforms for booking and accessing massage services have made it more convenient for consumers to engage with massage therapists, thereby expanding their reach.
  • The surging awareness of the therapeutic benefits of massage for addressing specific health concerns such as muscle tension, pain management, and mental well-being is fueling the growth of the massage industry in Spain.

Category-wise Insights

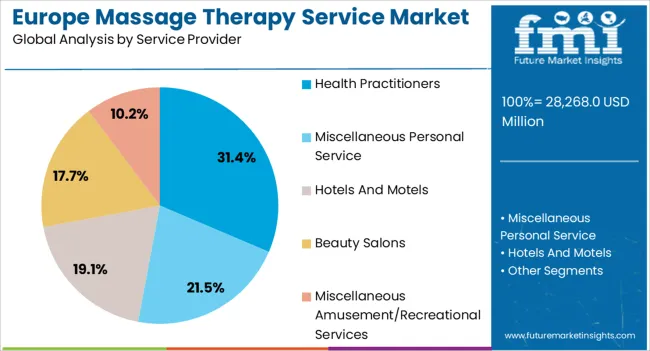
The below section shows the Thai massage segment leading in terms of service type. It is estimated to thrive at a 10.6% CAGR between 2024 and 2034. Based on service providers, the hotels and motels segment is anticipated to hold a dominant share through 2034. It is set to exhibit a CAGR of 10.8% during the forecast period.

Thai Massage to Exhibit Exponential Demand in Europe

Service Type Thai Massage
Value CAGR 10.6%

Thai massage is gaining prominence within the service types offered in Europe’s massage therapy service industry due to its unique and holistic approach to healing & relaxation. This traditional form of massage from Thailand involves a blend of acupressure, yoga-like stretching, and deep-tissue massage techniques. Its popularity in Europe stems from its ability to provide physical, mental, and spiritual benefits.

Consumers often seek Thai massage for its therapeutic effects, which include stress relief, improved flexibility, and relief from muscle tension. The distinctiveness and effectiveness of Thai massage is driving its prominence through Europe. This segment is projected to expand at a CAGR of 10.6% over the forecast period.

Hotels and Motel Service Providers to Witness High Demand Through 2034

Service Provider Hotels and Motels
Value CAGR 10.8%

Hotels and motels are emerging as leading service providers in Europe’s massage therapy industry. These establishments cater to a diverse clientele, including business travelers, tourists, and local visitors, providing an ideal platform to offer massage services to a wide range of individuals.

The convenience of accessing massage facilities within these accommodations enhances the overall guest experience, contributing to customer satisfaction and loyalty. Hotels and motels often prioritize wellness and relaxation amenities as part of their service offerings, aligning with the growing trend of travelers seeking holistic experiences.

By integrating massage therapy services into their packages, these establishments attract guests looking for rejuvenation during their stay, making them the leading service providers sought by patrons seeking comfort and convenience. The hotels and motels segment is predicted to increase at a CAGR of 10.8% over the assessment period.
Competitive Landscape

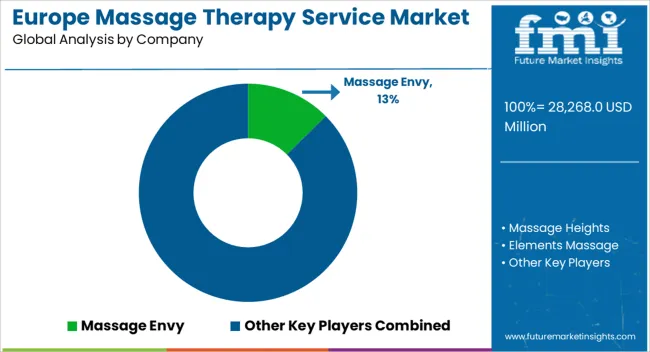
In Europe’s massage therapy service industry, a competitive landscape emerges with diverse players offering unique services and approaches. Established brands are maintaining a significant presence through their expansive network of clinics, diverse massage offerings, and emphasis on customer experience.

Europe-based brands such as Soma Body, Lush Spa, and Bliss Spa bring innovation by combining traditional techniques with modern wellness approaches, targeting niche industries with specialized services and organic products. The competitive landscape thrives on a blend of traditional practices, technological advancements, and evolving consumer demands for holistic wellness, creating a dynamic environment.

For instance,

  • In 2019, Urban Massage, a London-based firm that offers ‘on-demand’ bookings for pre-screened massage therapists, announced the launch of its new wellness services.
  • In 2023, Hand & Stone Massage and Facial Spa announced the opening of its new spa in Naples.

Key Companies Profiled

  • Massage Envy
  • Massage Heights
  • Elements Massage
  • Zeel
  • Soothe
  • Urban Massage
  • AIRE Ancient Baths
  • Balima Day Spa
  • Deep Nature Spa
  • Mandarin Oriental
  • Anantara Spa
  • Champneys
  • Ritz Carlton Spa
  • Banyan Tree Spa
  • Six Senses Spa
  • Waldorf Astoria Spa
  • Shangri- La Spa
  • Aman Spa
  • Canyon Ranch
  • SHA Wellness Clinic

Europe Massage Therapy Service Industry Segmentation by Category

By Service Type:

  • Swedish Massage
  • Deep Tissue Massage
  • Sports Massage
  • Hot Stone Massage
  • Shiatsu Massage
  • Thai Massage
  • Reflexology
  • Pregnancy Massage

By Service Provider:

  • Miscellaneous Personal Service
  • Health Practitioners
  • Hotels and Motels
  • Beauty Salons
  • Miscellaneous Amusement/Recreational Services

By Country:

  • Germany
  • France
  • United Kingdom
  • Italy
  • Spain
  • Poland
  • Belgium
  • Luxembourg
  • Denmark
  • Finland
  • Rest of Europe

Frequently Asked Questions

How big is the massage therapy service industry in Europe?

Europe's industry is set to reach US$ 25,957.8 million in 2024.

What is the forecast for the massage therapy service industry?

Demand in Europe is slated to expand at an 8.9% CAGR through 2034.

What is the outlook for the massage therapy service industry in Europe?

The target industry is set to reach US$ 60,895.8 million by 2034.

Which service type will garner significant value share by 2024?

Thai massage is expected to garner a significant value share by 2024.

What was the value of the massage therapy service industry in 2023?

The industry was valued at US$ 24,098.3 million in 2023.

Table of Content

1. Executive Summary

    1.1. Demand Outlook

    1.2. Demand Side Trends

    1.3. Supply Side Trends

    1.4. Technology Roadmap Analysis

    1.5. Analysis and Recommendations

2. Industry Overview

    2.1. Industry Coverage / Taxonomy

    2.2. Industry Definition / Scope / Limitations

3. Key Industry Trends

    3.1. Key Trends

        3.1.1. Increasing Integration of Technology

        3.1.2. Rising Focus on Holistic Wellness

        3.1.3. Growing Interest for Specialization in the Field

        3.1.4. Increased Research and Evidence-Based Practice

        3.1.5. Others (during the course of the study)

    3.2. Future Prospects of Industry

        3.2.1. Factors Fueling Growth

        3.2.2. Influx of Brands

        3.2.3. Increasing Demand of Sustainable Products

4. Industry - Pricing Analysis

    4.1. Regional Pricing Analysis By Insole Type

    4.2. Pricing Break-up

        4.2.1. Manufacturer Level Pricing

        4.2.2. Distributor Level Pricing

    4.3. Regional Average Pricing Analysis Benchmark

5. Industry Demand (in Value or Size in US$ million) Analysis 2019 to 2023 and Forecast, 2024 to 2034

    5.1. Historical Value (US$ million) Analysis, 2019 to 2023

    5.2. Current and Future Value (US$ million) Projections, 2024 to 2034

        5.2.1. Y-o-Y Growth Trend Analysis

        5.2.2. Absolute $ Opportunity Analysis

6. Industry Background

    6.1. Macro-Economic Factors

        6.1.1. GDP Growth Outlook

        6.1.2. Industry Overview

        6.1.3. Spending Outlook

        6.1.4. Consumer Spending Outlook

        6.1.5. Per Capita Income

    6.2. Forecast Factors - Relevance and Impact

        6.2.1. Top Companies Historical Growth

        6.2.2. GDP Growth Forecast

        6.2.3. Top Companies Historical Growth

        6.2.4. Gross Value Added

        6.2.5. Industry Outlook

        6.2.6. Urbanization Growth Outlook

    6.3. Value Chain

        6.3.1. Profit Margin Analysis at each sales point

        6.3.2. List and role of key participant

            6.3.2.1. Manufacture

            6.3.2.2. Distributors/Retailers

    6.4. Industry Dynamics

        6.4.1. Drivers

        6.4.2. Restraints

        6.4.3. Opportunity Analysis

    6.5. PESTLE Analysis of Industry

    6.6. Porter’s Five Force Analysis

7. Industry Analysis 2019 to 2023 and Forecast 2024 to 2034, by Service Type

    7.1. Introduction / Key Findings

    7.2. Historical Size (US$ million) Analysis By Service Type, 2019 to 2023

    7.3. Current and Future Size (US$ million) Analysis and Forecast By Service Type, 2024 to 2034

        7.3.1. Swedish Massage

        7.3.2. Deep Tissue Massage

        7.3.3. Sports Massage

        7.3.4. Hot Stone Massage

        7.3.5. Shiatsu Massage

        7.3.6. Thai Massage

        7.3.7. Reflexology

        7.3.8. Pregnancy Massage

    7.4. Industry Attractiveness Analysis By Service Type

8. Industry Analysis 2019 to 2023 and Forecast 2024 to 2034, By Service Provider

    8.1. Introduction / Key Findings

    8.2. Historical Size (US$ million) Analysis By Service Provider, 2019 to 2023

    8.3. Current and Future Size (US$ million) Analysis and Forecast By Service Provider, 2024 to 2034

        8.3.1. Miscellaneous Personal Service

        8.3.2. Health Practitioners

        8.3.3. Hotels and Motels

        8.3.4. Beauty Salons

        8.3.5. Miscellaneous Amusement/Recreational services

    8.4. Industry Attractiveness Analysis By Service Provider

9. Industry Analysis 2019 to 2023 and Forecast 2024 to 2034

    9.1. Introduction / Key Findings

    9.2. Industry Analysis

    9.3. Industry Attractiveness Analysis

10. Germany Industry Analysis 2019 to 2023 and Forecast 2024 to 2034

    10.1. Introduction

    10.2. Pricing Analysis

    10.3. Historical Size (US$ million) Trend Analysis By Taxonomy, 2019 to 2023

    10.4. Future Size (US$ million) Forecast By Taxonomy, 2024 to 2034

        10.4.1. By Service Type

        10.4.2. By Service Provider

    10.5. Industry Attractiveness Analysis

        10.5.1. By Service Type

        10.5.2. By Service Provider

    10.6. Industry Trends

    10.7. Drivers and Restraints - Impact Analysis

    10.8. Key Players Participants - Intensity Mapping

11. France Industry Analysis 2019 to 2023 and Forecast 2024 to 2034

    11.1. Introduction

    11.2. Pricing Analysis

    11.3. Historical Size (US$ million) Trend Analysis By Taxonomy, 2019 to 2023

    11.4. Future Size (US$ million) Forecast By Taxonomy, 2024 to 2034

        11.4.1. By Service Type

        11.4.2. By Service Provider

    11.5. Industry Attractiveness Analysis

        11.5.1. By Service Type

        11.5.2. By Service Provider

    11.6. Industry Trends

    11.7. Drivers and Restraints - Impact Analysis

    11.8. Key Players Participants - Intensity Mapping

12. United Kingdom Industry Analysis 2019 to 2023 and Forecast 2024 to 2034

    12.1. Introduction

    12.2. Pricing Analysis

    12.3. Historical Size (US$ million) Trend Analysis By Taxonomy, 2019 to 2023

    12.4. Future Size (US$ million) Forecast By Taxonomy, 2024 to 2034

        12.4.1. By Service Type

        12.4.2. By Service Provider

    12.5. Industry Attractiveness Analysis

        12.5.1. By Service Type

        12.5.2. By Service Provider

    12.6. Industry Trends

    12.7. Drivers and Restraints - Impact Analysis

    12.8. Key Players Participants - Intensity Mapping

13. Italy Industry Analysis 2019 to 2023 and Forecast 2024 to 2034

    13.1. Introduction

    13.2. Pricing Analysis

    13.3. Historical Size (US$ million) Trend Analysis By Taxonomy, 2019 to 2023

    13.4. Future Size (US$ million) Forecast By Taxonomy, 2024 to 2034

        13.4.1. By Service Type

        13.4.2. By Service Provider

    13.5. Industry Attractiveness Analysis

        13.5.1. By Service Type

        13.5.2. By Service Provider

    13.6. Industry Trends

    13.7. Drivers and Restraints - Impact Analysis

    13.8. Key Players Participants - Intensity Mapping

14. Spain Industry Analysis 2019 to 2023 and Forecast 2024 to 2034

    14.1. Introduction

    14.2. Pricing Analysis

    14.3. Historical Size (US$ million) Trend Analysis By Taxonomy, 2019 to 2023

    14.4. Future Size (US$ million) Forecast By Taxonomy, 2024 to 2034

        14.4.1. By Service Type

        14.4.2. By Service Provider

    14.5. Industry Attractiveness Analysis

        14.5.1. By Service Type

        14.5.2. By Service Provider

    14.6. Industry Trends

    14.7. Drivers and Restraints - Impact Analysis

    14.8. Key Players Participants - Intensity Mapping

15. Poland Industry Analysis 2019 to 2023 and Forecast 2024 to 2034

    15.1. Introduction

    15.2. Pricing Analysis

    15.3. Historical Size (US$ million) Trend Analysis By Taxonomy, 2019 to 2023

    15.4. Future Size (US$ million) Forecast By Taxonomy, 2024 to 2034

        15.4.1. By Service Type

        15.4.2. By Service Provider

    15.5. Industry Attractiveness Analysis

        15.5.1. By Service Type

        15.5.2. By Service Provider

    15.6. Industry Trends

    15.7. Drivers and Restraints - Impact Analysis

    15.8. Key Players Participants - Intensity Mapping

16. Belgium Industry Analysis 2019 to 2023 and Forecast 2024 to 2034

    16.1. Introduction

    16.2. Pricing Analysis

    16.3. Historical Size (US$ million) Trend Analysis By Taxonomy, 2019 to 2023

    16.4. Future Size (US$ million) Forecast By Taxonomy, 2024 to 2034

        16.4.1. By Service Type

        16.4.2. By Service Provider

    16.5. Industry Attractiveness Analysis

        16.5.1. By Service Type

        16.5.2. By Service Provider

    16.6. Industry Trends

    16.7. Drivers and Restraints - Impact Analysis

    16.8. Key Players Participants - Intensity Mapping

17. Luxembourg Industry Analysis 2019 to 2023 and Forecast 2024 to 2034

    17.1. Introduction

    17.2. Pricing Analysis

    17.3. Historical Size (US$ million) Trend Analysis By Taxonomy, 2019 to 2023

    17.4. Future Size (US$ million) Forecast By Taxonomy, 2024 to 2034

        17.4.1. By Service Type

        17.4.2. By Service Provider

    17.5. Industry Attractiveness Analysis

        17.5.1. By Service Type

        17.5.2. By Service Provider

    17.6. Industry Trends

    17.7. Drivers and Restraints - Impact Analysis

    17.8. Key Players Participants - Intensity Mapping

18. Denmark Industry Analysis 2019 to 2023 and Forecast 2024 to 2034

    18.1. Introduction

    18.2. Pricing Analysis

    18.3. Historical Size (US$ million) Trend Analysis By Taxonomy, 2019 to 2023

    18.4. Future Size (US$ million) Forecast By Taxonomy, 2024 to 2034

        18.4.1. By Service Type

        18.4.2. By Service Provider

    18.5. Industry Attractiveness Analysis

        18.5.1. By Service Type

        18.5.2. By Service Provider

    18.6. Industry Trends

    18.7. Drivers and Restraints - Impact Analysis

    18.8. Key Players Participants - Intensity Mapping

19. Finland Industry Analysis 2019 to 2023 and Forecast 2024 to 2034

    19.1. Introduction

    19.2. Pricing Analysis

    19.3. Historical Size (US$ million) Trend Analysis By Taxonomy, 2019 to 2023

    19.4. Future Size (US$ million) Forecast By Taxonomy, 2024 to 2034

        19.4.1. By Service Type

        19.4.2. By Service Provider

    19.5. Industry Attractiveness Analysis

        19.5.1. By Service Type

        19.5.2. By Service Provider

    19.6. Industry Trends

    19.7. Drivers and Restraints - Impact Analysis

    19.8. Key Players Participants - Intensity Mapping

20. Rest of Industry Analysis 2019 to 2023 and Forecast 2024 to 2034

    20.1. Introduction

    20.2. Pricing Analysis

    20.3. Historical Size (US$ million) Trend Analysis By Taxonomy, 2019 to 2023

    20.4. Future Size (US$ million) Forecast By Taxonomy, 2024 to 2034

        20.4.1. By Service Type

        20.4.2. By Service Provider

    20.5. Industry Attractiveness Analysis

        20.5.1. By Service Type

        20.5.2. By Service Provider

    20.6. Industry Trends

    20.7. Drivers and Restraints - Impact Analysis

    20.8. Key Players Participants - Intensity Mapping

21. Industry Structure Analysis

    21.1. Industry Analysis by Tier of Companies

    21.2. Industry Share Analysis of Top Players

    21.3. Industry Presence Analysis

22. Competition Analysis

    22.1. Competition Dashboard

    22.2. Competition Benchmarking

    22.3. Competition Deep Dive

        22.3.1. Massage Envy

            22.3.1.1. Overview

            22.3.1.2. Product Portfolio

            22.3.1.3. Profitability by Segments (Product/Channel/Region)

            22.3.1.4. Sales Footprint

            22.3.1.5. Strategy Overview

        22.3.2. Massage Heights

        22.3.3. Elements Massage

        22.3.4. Zeel

        22.3.5. Soothe

        22.3.6. Urban Massage

        22.3.7. AIRE Ancient Baths

        22.3.8. Balima Day Spa

        22.3.9. Deep Nature Spa

        22.3.10. Mandarin Oriental

        22.3.11. Anantara Spa

        22.3.12. Champneys

        22.3.13. Ritz Carlton Spa

        22.3.14. Banyan Tree Spa

        22.3.15. Six Senses Spa

        22.3.16. Waldorf Astoria Spa

        22.3.17. Shangri- La Spa

        22.3.18. Aman Spa

        22.3.19. Canyon Ranch

        22.3.20. SHA Wellness Clinic

        22.3.21. Others (as requested)

23. Assumptions and Acronyms Used

24. Research Methodology

List of Tables

Table 1: Industry Value (US$ million) Analysis By Service Type, 2019 to 2034

Table 2: Industry Value (US$ million) Analysis By Service Provider, 2019 to 2034

Table 3: Industry Value (US$ million) Analysis By Country, 2019 to 2034

Table 4: Germany Industry Value (US$ million) Analysis By Service Type, 2019 to 2034

Table 5: Germany Industry Value (US$ million) Analysis By Service Provider, 2019 to 2034

Table 6: France Industry Value (US$ million) Analysis By Service Type, 2019 to 2034

Table 7: France Industry Value (US$ million) Analysis By Service Provider, 2019 to 2034

Table 8: United Kingdom Industry Value (US$ million) Analysis By Service Type, 2019 to 2034

Table 9: United Kingdom Industry Value (US$ million) Analysis By Service Provider, 2019 to 2034

Table 10: Italy Industry Value (US$ million) Analysis By Service Type, 2019 to 2034

Table 11: Italy Industry Value (US$ million) Analysis By Service Provider, 2019 to 2034

Table 12: Spain Industry Value (US$ million) Analysis By Service Type, 2019 to 2034

Table 13: Spain Industry Value (US$ million) Analysis By Service Provider, 2019 to 2034

Table 14: Poland Industry Value (US$ million) Analysis By Service Type, 2019 to 2034

Table 15: Poland Industry Value (US$ million) Analysis By Service Provider, 2019 to 2034

Table 16: Belgium Industry Value (US$ million) Analysis By Service Type, 2019 to 2034

Table 17: Belgium Industry Value (US$ million) Analysis By Service Provider, 2019 to 2034

Table 18: Luxembourg Industry Value (US$ million) Analysis By Service Type, 2019 to 2034

Table 19: Luxembourg Industry Value (US$ million) Analysis By Service Provider, 2019 to 2034

Table 20: Denmark Industry Value (US$ million) Analysis By Service Type, 2019 to 2034

Table 21: Denmark Industry Value (US$ million) Analysis By Service Provider, 2019 to 2034

Table 22: Finland Industry Value (US$ million) Analysis By Service Type, 2019 to 2034

Table 23: Finland Industry Value (US$ million) Analysis By Service Provider, 2019 to 2034

Table 24: Rest of Industry Value (US$ million) Analysis By Service Type, 2019 to 2034

Table 25: Rest of Industry Value (US$ million) Analysis By Service Provider, 2019 to 2034

List of Charts

Figure 01: Industry Value (US$ million) Analysis, 2019 to 2023

Figure 02: Industry Value (US$ million) Analysis, 2024 to 2034

Figure 03: Industry Value (US$ million) Forecast, 2024 to 2034

Figure 04: Industry Absolute $ Opportunity Value (US$ million), 2024 to 2034

Figure 05: Industry Value (US$ million) Analysis By Service Type, 2019 to 2034

Figure 06: Industry Y-o-Y Growth (%) Projections, By Service Type, 2024 to 2034

Figure 07: Industry Attractiveness By Service Type, 2024 to 2034

Figure 08: Industry Value (US$ million) Analysis By Service Provider, 2019 to 2034

Figure 09: Industry Y-o-Y Growth (%) Projections, By Service Provider, 2024 to 2034

Figure 10: Industry Attractiveness By Service Provider, 2024 to 2034

Figure 11: Industry Value (US$ million) Analysis By Country, 2019 to 2034

Figure 12: Industry Y-o-Y Growth (%) Projections, By Country, 2024 to 2034

Figure 13: Industry Attractiveness By Country, 2024 to 2034

Figure 14: Germany Industry Value (US$ million) Analysis By Service Type, 2019 to 2034

Figure 15: Germany Industry Y-o-Y Growth (%) Projections, By Service Type, 2024 to 2034

Figure 16: Germany Industry Attractiveness By Service Type, 2024 to 2034

Figure 17: Germany Industry Value (US$ million) Analysis By Service Provider, 2019 to 2034

Figure 18: Germany Industry Y-o-Y Growth (%) Projections, By Service Provider, 2024 to 2034

Figure 19: Germany Industry Attractiveness By Service Provider, 2024 to 2034

Figure 20: France Industry Value (US$ million) Analysis By Service Type, 2019 to 2034

Figure 21: France Industry Y-o-Y Growth (%) Projections, By Service Type, 2024 to 2034

Figure 22: France Industry Attractiveness By Service Type, 2024 to 2034

Figure 23: France Industry Value (US$ million) Analysis By Service Provider, 2019 to 2034

Figure 24: France Industry Y-o-Y Growth (%) Projections, By Service Provider, 2024 to 2034

Figure 25: France Industry Attractiveness By Service Provider, 2024 to 2034

Figure 26: United Kingdom Industry Value (US$ million) Analysis By Service Type, 2019 to 2034

Figure 27: United Kingdom Industry Y-o-Y Growth (%) Projections, By Service Type, 2024 to 2034

Figure 28: United Kingdom Industry Attractiveness By Service Type, 2024 to 2034

Figure 29: United Kingdom Industry Value (US$ million) Analysis By Service Provider, 2019 to 2034

Figure 30: United Kingdom Industry Y-o-Y Growth (%) Projections, By Service Provider, 2024 to 2034

Figure 31: United Kingdom Industry Attractiveness By Service Provider, 2024 to 2034

Figure 32: Italy Industry Value (US$ million) Analysis By Service Type, 2019 to 2034

Figure 33: Italy Industry Y-o-Y Growth (%) Projections, By Service Type, 2024 to 2034

Figure 34: Italy Industry Attractiveness By Service Type, 2024 to 2034

Figure 35: Italy Industry Value (US$ million) Analysis By Service Provider, 2019 to 2034

Figure 36: Italy Industry Y-o-Y Growth (%) Projections, By Service Provider, 2024 to 2034

Figure 37: Italy Industry Attractiveness By Service Provider, 2024 to 2034

Figure 38: Spain Industry Value (US$ million) Analysis By Service Type, 2019 to 2034

Figure 39: Spain Industry Y-o-Y Growth (%) Projections, By Service Type, 2024 to 2034

Figure 40: Spain Industry Attractiveness By Service Type, 2024 to 2034

Figure 41: Spain Industry Value (US$ million) Analysis By Service Provider, 2019 to 2034

Figure 42: Spain Industry Y-o-Y Growth (%) Projections, By Service Provider, 2024 to 2034

Figure 43: Spain Industry Attractiveness By Service Provider, 2024 to 2034

Figure 44: Poland Industry Value (US$ million) Analysis By Service Type, 2019 to 2034

Figure 45: Poland Industry Y-o-Y Growth (%) Projections, By Service Type, 2024 to 2034

Figure 46: Poland Industry Attractiveness By Service Type, 2024 to 2034

Figure 47: Poland Industry Value (US$ million) Analysis By Service Provider, 2019 to 2034

Figure 48: Poland Industry Y-o-Y Growth (%) Projections, By Service Provider, 2024 to 2034

Figure 49: Poland Industry Attractiveness By Service Provider, 2024 to 2034

Figure 50: Belgium Industry Value (US$ million) Analysis By Service Type, 2019 to 2034

Figure 51: Belgium Industry Y-o-Y Growth (%) Projections, By Service Type, 2024 to 2034

Figure 52: Belgium Industry Attractiveness By Service Type, 2024 to 2034

Figure 53: Belgium Industry Value (US$ million) Analysis By Service Provider, 2019 to 2034

Figure 54: Belgium Industry Y-o-Y Growth (%) Projections, By Service Provider, 2024 to 2034

Figure 55: Belgium Industry Attractiveness By Service Provider, 2024 to 2034

Figure 56: Luxembourg Industry Value (US$ million) Analysis By Service Type, 2019 to 2034

Figure 57: Luxembourg Industry Y-o-Y Growth (%) Projections, By Service Type, 2024 to 2034

Figure 58: Luxembourg Industry Attractiveness By Service Type, 2024 to 2034

Figure 59: Luxembourg Industry Value (US$ million) Analysis By Service Provider, 2019 to 2034

Figure 60: Luxembourg Industry Y-o-Y Growth (%) Projections, By Service Provider, 2024 to 2034

Figure 61: Luxembourg Industry Attractiveness By Service Provider, 2024 to 2034

Figure 62: Denmark Industry Value (US$ million) Analysis By Service Type, 2019 to 2034

Figure 63: Denmark Industry Y-o-Y Growth (%) Projections, By Service Type, 2024 to 2034

Figure 64: Denmark Industry Attractiveness By Service Type, 2024 to 2034

Figure 65: Denmark Industry Value (US$ million) Analysis By Service Provider, 2019 to 2034

Figure 66: Denmark Industry Y-o-Y Growth (%) Projections, By Service Provider, 2024 to 2034

Figure 67: Denmark Industry Attractiveness By Service Provider, 2024 to 2034

Figure 68: Finland Industry Value (US$ million) Analysis By Service Type, 2019 to 2034

Figure 69: Finland Industry Y-o-Y Growth (%) Projections, By Service Type, 2024 to 2034

Figure 70: Finland Industry Attractiveness By Service Type, 2024 to 2034

Figure 71: Finland Industry Value (US$ million) Analysis By Service Provider, 2019 to 2034

Figure 72: Finland Industry Y-o-Y Growth (%) Projections, By Service Provider, 2024 to 2034

Figure 73: Finland Industry Attractiveness By Service Provider, 2024 to 2034

Figure 74: Rest of Industry Value (US$ million) Analysis By Service Type, 2019 to 2034

Figure 75: Rest of Industry Y-o-Y Growth (%) Projections, By Service Type, 2024 to 2034

Figure 76: Rest of Industry Attractiveness By Service Type, 2024 to 2034

Figure 77: Rest of Industry Value (US$ million) Analysis By Service Provider, 2019 to 2034

Figure 78: Rest of Industry Y-o-Y Growth (%) Projections, By Service Provider, 2024 to 2034

Figure 79: Rest of Industry Attractiveness By Service Provider, 2024 to 2034

Recommendations

Consumer Product

Mobile Phone Accessories Market

Published : January 2024

Consumer Product

Storage Water Heater Market

Published : January 2024

Consumer Product

USA Percussion Massage Gun Market

Published : August 2023

Consumer Product

Electric Massagers Market

Published : March 2023

Explore Consumer Product Insights

View Reports

Massage Therapy Service Industry Analysis in Europe