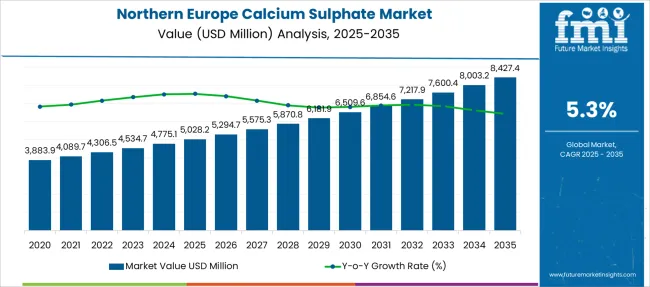
The Northern Europe Calcium Sulphate Market is estimated to be valued at USD 5028.2 million in 2025 and is projected to reach USD 8427.4 million by 2035, registering a compound annual growth rate (CAGR) of 5.3% over the forecast period.
| Metric | Value |
|---|---|
| Northern Europe Calcium Sulphate Market Estimated Value in (2025 E) | USD 5028.2 million |
| Northern Europe Calcium Sulphate Market Forecast Value in (2035 F) | USD 8427.4 million |
| Forecast CAGR (2025 to 2035) | 5.3% |
The Northern Europe calcium sulphate market is experiencing steady growth due to increased demand from industries requiring high-quality calcium sulphate products. The market is being driven by applications in construction, food processing, and pharmaceuticals where calcium sulphate plays a critical role.
Industry trends have highlighted a preference for products that offer improved performance, such as faster setting times and better durability in construction applications. The region’s focus on sustainable building materials has also encouraged the use of calcium sulphate as an eco-friendly alternative in various formulations.
Furthermore, the technical grade calcium sulphate is gaining traction because of its purity and suitability for specialized industrial uses. As regulatory standards tighten and industries seek efficient additives, the market is expected to grow steadily. Product types like anhydrous calcium sulphate are favored for their stability and performance, while coagulant functions continue to be essential in wastewater treatment and other industrial processes.
The market is segmented by Product Type, Function, Grade, and End Use and region. By Product Type, the market is divided into Anhydrous and Hydrated. In terms of Function, the market is classified into Coagulant, Thickening Agent, Excipient, Desiccant, and Additive. Based on Grade, the market is segmented into Technical, Food, and Pharma. By End Use, the market is divided into Cement & Plaster, Agrochemicals, Paint & Coatings, Paper, Mining, Food & Beverages, Cosmetics & Personal Care, and Pharmaceuticals. Regionally, the market is classified into North America, Latin America, Western Europe, Eastern Europe, Balkan & Baltic Countries, Russia & Belarus, Central Asia, East Asia, South Asia & Pacific, and the Middle East & Africa.

The anhydrous calcium sulphate segment is expected to hold 57.8% of the market revenue in 2025, making it the leading product type. This growth is driven by the product’s stability, longer shelf life, and suitability for industrial applications that require precise moisture control.
Anhydrous calcium sulphate is preferred in sectors such as construction and pharmaceuticals where its moisture-absorbing properties improve product quality and longevity. Manufacturers and end users favor this product type due to its consistency and ease of handling in manufacturing processes.
The demand for anhydrous calcium sulphate is further enhanced by its compatibility with sustainable production techniques, making it an attractive choice for industries in Northern Europe focused on environmental responsibility.
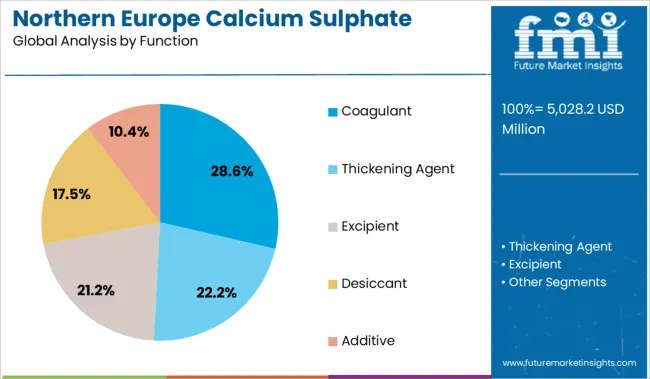
The coagulant function segment is projected to contribute 28.6% of the market revenue in 2025, positioning it as a key application area. Calcium sulphate used as a coagulant plays a vital role in water and wastewater treatment by facilitating the removal of suspended particles and impurities.
Industrial users have increasingly adopted calcium sulphate for its effectiveness in clarifying water and improving treatment efficiency. The segment benefits from regulatory mandates aimed at reducing environmental pollution and improving water quality.
As industries in Northern Europe upgrade their wastewater management systems, the demand for calcium sulphate as a coagulant is expected to rise steadily. This function’s importance in environmental compliance and sustainable operations underpins its market growth.
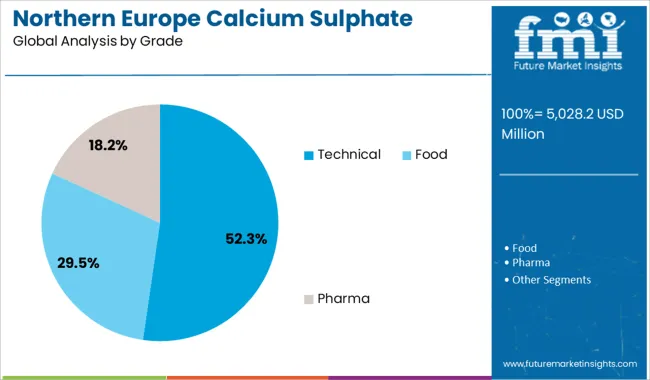
The technical grade calcium sulphate segment is projected to hold 52.3% of the market revenue in 2025, establishing it as the dominant grade category. This grade is valued for its high purity and suitability in demanding industrial processes that require precise chemical performance.
Technical grade calcium sulphate is used extensively in manufacturing, construction, and chemical industries where product consistency and quality are critical. Its applications often involve strict regulatory standards, and users prioritize technical grade products to meet these requirements.
Growth in this segment is supported by ongoing investments in industrial modernization and process optimization across Northern Europe. As industries continue to seek high-performance materials, the technical grade segment is expected to sustain its market leadership.
The demand for calcium sulphate grew at 1.8% CAGR between 2020 and 2024, opines FMI. Sales in the market are projected to expand at a robust pace during the forecast period due to its extensive use in a wide range of applications.
Calcium sulphate is an inorganic compound with the formula of CaSo4. It is available in anhydrous and hydrated forms and known by different names such as Gypsum, Plaster of Paris, or Drierite.
It has numerous industrial applications and widely used in cement and plasters, pants & coatings, and others. Calcium sulphate contains one atom of calcium and Sulphur and four atoms of oxygen. It is widely used in the construction industry along with paints & coatings, pharmaceuticals, food & beverages, and others.
Growing trend of canned & fast food due to increased travel & tourism is expected to benefit the food & beverage industry, resulting in growing demand for calcium sulphate. A variety of processed foods contain calcium sulphate, a food additive used to stabilize and firm foods while also regulating their acidity levels.
Calcium sulphate can be found in creams, milk powder, cheese, dairy-based drinks, condensed milk, whey, and dairy-based desserts. Calcium sulphate is commonly found in grain-based foods such as batters, pasta, breakfast cereals, and bakery goods as a flour treatment agent. In addition, calcium sulphate is a widely consumed coagulant, which is used to make tofu.
Further, rising application of calcium sulphate in commercial baking, meat products, canned foods, beer brewing, and others will propel the demand. Brewers use calcium sulphate dihydrate in brewing beers.
It enhances the taste of the beer, improves its stability, and increases the shelf life of the drinks. Hence, the consumption of calcium sulphate in foods & drinks is anticipated to create growth opportunities across Northern Europe.
As per FMI, sales of calcium sulphate in the food & beverage segment is projected to reach about USD 8427.4 Million by end of 2035.
The availability of substitutes in the market is the key factor expected to impede the growth during the forecast period. Low-cost alternatives such as calcium chloride, aluminium sulphate, and others are constantly threatening calcium sulphate.
As compared to calcium sulphate, calcium chloride is easier to make, more soluble in nature, and more efficient in manufacturing operations. Calcium chloride is widely used in a variety of applications, including wastewater treatment, construction, and other industries, due to its superior physiochemical properties.
In addition to this, stringent regulations imposed by the government on the excessive usage of calcium sulphate may also hamper the sales in the market.
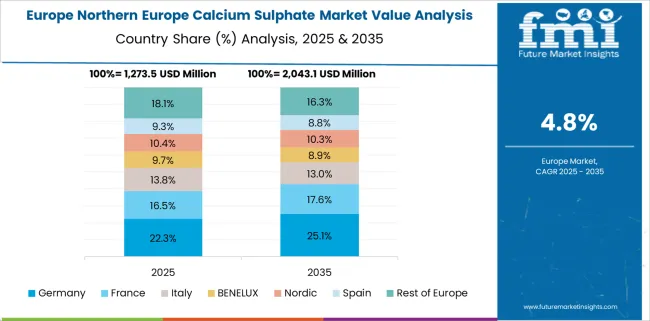
Expansion of Construction Industry to Facilitate Calcium Sulphate Demand
Calcium sulphate is one of the essential raw materials used in the construction industry. Germany is considered to be Europe’s one of the leading construction markets. Increasing application of calcium sulphate in the construction industry will propel the growth in the market.
Favorable economic environment, high demand for residential buildings, and rising application in food and beverage industry are the key factors improving the demand in the Germany calcium sulphate market.
Calcium sulphate hydrated (gypsum) & dihydrate (plaster-of-paris) are widely utilized materials in the construction industry due to their physicochemical properties. These are used in the blocks, tiles, stucco, drywall, and plasters.
Additionally, preference toward green construction practices will also drive the calcium sulphate market. Calcium sulphate aids in the decarbonization of raw materials and the low release of carbon dioxide into the atmosphere.
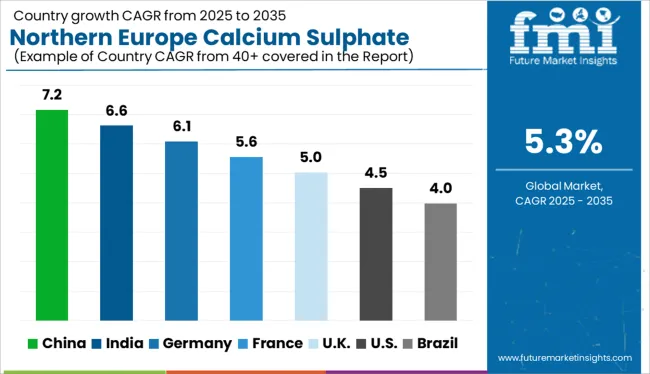
Hence, it is a raw material of choice for green construction. Subsequently, increasing infrastructural projects in Germany are also favoring the growth in calcium sulphate market. According to FMI, the calcium sulphate market in Germany is anticipated to expand at a CAGR of 6.0% during the forecast period.
Sales of Calcium Sulphate to Surge as Application in Food & Beverage Industry Rises
Calcium sulphate market in France is expected to benefit from rising applications in diverse industries. It is used as a coagulant in food & beverages, a thickening agent in paints & coatings and cosmetics, an additive in pharmaceuticals, agrochemicals, and cement & plaster.
Construction, agriculture, and infrastructure industries are witnessing robust growth in France. Construction industry utilizes calcium sulphate at various stages extensively. France is the second-largest exporter of agricultural products; hence, the consumption of calcium sulphate in fertilizers is expected to surge with growing demand for food.
Further, increased consumption of fast & canned food is expected to create remunerative growth opportunities for the calcium sulphate market. As per the study, France calcium sulphate market is expected to reach about USD 1,997.2 Million by end of the forecast period.
Burgeoning Demand for Food Products to Necessitate Calcium Sulphate Demand
Growing demand for food and agricultural products is rising, necessitating the need to produce the highest possible yield with the available agricultural land. As a result, the demand for agrochemicals is increasing to maximize production from available land.
Farmers are using gypsum (calcium sulphate dihydrate) for the past few decades. Calcium sulphate dihydrate or gypsum plays a vital role in the agriculture industry. It is a source of calcium & sulfur for plant nutrition.
Calcium is an essential element for plants for the absorption of the most nutrients. It also improves the soil structure. It helps in improving the flocculation or aggregation and also increases the water infiltration & prevents waterlogging in soil.
Growing demand from the agriculture industry is expected to drive the demand in the forecast period. The agrochemicals segment is poised to expand at a CAGR of 5.4% during the forecast period.
Favorable Government Initiatives for Infrastructure Development to Improve Calcium Sulphate Sales
The dihydrate form of calcium sulphate, gypsum, is the most widely used form and important raw material in the construction sector. It is used in the production of Portland cement, highly specialized plasters (also known as gypsum plasters) for wall surfaces, wallboard, and cement blocks and mortars.
Due to ongoing and upcoming construction projects across France and Germany, infrastructure spending will continue to rise. Growing government infrastructure development initiatives in several countries are opening up new opportunities for gypsum producers to profit from targeting the construction industry.
Increased investments in infrastructure by governing and private authorities are creating significant demand for cement. Calcium sulphate is in high demand in the construction industry as it aids in the decarbonization of raw materials and the low release of carbon dioxide into the atmosphere. The cement & plasters segment is expected to expand at a CAGR of 5.6% during the forecast period.
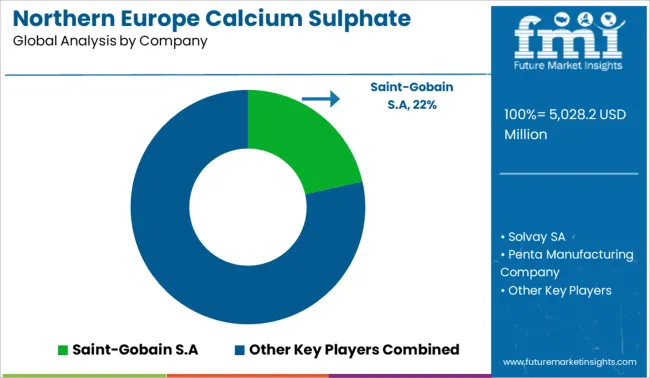
Key players are collaborating with end users in building and construction, paints and coatings industries to increase their sales. The calcium sulphate market is also expected to benefit from infrastructure spending in countries such as Germany and the UK
Some of the manufacturers are capitalizing on growing construction projects, transportation, airports, roads, and railways infrastructure.
| Attributes | Details |
|---|---|
| Estimated Year Value (2025E) | USD 5028.2 million |
| Projected Year Value (2035F) | USD 8427.4 million |
| Value CAGR (2025 to 2035) | 5.3% |
| Forecast Period | 2025 to 2035 |
| Historical Data Available for | 2020 to 2024 |
| Market Analysis | USD Million for Value and Kilo Tons for Volume |
| Key Countries Covered | Germany, United Kingdom, Ireland, France, Belgium, Netherlands, Rest of Northern Europe |
| Key Segments Covered | Product Type, Grade, Function, End Use & Country |
| Key Companies Profiled | Saint-Gobain; Solvay SA; Penta Manufacturing Company; Honeywell International Inc.; Celtic Chemicals Limited; Miber Mineral Roset; Glentham Life Sciences Limited; Fluorsid; AKO KASEI CO., LTD; JRS Pharma; Macco Organiques, s.r.o.; PENTA s.r.o.; Spectrum Chemical MFG Corp.; GFS Chemicals Inc. |
| Report Coverage |
Market Forecast, Company Share Analysis, Competition Intelligence, DROT Analysis, Market Dynamics and Challenges, and Strategic Growth Initiatives |
The global northern europe calcium sulphate market is estimated to be valued at USD 5,028.2 million in 2025.
The market size for the northern europe calcium sulphate market is projected to reach USD 8,427.4 million by 2035.
The northern europe calcium sulphate market is expected to grow at a 5.3% CAGR between 2025 and 2035.
The key product types in northern europe calcium sulphate market are anhydrous and hydrated.
In terms of function, coagulant segment to command 28.6% share in the northern europe calcium sulphate market in 2025.


Our Research Products

The "Full Research Suite" delivers actionable market intel, deep dives on markets or technologies, so clients act faster, cut risk, and unlock growth.

The Leaderboard benchmarks and ranks top vendors, classifying them as Established Leaders, Leading Challengers, or Disruptors & Challengers.

Locates where complements amplify value and substitutes erode it, forecasting net impact by horizon

We deliver granular, decision-grade intel: market sizing, 5-year forecasts, pricing, adoption, usage, revenue, and operational KPIs—plus competitor tracking, regulation, and value chains—across 60 countries broadly.

Spot the shifts before they hit your P&L. We track inflection points, adoption curves, pricing moves, and ecosystem plays to show where demand is heading, why it is changing, and what to do next across high-growth markets and disruptive tech

Real-time reads of user behavior. We track shifting priorities, perceptions of today’s and next-gen services, and provider experience, then pace how fast tech moves from trial to adoption, blending buyer, consumer, and channel inputs with social signals (#WhySwitch, #UX).

Partner with our analyst team to build a custom report designed around your business priorities. From analysing market trends to assessing competitors or crafting bespoke datasets, we tailor insights to your needs.
Supplier Intelligence
Discovery & Profiling
Capacity & Footprint
Performance & Risk
Compliance & Governance
Commercial Readiness
Who Supplies Whom
Scorecards & Shortlists
Playbooks & Docs
Category Intelligence
Definition & Scope
Demand & Use Cases
Cost Drivers
Market Structure
Supply Chain Map
Trade & Policy
Operating Norms
Deliverables
Buyer Intelligence
Account Basics
Spend & Scope
Procurement Model
Vendor Requirements
Terms & Policies
Entry Strategy
Pain Points & Triggers
Outputs
Pricing Analysis
Benchmarks
Trends
Should-Cost
Indexation
Landed Cost
Commercial Terms
Deliverables
Brand Analysis
Positioning & Value Prop
Share & Presence
Customer Evidence
Go-to-Market
Digital & Reputation
Compliance & Trust
KPIs & Gaps
Outputs
Full Research Suite comprises of:
Market outlook & trends analysis
Interviews & case studies
Strategic recommendations
Vendor profiles & capabilities analysis
5-year forecasts
8 regions and 60+ country-level data splits
Market segment data splits
12 months of continuous data updates
DELIVERED AS:
PDF EXCEL ONLINE
Northern Blotting Market Size and Share Forecast Outlook 2025 to 2035
Europe Radiotherapy Patient Positioning Market Size and Share Forecast Outlook 2025 to 2035
Europe Polyvinyl Alcohol Industry Analysis Size and Share Forecast Outlook 2025 to 2035
Europe Cruise Market Forecast and Outlook 2025 to 2035
Europe Massage Therapy Service Market Size and Share Forecast Outlook 2025 to 2035
Europe Cement Market Analysis Size and Share Forecast Outlook 2025 to 2035
European Union Tourism Industry Size and Share Forecast Outlook 2025 to 2035
Europe Injection Molding Machines Market Size and Share Forecast Outlook 2025 to 2035
Europe Injection Moulders Market Size and Share Forecast Outlook 2025 to 2035
Europe and MENA Generic Oncology Drug Market Size and Share Forecast Outlook 2025 to 2035
Europe Masking Tapes Market Size and Share Forecast Outlook 2025 to 2035
Europe Liners Market Size and Share Forecast Outlook 2025 to 2035
Europe Dermal Fillers Market Size and Share Forecast Outlook 2025 to 2035
Europe Trolley Bus Market Size and Share Forecast Outlook 2025 to 2035
Europe Protease Market Size and Share Forecast Outlook 2025 to 2035
Europe Luxury Packaging Market Size and Share Forecast Outlook 2025 to 2035
Europe & USA Consumer Electronics Packaging Market Size and Share Forecast Outlook 2025 to 2035
Europe Plant-Based Meal Kit Market Size and Share Forecast Outlook 2025 to 2035
Europe Temperature Controlled Packaging Solutions Market Size and Share Forecast Outlook 2025 to 2035
Europe Rubber Derived Unrefined Pyrolysis Oil Market Size and Share Forecast Outlook 2025 to 2035

Thank you!
You will receive an email from our Business Development Manager. Please be sure to check your SPAM/JUNK folder too.
Chat With
MaRIA